Monte Rio Airbnb Market Analysis 2026: Short Term Rental Data & Vacation Rental Statistics in California, United States
Is Airbnb profitable in Monte Rio in 2026? Explore comprehensive Airbnb analytics for Monte Rio, California, United States to uncover income potential. This 2026 STR market report for Monte Rio, based on AirROI data from February 2025 to January 2026, reveals key trends in the niche market of 104 active listings.
Whether you're considering an Airbnb investment in Monte Rio, optimizing your existing vacation rental, or exploring rental arbitrage opportunities, understanding the Monte Rio Airbnb data is crucial. Understanding the local regulations is key to maximizing your short term rental income potential. Let's dive into the specifics.
Key Monte Rio Airbnb Performance Metrics Overview
Monthly Airbnb Revenue Variations & Income Potential in Monte Rio (2026)
Understanding the monthly revenue variations for Airbnb listings in Monte Rio is key to maximizing your short term rental income potential. Seasonality significantly impacts earnings. Our analysis, based on data from the past 12 months, shows that the peak revenue month for STRs in Monte Rio is typically July, while February often presents the lowest earnings, highlighting opportunities for strategic pricing adjustments during shoulder and low seasons. Explore the typical Airbnb income in Monte Rio across different performance tiers:
- Best-in-class properties (Top 10%) achieve $10,413+ monthly, often utilizing dynamic pricing and superior guest experiences.
- Strong performing properties (Top 25%) earn $7,024 or more, indicating effective management and desirable locations/amenities.
- Typical properties (Median) generate around $4,387 per month, representing the average market performance.
- Entry-level properties (Bottom 25%) see earnings around $2,227, often with potential for optimization.
Average Monthly Airbnb Earnings Trend in Monte Rio
Monte Rio Airbnb Occupancy Rate Trends (2026)
Maximize your bookings by understanding the Monte Rio STR occupancy trends. Seasonal demand shifts significantly influence how often properties are booked. Typically, Julysees the highest demand (peak season occupancy), while January experiences the lowest (low season). Effective strategies, like adjusting minimum stays or offering promotions, can boost occupancy during slower periods. Here's how different property tiers perform in Monte Rio:
- Best-in-class properties (Top 10%) achieve 80%+ occupancy, indicating high desirability and potentially optimized availability.
- Strong performing properties (Top 25%) maintain 62% or higher occupancy, suggesting good market fit and guest satisfaction.
- Typical properties (Median) have an occupancy rate around 41%.
- Entry-level properties (Bottom 25%) average 23% occupancy, potentially facing higher vacancy.
Average Monthly Occupancy Rate Trend in Monte Rio
Average Daily Rate (ADR) Airbnb Trends in Monte Rio (2026)
Effective short term rental pricing strategy in Monte Rio involves understanding monthly ADR fluctuations. The Average Daily Rate (ADR) for Airbnb in Monte Rio typically peaks in June and dips lowest during February. Leveraging Airbnb dynamic pricing tools or strategies based on this seasonality can significantly boost revenue. Here's a look at the typical nightly rates achieved:
- Best-in-class properties (Top 10%) command rates of $554+ per night, often due to premium features or locations.
- Strong performing properties (Top 25%) achieve nightly rates of $414 or more.
- Typical properties (Median) charge around $327 per night.
- Entry-level properties (Bottom 25%) earn around $252 per night.
Average Daily Rate (ADR) Trend by Month in Monte Rio
Get Live Monte Rio Market Intelligence 👇

Explore Real-time Analytics
Airbnb Seasonality Analysis & Trends in Monte Rio (2026)
Peak Season (July, August, June)
- Revenue averages $7,430 per month
- Occupancy rates average 56.8%
- Daily rates average $390
Shoulder Season
- Revenue averages $4,962 per month
- Occupancy maintains around 41.3%
- Daily rates hold near $352
Low Season (January, February, March)
- Revenue drops to average $3,463 per month
- Occupancy decreases to average 34.4%
- Daily rates adjust to average $319
Seasonality Insights for Monte Rio
- The Airbnb seasonality in Monte Rio shows highly seasonal trends requiring careful strategy. While the sections above show seasonal averages, it's also insightful to look at the extremes:
- During the high season, the absolute peak month showcases Monte Rio's highest earning potential, with monthly revenues capable of climbing to $8,214, occupancy reaching a high of 62.1%, and ADRs peaking at $395.
- Conversely, the slowest single month of the year, typically falling within the low season, marks the market's lowest point. In this month, revenue might dip to $3,148, occupancy could drop to 31.1%, and ADRs may adjust down to $299.
- Understanding both the seasonal averages and these monthly peaks and troughs in revenue, occupancy, and ADR is crucial for maximizing your Airbnb profit potential in Monte Rio.
Seasonal Strategies for Maximizing Profit
- Peak Season: Maximize revenue through premium pricing and potentially longer minimum stays. Ensure high availability.
- Low Season: Offer competitive pricing, special promotions (e.g., extended stay discounts), and flexible cancellation policies. Target off-season travelers like remote workers or budget-conscious guests.
- Shoulder Seasons: Implement dynamic pricing that balances peak and low rates. Target weekend travelers or specific events. Offer slightly more flexible terms than peak season.
- Regularly analyze your own performance against these Monte Rio seasonality benchmarks and adjust your pricing and availability strategy accordingly.
Best Areas for Airbnb Investment in Monte Rio (2026)
Exploring the top neighborhoods for short-term rentals in Monte Rio? This section highlights key areas, outlining why they are attractive for hosts and guests, along with notable local attractions. Consider these locations based on your target guest profile and investment strategy.
| Neighborhood / Area | Why Host Here? (Target Guests & Appeal) | Key Attractions & Landmarks |
|---|---|---|
| Monte Rio Beach | A picturesque area along the Russian River, ideal for families and couples seeking relaxation. Popular for its beautiful riverfront and water activities. | Monte Rio Beach, Russian River, Kayaking and Canoeing, Wildwood State Park, Charming local shops |
| Guerneville | Just a short drive away, Guerneville is known for its vibrant LGBTQ+ community and charming small-town feel. It's a popular destination for tourists looking for fun and relaxation. | Armstrong Redwoods State Natural Reserve, Guerneville River, Local wineries, Shopping and dining in downtown, River activities |
| Duncan Mills | A quaint hamlet known for its rustic charm and proximity to the coast. It attracts visitors who love nature and outdoor activities nearby. | Russian River Estuary, Coastal Redwoods, Kayaking, Local art galleries, Nearby beaches |
| Occidental | Nestled in the redwoods, this charming town is perfect for those wanting to escape into nature. It attracts tourists interested in hiking and local culture. | Occidental Arts and Ecology Center, Nearby hiking trails, Local farmers markets, Art galleries, Historic architecture |
| Bodega Bay | Famous for its scenic coastal views and seafood, Bodega Bay attracts visitors looking for beach activities and fresh local cuisine. | Bodega Head, Point Reyes National Seashore, Local seafood restaurants, Bodega Bay Beach, Whale watching |
| Sonoma Coast State Park | A stunning stretch of coastline that draws nature lovers and photographers alike. Perfect for those wanting to explore rugged coastlines and beaches. | Stunning coastal views, Hiking trails, Wildlife viewing, Beach access, Picnic areas |
| Sebastopol | Known for its artsy vibe and apple orchards, Sebastopol attracts families and creative individuals looking for a laid-back atmosphere. | Sebastopol Farmer's Market, Ragle Ranch Regional Park, Local wineries, Art galleries, Community events |
| Santa Rosa | As the largest city in Sonoma County, Santa Rosa offers a mix of urban amenities and access to natural beauty, making it a convenient base for visitors. | Charles M. Schulz Museum, Sonoma County Museum, Railroad Square Historic District, Local breweries and restaurants, Nearby wine country |
Understanding Airbnb License Requirements & STR Laws in Monte Rio (2026)
With 22% of listings showing registration in 2026, understanding potential Airbnb license requirements is crucial in Monte Rio. Always verify the latest short term rental regulations and Airbnb license requirements directly with local government authorities for Monte Rio to ensure full compliance before hosting.
(Source: AirROI data, 2026, based on 22% licensed listings)
Top Performing Airbnb Properties in Monte Rio (2026)
Benchmark your potential! Explore examples of top-performing Airbnb properties in Monte Riobased on Trailing Twelve Month (TTM) revenue. Analyze their characteristics, revenue, occupancy rate, and ADR to understand what drives success in this market.
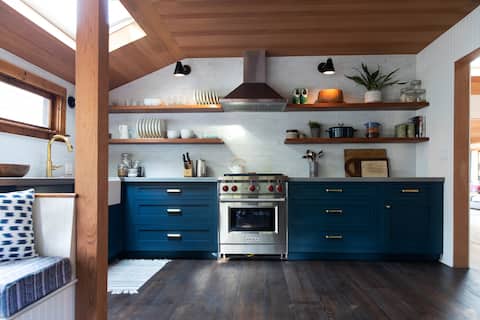
The Shelter Co. Shack - Luxury Cabin on the River
Entire Place • 4 bedrooms

Cozy, Hot Tub, Treehouse Cabin, Hi-Spd Wi-Fi
Entire Place • 2 bedrooms

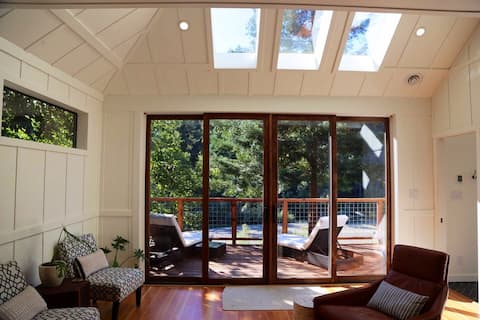
"California Dream:" Contemporary River Penthouse
Entire Place • 3 bedrooms
Riverfront Remodel | Hot Tub | Stunning Views
Entire Place • 3 bedrooms
TIRNANoG Hot Tub Gas Fireplace Fenced Yard
Entire Place • 4 bedrooms

Cozy Fires, Hot Tub, Magical Vibe, Views | Top 5%
Entire Place • 3 bedrooms
Note: Performance varies based on location, size, amenities, seasonality, and management quality. Data reflects the past 12 months.
Top Performing Airbnb Hosts in Monte Rio (2026)
Learn from the best! This table showcases top-performing Airbnb hosts in Monte Rio based on the number of properties managed and estimated total revenue over the past year. Analyze their scale and performance metrics.
| Host Name | Properties | Grossing Revenue | Stay Reviews | Avg Rating |
|---|---|---|---|---|
| River Homes | 13 | $759,525 | 627 | 4.77/5.0 |
| Russian River Getaways | 5 | $527,045 | 1177 | 4.84/5.0 |
| Pierre | 10 | $235,937 | 110 | 4.20/5.0 |
| Tom | 5 | $234,452 | 515 | 4.86/5.0 |
| Stace | 2 | $164,356 | 96 | 4.88/5.0 |
| Kelsey | 1 | $158,752 | 135 | 4.90/5.0 |
| Trudy | 1 | $154,417 | 549 | 4.96/5.0 |
| Fidel | 1 | $149,724 | 109 | 4.97/5.0 |
| Christina | 1 | $148,268 | 251 | 4.99/5.0 |
| Nathan | 1 | $145,571 | 375 | 4.99/5.0 |
Analyzing the strategies of top hosts, such as their property selection, pricing, and guest communication, can offer valuable lessons for optimizing your own Airbnb operations in Monte Rio.
Dive Deeper: Advanced Monte Rio STR Market Data (2026)
Ready to unlock more insights? AirROI provides access to advanced metrics and comprehensive Airbnb data for Monte Rio. Explore detailed analytics beyond this report to refine your investment strategy, optimize pricing, and maximize your vacation rental profits.
Explore Advanced MetricsMonte Rio Short-Term Rental Market Composition (2026): Property & Room Types
Room Type Distribution
Property Type Distribution
Market Composition Insights for Monte Rio
- The Monte Rio Airbnb market composition is heavily skewed towards Entire Home/Apt listings, which make up 84.6% of the 104 active rentals. This indicates strong guest preference for privacy and space.
- Looking at the property type distribution in Monte Rio, House properties are the most common (54.8%), reflecting the local real estate landscape.
- Houses represent a significant 54.8% portion, catering likely to families or larger groups.
- The presence of 16.3% Hotel/Boutique listings indicates integration with traditional hospitality.
- Smaller segments like others (combined 1.0%) offer potential for unique stay experiences.
Monte Rio Airbnb Room Capacity Analysis (2026): Bedroom Distribution
Distribution of Listings by Number of Bedrooms
Room Capacity Insights for Monte Rio
- The dominant room capacity in Monte Rio is 2 bedrooms listings, making up 34.6% of the market. This suggests a strong demand for properties suitable for couples or solo travelers.
- Together, 2 bedrooms and 1 bedroom properties represent 65.4% of the active Airbnb listings in Monte Rio, indicating a high concentration in these sizes.
- A significant 34.6% of listings offer 3+ bedrooms, catering to larger groups and families seeking more space in Monte Rio.
Monte Rio Vacation Rental Guest Capacity Trends (2026)
Distribution of Listings by Guest Capacity
Guest Capacity Insights for Monte Rio
- The most common guest capacity trend in Monte Rio vacation rentals is listings accommodating 4 guests (29.8%). This suggests the primary traveler segment is likely small families or groups.
- Properties designed for 4 guests and 6 guests dominate the Monte Rio STR market, accounting for 57.7% of listings.
- 42.3% of properties accommodate 6+ guests, serving the market segment for larger families or group travel in Monte Rio.
- On average, properties in Monte Rio are equipped to host 4.7 guests.
Monte Rio Airbnb Booking Patterns (2026): Available vs. Booked Days
Available Days Distribution
Booked Days Distribution
Booking Pattern Insights for Monte Rio
- The most common availability pattern in Monte Rio falls within the 181-270 days range, representing 38.5% of listings. This suggests many properties have significant open periods on their calendars.
- Approximately 71.2% of listings show high availability (181+ days open annually), indicating potential for increased bookings or specific owner usage patterns.
- For booked days, the 91-180 days range is most frequent in Monte Rio (38.5%), reflecting common guest stay durations or potential owner blocking patterns.
- A notable 28.9% of properties secure long booking periods (181+ days booked per year), highlighting successful long-term rental strategies or significant owner usage.
Monte Rio Airbnb Minimum Stay Requirements Analysis
Distribution of Listings by Minimum Night Requirement
1 Night
27 listings
26% of total
2 Nights
14 listings
13.5% of total
3 Nights
2 listings
1.9% of total
4-6 Nights
1 listings
1% of total
7-29 Nights
3 listings
2.9% of total
30+ Nights
57 listings
54.8% of total
Key Insights
- The most prevalent minimum stay requirement in Monte Rio is 30+ Nights, adopted by 54.8% of listings. This highlights the market's preference for longer commitments.
- A significant segment (54.8%) caters to monthly stays (30+ nights) in Monte Rio, pointing to opportunities in the extended-stay market.
Recommendations
- Align with the market by considering a 30+ Nights minimum stay, as 54.8% of Monte Rio hosts use this setting.
- If feasible, allowing 1-night stays, especially midweek or during low season, could capture last-minute bookings, as only 26% currently do.
- Explore offering discounts for stays of 30+ nights to attract the 54.8% of the market seeking extended stays.
- Adjust minimum nights based on seasonality – potentially shorter during low season and longer during peak demand periods in Monte Rio.
Monte Rio Airbnb Cancellation Policy Trends Analysis (2026)
Limited
2 listings
1.9% of total
Super Strict 60 Days
2 listings
1.9% of total
Super Strict 30 Days
12 listings
11.5% of total
Flexible
13 listings
12.5% of total
Moderate
17 listings
16.3% of total
Firm
40 listings
38.5% of total
Strict
18 listings
17.3% of total
Cancellation Policy Insights for Monte Rio
- The prevailing Airbnb cancellation policy trend in Monte Rio is Firm, used by 38.5% of listings.
- A majority (55.8%) of hosts in Monte Rio utilize Firm or Strict policies, indicating a market where hosts prioritize booking security.
Recommendations for Hosts
- Consider adopting a Firm policy to align with the 38.5% market standard in Monte Rio.
- Regularly review your cancellation policy against competitors and market demand shifts in Monte Rio.
Monte Rio STR Booking Lead Time Analysis (2026)
Average Booking Lead Time by Month
Booking Lead Time Insights for Monte Rio
- The overall average booking lead time for vacation rentals in Monte Rio is 46 days.
- Guests book furthest in advance for stays during July (average 85 days), likely coinciding with peak travel demand or local events.
- The shortest booking windows occur for stays in January (average 23 days), indicating more last-minute travel plans during this time.
- Seasonally, Summer (75 days avg.) sees the longest lead times, while Winter (31 days avg.) has the shortest, reflecting typical travel planning cycles.
Recommendations for Hosts
- Use the overall average lead time (46 days) as a baseline for your pricing and availability strategy in Monte Rio.
- For July stays, consider implementing length-of-stay discounts or slightly higher rates for bookings made less than 85 days out to capitalize on advance planning.
- Target marketing efforts for the Summer season well in advance (at least 75 days) to capture early planners.
- Monitor your own booking lead times against these Monte Rio averages to identify opportunities for dynamic pricing adjustments.
Popular & Essential Airbnb Amenities in Monte Rio (2026)
Amenity Prevalence
Amenity Insights for Monte Rio
- Essential amenities in Monte Rio that guests expect include: Smoke alarm, Wifi, Carbon monoxide alarm. Lacking these (any) could significantly impact bookings.
- Popular amenities like Free parking on premises, TV, Hair dryer are common but not universal. Offering these can provide a competitive edge.
Recommendations for Hosts
- Ensure your listing includes all essential amenities for Monte Rio: Smoke alarm, Wifi, Carbon monoxide alarm.
- Prioritize adding missing essentials: Carbon monoxide alarm.
- Consider adding popular differentiators like Free parking on premises or TV to increase appeal.
- Highlight unique or less common amenities you offer (e.g., hot tub, dedicated workspace, EV charger) in your listing description and photos.
- Regularly check competitor amenities in Monte Rio to stay competitive.
Monte Rio Airbnb Guest Demographics & Profile Analysis (2026)
Guest Profile Summary for Monte Rio
- The typical guest profile for Airbnb in Monte Rio consists of primarily domestic travelers (97%), often arriving from nearby San Francisco, typically belonging to the Post-2000s (Gen Z/Alpha) group (50%), primarily speaking English or Spanish.
- Domestic travelers account for 97.1% of guests.
- Key international markets include United States (97.1%) and United Kingdom (0.7%).
- Top languages spoken are English (60.9%) followed by Spanish (16.2%).
- A significant demographic segment is the Post-2000s (Gen Z/Alpha) group, representing 50% of guests.
Recommendations for Hosts
- Target domestic marketing efforts towards travelers from San Francisco and Oakland.
- Tailor amenities and listing descriptions to appeal to the dominant Post-2000s (Gen Z/Alpha) demographic (e.g., highlight fast WiFi, smart home features, local guides).
- Highlight unique local experiences or amenities relevant to the primary guest profile.
- Consider seasonal promotions aligned with peak travel times for key origin markets.
Nearby Short-Term Rental Market Comparison
How does the Monte Rio Airbnb market stack up against its neighbors? Compare key performance metrics like average monthly revenue, ADR, and occupancy rates in surrounding areas to understand the broader regional STR landscape.
| Market | Active Properties | Monthly Revenue | Daily Rate | Avg. Occupancy |
|---|---|---|---|---|
| Moss Beach | 34 | $10,092 | $676.91 | 53% |
| Sonoma | 228 | $9,647 | $819.87 | 43% |
| Marshall | 18 | $8,897 | $607.75 | 50% |
| St. Helena | 50 | $8,684 | $924.70 | 38% |
| Kenwood | 60 | $8,643 | $810.83 | 41% |
| Glen Ellen | 85 | $8,482 | $799.53 | 43% |
| Eldridge | 21 | $8,410 | $930.61 | 41% |
| Dillon Beach | 82 | $8,062 | $703.26 | 41% |
| Stinson Beach | 106 | $7,814 | $812.15 | 43% |
| Healdsburg | 195 | $7,538 | $744.46 | 41% |