Moorpark Airbnb Market Analysis 2025: Short Term Rental Data & Vacation Rental Statistics in California, United States
Is Airbnb profitable in Moorpark in 2025? Explore comprehensive Airbnb analytics for Moorpark, California, United States to uncover income potential. This 2025 STR market report for Moorpark, based on AirROI data from October 2024 to September 2025, reveals key trends in the niche market of 19 active listings.
Whether you're considering an Airbnb investment in Moorpark, optimizing your existing vacation rental, or exploring rental arbitrage opportunities, understanding the Moorpark Airbnb data is crucial. Leveraging the low regulation environment is key to maximizing your short term rental income potential. Let's dive into the specifics.
Key Moorpark Airbnb Performance Metrics Overview
Monthly Airbnb Revenue Variations & Income Potential in Moorpark (2025)
Understanding the monthly revenue variations for Airbnb listings in Moorpark is key to maximizing your short term rental income potential. Seasonality significantly impacts earnings. Our analysis, based on data from the past 12 months, shows that the peak revenue month for STRs in Moorpark is typically August, while January often presents the lowest earnings, highlighting opportunities for strategic pricing adjustments during shoulder and low seasons. Explore the typical Airbnb income in Moorpark across different performance tiers:
- Best-in-class properties (Top 10%) achieve $15,066+ monthly, often utilizing dynamic pricing and superior guest experiences.
- Strong performing properties (Top 25%) earn $5,670 or more, indicating effective management and desirable locations/amenities.
- Typical properties (Median) generate around $1,627 per month, representing the average market performance.
- Entry-level properties (Bottom 25%) see earnings around $872, often with potential for optimization.
Average Monthly Airbnb Earnings Trend in Moorpark
Moorpark Airbnb Occupancy Rate Trends (2025)
Maximize your bookings by understanding the Moorpark STR occupancy trends. Seasonal demand shifts significantly influence how often properties are booked. Typically, Octobersees the highest demand (peak season occupancy), while September experiences the lowest (low season). Effective strategies, like adjusting minimum stays or offering promotions, can boost occupancy during slower periods. Here's how different property tiers perform in Moorpark:
- Best-in-class properties (Top 10%) achieve 80%+ occupancy, indicating high desirability and potentially optimized availability.
- Strong performing properties (Top 25%) maintain 64% or higher occupancy, suggesting good market fit and guest satisfaction.
- Typical properties (Median) have an occupancy rate around 38%.
- Entry-level properties (Bottom 25%) average 22% occupancy, potentially facing higher vacancy.
Average Monthly Occupancy Rate Trend in Moorpark
Average Daily Rate (ADR) Airbnb Trends in Moorpark (2025)
Effective short term rental pricing strategy in Moorpark involves understanding monthly ADR fluctuations. The Average Daily Rate (ADR) for Airbnb in Moorpark typically peaks in July and dips lowest during February. Leveraging Airbnb dynamic pricing tools or strategies based on this seasonality can significantly boost revenue. Here's a look at the typical nightly rates achieved:
- Best-in-class properties (Top 10%) command rates of $630+ per night, often due to premium features or locations.
- Strong performing properties (Top 25%) achieve nightly rates of $457 or more.
- Typical properties (Median) charge around $121 per night.
- Entry-level properties (Bottom 25%) earn around $75 per night.
Average Daily Rate (ADR) Trend by Month in Moorpark
Get Live Moorpark Market Intelligence 👇

Explore Real-time Analytics
Airbnb Seasonality Analysis & Trends in Moorpark (2025)
Peak Season (August, July, May)
- Revenue averages $7,756 per month
- Occupancy rates average 49.2%
- Daily rates average $372
Shoulder Season
- Revenue averages $4,710 per month
- Occupancy maintains around 42.3%
- Daily rates hold near $325
Low Season (January, November, December)
- Revenue drops to average $3,186 per month
- Occupancy decreases to average 40.3%
- Daily rates adjust to average $299
Seasonality Insights for Moorpark
- The Airbnb seasonality in Moorpark shows highly seasonal trends requiring careful strategy. While the sections above show seasonal averages, it's also insightful to look at the extremes:
- During the high season, the absolute peak month showcases Moorpark's highest earning potential, with monthly revenues capable of climbing to $8,655, occupancy reaching a high of 55.8%, and ADRs peaking at $383.
- Conversely, the slowest single month of the year, typically falling within the low season, marks the market's lowest point. In this month, revenue might dip to $2,743, occupancy could drop to 35.5%, and ADRs may adjust down to $293.
- Understanding both the seasonal averages and these monthly peaks and troughs in revenue, occupancy, and ADR is crucial for maximizing your Airbnb profit potential in Moorpark.
Seasonal Strategies for Maximizing Profit
- Peak Season: Maximize revenue through premium pricing and potentially longer minimum stays. Ensure high availability.
- Low Season: Offer competitive pricing, special promotions (e.g., extended stay discounts), and flexible cancellation policies. Target off-season travelers like remote workers or budget-conscious guests.
- Shoulder Seasons: Implement dynamic pricing that balances peak and low rates. Target weekend travelers or specific events. Offer slightly more flexible terms than peak season.
- Regularly analyze your own performance against these Moorpark seasonality benchmarks and adjust your pricing and availability strategy accordingly.
Best Areas for Airbnb Investment in Moorpark (2025)
Exploring the top neighborhoods for short-term rentals in Moorpark? This section highlights key areas, outlining why they are attractive for hosts and guests, along with notable local attractions. Consider these locations based on your target guest profile and investment strategy.
| Neighborhood / Area | Why Host Here? (Target Guests & Appeal) | Key Attractions & Landmarks |
|---|---|---|
| Moorpark City Center | The heart of Moorpark with shopping, dining, and entertainment options. Ideal for travelers looking for convenience and access to local amenities. | Moorpark Community Park, Moorpark Train Station, Moorpark Historic District, Local Restaurants, Moorpark College |
| Simi Valley | Close to Moorpark, Simi Valley offers additional attractions and is popular among families visiting the area. It’s a larger city with more options for guests. | Ronald Reagan Presidential Library, Simi Valley Town Center, Strathearn Historical Park, The Simi Valley Cultural Arts Center, Local hiking trails |
| Santa Susana Pass State Historic Park | Natural beauty and outdoor activities attract guests looking for nature and hiking experiences close to Moorpark. | Scenic hiking trails, Wildlife watching, Historical ruins, Picnic areas, Natural landscapes |
| Thousand Oaks | Nearby city with upscale shopping and dining, drawing visitors for both business and leisure. | The Oaks Mall, California Lutheran University, Conejo Valley Botanic Garden, Mature parks, Local vineyards |
| Ventura | A bit further out, but known for its beaches and coastal vibes. Great for those looking for a beach getaway yet close to Moorpark. | Ventura Beach, Ventura Pier, The Channel Islands, Mission San Buenaventura, Local surf spots |
| Piru | A small, quaint town with charm and access to surrounding natural beauty, suitable for guests looking for a quiet getaway. | Lake Piru, Piru Creek, Outdoor recreation options, Local history, Natural scenery |
| Tierra Rejada Valley | Known for its agricultural beauty and wineries, the valley attracts those interested in wine tourism and scenic stays. | Local wineries, Scenic views, Hiking opportunities, Farmers Markets, Nature spots |
| Saticoy | A small community with close proximity to larger cities, appealing for guests who enjoy a quiet stay while having easy access to nearby amenities. | Saticoy Regional Park, Local farms, Community events, Quiet neighborhoods, Nature trails |
Understanding Airbnb License Requirements & STR Laws in Moorpark (2025)
While Moorpark, California, United States currently shows low STR regulations, specific Airbnb license requirements might still exist or change. Always verify the latest short term rental regulations and Airbnb license requirements directly with local government authorities for Moorpark to ensure full compliance before hosting.
(Source: AirROI data, 2025, based on 5% licensed listings)
Top Performing Airbnb Properties in Moorpark (2025)
Benchmark your potential! Explore examples of top-performing Airbnb properties in Moorparkbased on Trailing Twelve Month (TTM) revenue. Analyze their characteristics, revenue, occupancy rate, and ADR to understand what drives success in this market.
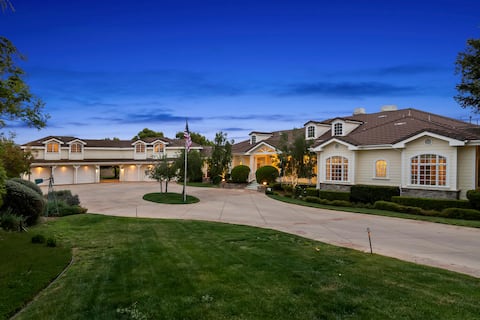
1600 Views
Entire Place • 7 bedrooms
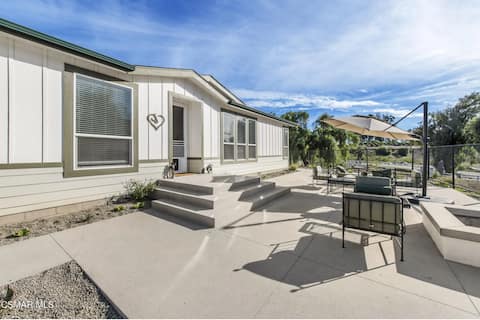
The Estate House at Rancho
Entire Place • 5 bedrooms
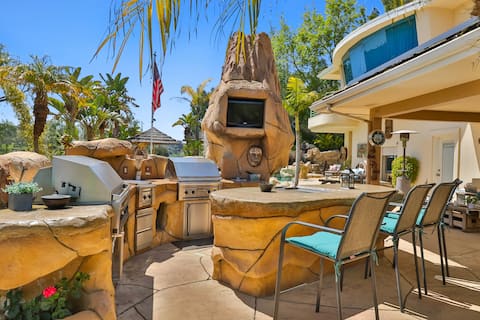
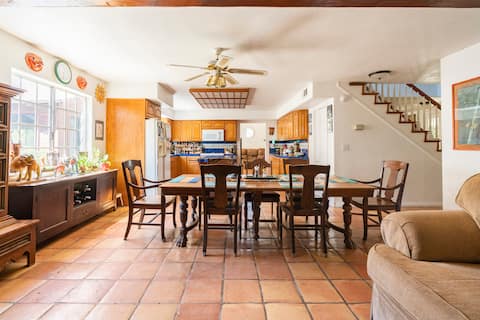
The Elegant Escape
Entire Place • 5 bedrooms
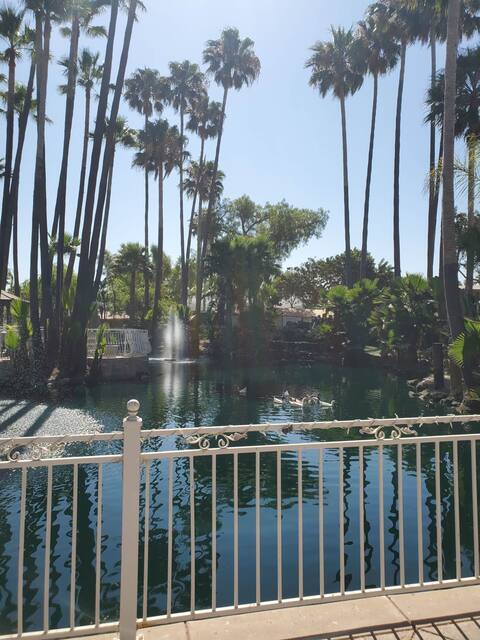
Island Style Oasis Home- Island in the Sky
Entire Place • 3 bedrooms
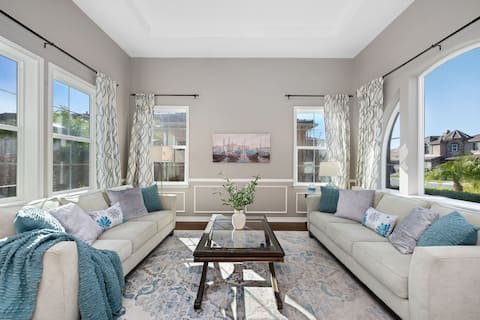
Peaceful Private Farmhouse
Entire Place • 3 bedrooms
Restful room in a bamboo garden
Private Room • N/A
Note: Performance varies based on location, size, amenities, seasonality, and management quality. Data reflects the past 12 months.
Top Performing Airbnb Hosts in Moorpark (2025)
Learn from the best! This table showcases top-performing Airbnb hosts in Moorpark based on the number of properties managed and estimated total revenue over the past year. Analyze their scale and performance metrics.
| Host Name | Properties | Grossing Revenue | Stay Reviews | Avg Rating |
|---|---|---|---|---|
| Ilan | 1 | $277,467 | 26 | 4.96/5.0 |
| Debi | 1 | $165,650 | 13 | 5.00/5.0 |
| John | 1 | $91,857 | 13 | 5.00/5.0 |
| Summer | 1 | $90,753 | 171 | 4.91/5.0 |
| Sean | 1 | $42,377 | 34 | 5.00/5.0 |
| Lynda Brothers | 3 | $34,296 | 493 | 4.87/5.0 |
| Christine | 1 | $16,412 | 105 | 4.91/5.0 |
| Paul | 1 | $15,373 | 173 | 4.81/5.0 |
| Mario | 1 | $12,429 | 22 | 5.00/5.0 |
| Debbie | 1 | $10,355 | 570 | 4.97/5.0 |
Analyzing the strategies of top hosts, such as their property selection, pricing, and guest communication, can offer valuable lessons for optimizing your own Airbnb operations in Moorpark.
Dive Deeper: Advanced Moorpark STR Market Data (2025)
Ready to unlock more insights? AirROI provides access to advanced metrics and comprehensive Airbnb data for Moorpark. Explore detailed analytics beyond this report to refine your investment strategy, optimize pricing, and maximize your vacation rental profits.
Explore Advanced MetricsMoorpark Short-Term Rental Market Composition (2025): Property & Room Types
Room Type Distribution
Property Type Distribution
Market Composition Insights for Moorpark
- The Moorpark Airbnb market composition is heavily skewed towards Private Room listings, which make up 57.9% of the 19 active rentals. This indicates strong guest preference for privacy and space.
- Looking at the property type distribution in Moorpark, House properties are the most common (89.5%), reflecting the local real estate landscape.
- Houses represent a significant 89.5% portion, catering likely to families or larger groups.
- The presence of 5.3% Hotel/Boutique listings indicates integration with traditional hospitality.
Moorpark Airbnb Room Capacity Analysis (2025): Bedroom Distribution
Distribution of Listings by Number of Bedrooms
Room Capacity Insights for Moorpark
- The dominant room capacity in Moorpark is 1 bedroom listings, making up 26.3% of the market. This suggests a strong demand for properties suitable for couples or solo travelers.
- Together, 1 bedroom and 5+ bedrooms properties represent 42.1% of the active Airbnb listings in Moorpark, indicating a high concentration in these sizes.
- A significant 31.6% of listings offer 3+ bedrooms, catering to larger groups and families seeking more space in Moorpark.
Moorpark Vacation Rental Guest Capacity Trends (2025)
Distribution of Listings by Guest Capacity
Guest Capacity Insights for Moorpark
- The most common guest capacity trend in Moorpark vacation rentals is listings accommodating 2 guests (26.3%). This suggests the primary traveler segment is likely couples or solo travelers.
- Properties designed for 2 guests and 8+ guests dominate the Moorpark STR market, accounting for 52.6% of listings.
- 31.6% of properties accommodate 6+ guests, serving the market segment for larger families or group travel in Moorpark.
- On average, properties in Moorpark are equipped to host 3.2 guests.
Moorpark Airbnb Booking Patterns (2025): Available vs. Booked Days
Available Days Distribution
Booked Days Distribution
Booking Pattern Insights for Moorpark
- The most common availability pattern in Moorpark falls within the 271-366 days range, representing 47.4% of listings. This suggests many properties have significant open periods on their calendars.
- Approximately 79.0% of listings show high availability (181+ days open annually), indicating potential for increased bookings or specific owner usage patterns.
- For booked days, the 91-180 days range is most frequent in Moorpark (36.8%), reflecting common guest stay durations or potential owner blocking patterns.
- A notable 21.1% of properties secure long booking periods (181+ days booked per year), highlighting successful long-term rental strategies or significant owner usage.
Moorpark Airbnb Minimum Stay Requirements Analysis
Distribution of Listings by Minimum Night Requirement
1 Night
4 listings
21.1% of total
2 Nights
4 listings
21.1% of total
3 Nights
3 listings
15.8% of total
7-29 Nights
3 listings
15.8% of total
30+ Nights
5 listings
26.3% of total
Key Insights
- The most prevalent minimum stay requirement in Moorpark is 30+ Nights, adopted by 26.3% of listings. This highlights the market's preference for longer commitments.
- A significant segment (26.3%) caters to monthly stays (30+ nights) in Moorpark, pointing to opportunities in the extended-stay market.
Recommendations
- Align with the market by considering a 30+ Nights minimum stay, as 26.3% of Moorpark hosts use this setting.
- If feasible, allowing 1-night stays, especially midweek or during low season, could capture last-minute bookings, as only 21.1% currently do.
- Explore offering discounts for stays of 30+ nights to attract the 26.3% of the market seeking extended stays.
- Adjust minimum nights based on seasonality – potentially shorter during low season and longer during peak demand periods in Moorpark.
Moorpark Airbnb Cancellation Policy Trends Analysis (2025)
Flexible
6 listings
31.6% of total
Moderate
7 listings
36.8% of total
Firm
4 listings
21.1% of total
Strict
2 listings
10.5% of total
Cancellation Policy Insights for Moorpark
- The prevailing Airbnb cancellation policy trend in Moorpark is Moderate, used by 36.8% of listings.
- There's a relatively balanced mix between guest-friendly (68.4%) and stricter (31.6%) policies, offering choices for different guest needs.
Recommendations for Hosts
- Consider adopting a Moderate policy to align with the 36.8% market standard in Moorpark.
- Using a Strict policy might deter some guests, as only 10.5% of listings use it. Evaluate if potential revenue protection outweighs possible lower booking rates.
- Regularly review your cancellation policy against competitors and market demand shifts in Moorpark.
Moorpark STR Booking Lead Time Analysis (2025)
Average Booking Lead Time by Month
Booking Lead Time Insights for Moorpark
- The overall average booking lead time for vacation rentals in Moorpark is 39 days.
- Guests book furthest in advance for stays during May (average 70 days), likely coinciding with peak travel demand or local events.
- The shortest booking windows occur for stays in January (average 28 days), indicating more last-minute travel plans during this time.
- Seasonally, Spring (58 days avg.) sees the longest lead times, while Winter (32 days avg.) has the shortest, reflecting typical travel planning cycles.
Recommendations for Hosts
- Use the overall average lead time (39 days) as a baseline for your pricing and availability strategy in Moorpark.
- For May stays, consider implementing length-of-stay discounts or slightly higher rates for bookings made less than 70 days out to capitalize on advance planning.
- Target marketing efforts for the Spring season well in advance (at least 58 days) to capture early planners.
- Monitor your own booking lead times against these Moorpark averages to identify opportunities for dynamic pricing adjustments.
Popular & Essential Airbnb Amenities in Moorpark (2025)
Amenity Prevalence
Amenity Insights for Moorpark
- Essential amenities in Moorpark that guests expect include: Wifi, Smoke alarm. Lacking these (any) could significantly impact bookings.
- Popular amenities like Free parking on premises, Fire extinguisher, TV are common but not universal. Offering these can provide a competitive edge.
Recommendations for Hosts
- Ensure your listing includes all essential amenities for Moorpark: Wifi, Smoke alarm.
- Consider adding popular differentiators like Free parking on premises or Fire extinguisher to increase appeal.
- Highlight unique or less common amenities you offer (e.g., hot tub, dedicated workspace, EV charger) in your listing description and photos.
- Regularly check competitor amenities in Moorpark to stay competitive.
Moorpark Airbnb Guest Demographics & Profile Analysis (2025)
Guest Profile Summary for Moorpark
- The typical guest profile for Airbnb in Moorpark consists of primarily domestic travelers (89%), often arriving from nearby Los Angeles, typically belonging to the Post-2000s (Gen Z/Alpha) group (50%), primarily speaking English or Spanish.
- Domestic travelers account for 89.1% of guests.
- Key international markets include United States (89.1%) and Canada (1.5%).
- Top languages spoken are English (62.3%) followed by Spanish (13.1%).
- A significant demographic segment is the Post-2000s (Gen Z/Alpha) group, representing 50% of guests.
Recommendations for Hosts
- Target domestic marketing efforts towards travelers from Los Angeles and San Diego.
- Tailor amenities and listing descriptions to appeal to the dominant Post-2000s (Gen Z/Alpha) demographic (e.g., highlight fast WiFi, smart home features, local guides).
- Highlight unique local experiences or amenities relevant to the primary guest profile.
- Consider seasonal promotions aligned with peak travel times for key origin markets.
Nearby Short-Term Rental Market Comparison
How does the Moorpark Airbnb market stack up against its neighbors? Compare key performance metrics like average monthly revenue, ADR, and occupancy rates in surrounding areas to understand the broader regional STR landscape.
| Market | Active Properties | Monthly Revenue | Daily Rate | Avg. Occupancy |
|---|---|---|---|---|
| Montecito | 131 | $9,993 | $931.49 | 48% |
| Newport Beach | 1,223 | $8,523 | $724.03 | 46% |
| Malibu | 292 | $7,601 | $1219.61 | 35% |
| Manhattan Beach | 259 | $7,527 | $564.79 | 53% |
| Toro Canyon | 35 | $7,264 | $699.50 | 41% |
| La Palma | 10 | $6,670 | $326.43 | 55% |
| Avalon | 225 | $6,669 | $671.58 | 37% |
| Summerland | 74 | $6,455 | $499.72 | 48% |
| Rancho Santa Fe | 33 | $6,232 | $877.55 | 33% |
| Unincorporated Santa Monica Mountains | 137 | $6,040 | $732.39 | 40% |