Moss Beach Airbnb Market Analysis 2026: Short Term Rental Data & Vacation Rental Statistics in California, United States
Is Airbnb profitable in Moss Beach in 2026? Explore comprehensive Airbnb analytics for Moss Beach, California, United States to uncover income potential. This 2026 STR market report for Moss Beach, based on AirROI data from February 2025 to January 2026, reveals key trends in the niche market of 34 active listings.
Whether you're considering an Airbnb investment in Moss Beach, optimizing your existing vacation rental, or exploring rental arbitrage opportunities, understanding the Moss Beach Airbnb data is crucial. Leveraging the low regulation environment is key to maximizing your short term rental income potential. Let's dive into the specifics.
Key Moss Beach Airbnb Performance Metrics Overview
Monthly Airbnb Revenue Variations & Income Potential in Moss Beach (2026)
Understanding the monthly revenue variations for Airbnb listings in Moss Beach is key to maximizing your short term rental income potential. Seasonality significantly impacts earnings. Our analysis, based on data from the past 12 months, shows that the peak revenue month for STRs in Moss Beach is typically July, while February often presents the lowest earnings, highlighting opportunities for strategic pricing adjustments during shoulder and low seasons. Explore the typical Airbnb income in Moss Beach across different performance tiers:
- Best-in-class properties (Top 10%) achieve $20,611+ monthly, often utilizing dynamic pricing and superior guest experiences.
- Strong performing properties (Top 25%) earn $14,765 or more, indicating effective management and desirable locations/amenities.
- Typical properties (Median) generate around $9,297 per month, representing the average market performance.
- Entry-level properties (Bottom 25%) see earnings around $4,950, often with potential for optimization.
Average Monthly Airbnb Earnings Trend in Moss Beach
Moss Beach Airbnb Occupancy Rate Trends (2026)
Maximize your bookings by understanding the Moss Beach STR occupancy trends. Seasonal demand shifts significantly influence how often properties are booked. Typically, Julysees the highest demand (peak season occupancy), while January experiences the lowest (low season). Effective strategies, like adjusting minimum stays or offering promotions, can boost occupancy during slower periods. Here's how different property tiers perform in Moss Beach:
- Best-in-class properties (Top 10%) achieve 85%+ occupancy, indicating high desirability and potentially optimized availability.
- Strong performing properties (Top 25%) maintain 70% or higher occupancy, suggesting good market fit and guest satisfaction.
- Typical properties (Median) have an occupancy rate around 54%.
- Entry-level properties (Bottom 25%) average 37% occupancy, potentially facing higher vacancy.
Average Monthly Occupancy Rate Trend in Moss Beach
Average Daily Rate (ADR) Airbnb Trends in Moss Beach (2026)
Effective short term rental pricing strategy in Moss Beach involves understanding monthly ADR fluctuations. The Average Daily Rate (ADR) for Airbnb in Moss Beach typically peaks in June and dips lowest during February. Leveraging Airbnb dynamic pricing tools or strategies based on this seasonality can significantly boost revenue. Here's a look at the typical nightly rates achieved:
- Best-in-class properties (Top 10%) command rates of $976+ per night, often due to premium features or locations.
- Strong performing properties (Top 25%) achieve nightly rates of $707 or more.
- Typical properties (Median) charge around $514 per night.
- Entry-level properties (Bottom 25%) earn around $383 per night.
Average Daily Rate (ADR) Trend by Month in Moss Beach
Get Live Moss Beach Market Intelligence 👇

Explore Real-time Analytics
Airbnb Seasonality Analysis & Trends in Moss Beach (2026)
Peak Season (July, October, August)
- Revenue averages $14,841 per month
- Occupancy rates average 67.2%
- Daily rates average $664
Shoulder Season
- Revenue averages $10,967 per month
- Occupancy maintains around 51.8%
- Daily rates hold near $659
Low Season (January, February, March)
- Revenue drops to average $7,548 per month
- Occupancy decreases to average 45.4%
- Daily rates adjust to average $593
Seasonality Insights for Moss Beach
- The Airbnb seasonality in Moss Beach shows highly seasonal trends requiring careful strategy. While the sections above show seasonal averages, it's also insightful to look at the extremes:
- During the high season, the absolute peak month showcases Moss Beach's highest earning potential, with monthly revenues capable of climbing to $15,564, occupancy reaching a high of 71.3%, and ADRs peaking at $706.
- Conversely, the slowest single month of the year, typically falling within the low season, marks the market's lowest point. In this month, revenue might dip to $6,552, occupancy could drop to 43.7%, and ADRs may adjust down to $574.
- Understanding both the seasonal averages and these monthly peaks and troughs in revenue, occupancy, and ADR is crucial for maximizing your Airbnb profit potential in Moss Beach.
Seasonal Strategies for Maximizing Profit
- Peak Season: Maximize revenue through premium pricing and potentially longer minimum stays. Ensure high availability.
- Low Season: Offer competitive pricing, special promotions (e.g., extended stay discounts), and flexible cancellation policies. Target off-season travelers like remote workers or budget-conscious guests.
- Shoulder Seasons: Implement dynamic pricing that balances peak and low rates. Target weekend travelers or specific events. Offer slightly more flexible terms than peak season.
- Regularly analyze your own performance against these Moss Beach seasonality benchmarks and adjust your pricing and availability strategy accordingly.
Best Areas for Airbnb Investment in Moss Beach (2026)
Exploring the top neighborhoods for short-term rentals in Moss Beach? This section highlights key areas, outlining why they are attractive for hosts and guests, along with notable local attractions. Consider these locations based on your target guest profile and investment strategy.
| Neighborhood / Area | Why Host Here? (Target Guests & Appeal) | Key Attractions & Landmarks |
|---|---|---|
| Moss Beach | A serene coastal area known for its beautiful beaches and proximity to natural attractions. Ideal for guests looking for a quiet getaway while enjoying outdoor activities like hiking and whale watching. | Moss Beach Distillery, Fitzgerald Marine Reserve, Pescadero Marsh Natural Preserve, Gray Whale Cove State Beach, Seal Cove Beach |
| Half Moon Bay | A picturesque coastal town with stunning views, charming downtown, and countless outdoor activities. Popular for guests seeking beach access and a small-town feel. | Half Moon Bay State Beach, Pigeon Point Lighthouse, Mavericks Beach, Half Moon Bay Harbor, Local tide pools |
| Montara | A small coastal community with rugged cliffs and breathtaking ocean views. A perfect escape for those who love nature and want to explore the scenic coastline. | Montara State Beach, Mavericks Surf Spot, Pescadero Creek County Park, Gray Whale Cove State Beach |
| Pacifica | Close to Moss Beach, Pacifica offers beautiful beaches and hiking trails. It's increasingly popular with visitors looking for outdoor adventures and seaside relaxation. | Pacifica State Beach, Mori Point, Pedro Point Headlands, Sweeney Ridge Trail, Pacific Manor Beach |
| San Mateo County Coast | The entire coastal stretch offers diverse options for outdoor activities and breathtaking views, attracting visitors year-round. | Ano Nuevo State Park, Pigeon Point Lighthouse, Davenport Beach, Natural Bridges State Beach |
| San Francisco | A short drive away, San Francisco offers cosmopolitan attractions, unique neighborhoods, and cultural experiences. Perfect for guests looking to explore a famous city. | Golden Gate Bridge, Alcatraz Island, Fisherman's Wharf, Chinatown, Golden Gate Park |
| Burlingame | Proximity to the Bay Area and offers great dining and shopping options, making it suitable for business travelers and holiday visitors alike. | Coyote Point Park, Burlingame Avenue, Burlingame Museum of Pez Memorabilia, Skyline Boulevard |
| Redwood City | A vibrant tech hub with great restaurants and close to popular attractions. It attracts business travelers and leisure visitors enjoying the Bay Area. | Redwood City Downtown, Fox Theatre, Pulgas Water Temple, Edgewood Park and Natural Preserve |
Understanding Airbnb License Requirements & STR Laws in Moss Beach (2026)
While Moss Beach, California, United States currently shows low STR regulations, specific Airbnb license requirements might still exist or change. Always verify the latest short term rental regulations and Airbnb license requirements directly with local government authorities for Moss Beach to ensure full compliance before hosting.
(Source: AirROI data, 2026, finding no licensed listings among those analyzed)
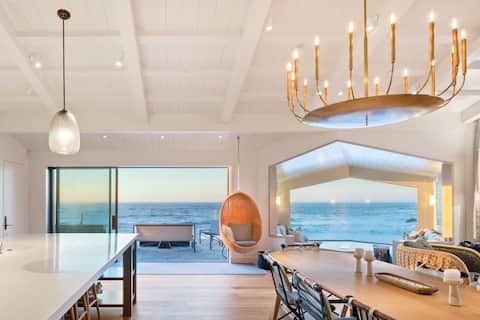
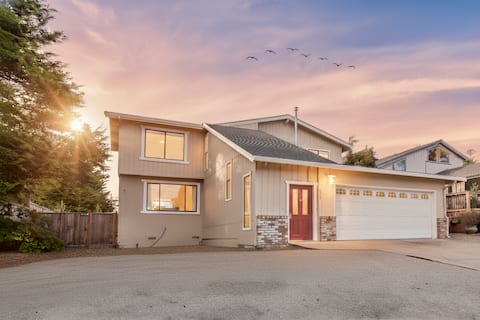
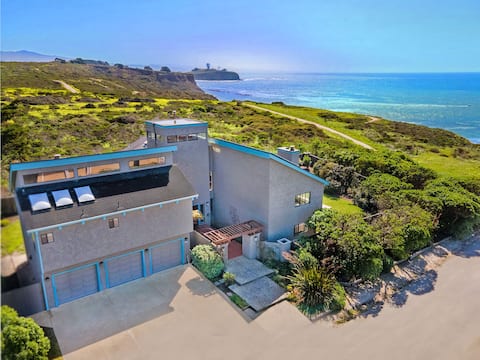
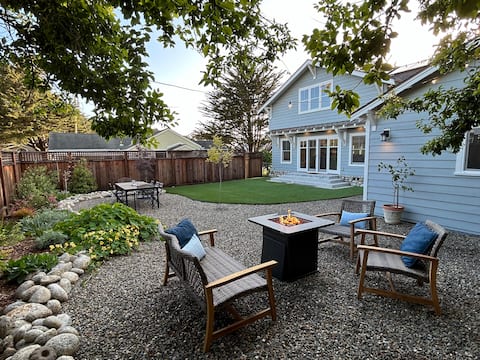
Top Performing Airbnb Properties in Moss Beach (2026)
Benchmark your potential! Explore examples of top-performing Airbnb properties in Moss Beachbased on Trailing Twelve Month (TTM) revenue. Analyze their characteristics, revenue, occupancy rate, and ADR to understand what drives success in this market.
The Pacific Dream
Entire Place • 4 bedrooms

Walk to the Beach from this Ocean Front Home
Entire Place • 2 bedrooms
3,000+ sqft | Walk to beaches, tidepools | Pets OK
Entire Place • 5 bedrooms

Oceanfront Home Retreat w Breathtaking Views of
Entire Place • 4 bedrooms
Unmatched Ocean Beach and Mountain Views
Entire Place • 4 bedrooms
Walk to the Beach Bungalow-near Half Moon Bay/SF
Entire Place • 3 bedrooms
Note: Performance varies based on location, size, amenities, seasonality, and management quality. Data reflects the past 12 months.
Top Performing Airbnb Hosts in Moss Beach (2026)
Learn from the best! This table showcases top-performing Airbnb hosts in Moss Beach based on the number of properties managed and estimated total revenue over the past year. Analyze their scale and performance metrics.
| Host Name | Properties | Grossing Revenue | Stay Reviews | Avg Rating |
|---|---|---|---|---|
| Andreia | 3 | $534,113 | 328 | 4.84/5.0 |
| Carlos | 1 | $427,688 | 30 | 4.93/5.0 |
| Amy | 3 | $343,813 | 312 | 4.97/5.0 |
| Carlos Bernardo | 1 | $293,687 | 272 | 4.93/5.0 |
| Sharin | 2 | $246,365 | 241 | 4.91/5.0 |
| Ruth | 1 | $193,130 | 58 | 5.00/5.0 |
| Katia | 1 | $187,118 | 68 | 4.99/5.0 |
| Sandra | 1 | $180,871 | 64 | 4.92/5.0 |
| Ovr | 1 | $177,288 | 34 | 4.88/5.0 |
| Scott | 3 | $167,052 | 323 | 4.92/5.0 |
Analyzing the strategies of top hosts, such as their property selection, pricing, and guest communication, can offer valuable lessons for optimizing your own Airbnb operations in Moss Beach.
Dive Deeper: Advanced Moss Beach STR Market Data (2026)
Ready to unlock more insights? AirROI provides access to advanced metrics and comprehensive Airbnb data for Moss Beach. Explore detailed analytics beyond this report to refine your investment strategy, optimize pricing, and maximize your vacation rental profits.
Explore Advanced MetricsMoss Beach Short-Term Rental Market Composition (2026): Property & Room Types
Room Type Distribution
Property Type Distribution
Market Composition Insights for Moss Beach
- The Moss Beach Airbnb market composition is heavily skewed towards Entire Home/Apt listings, which make up 94.1% of the 34 active rentals. This indicates strong guest preference for privacy and space.
- Looking at the property type distribution in Moss Beach, House properties are the most common (85.3%), reflecting the local real estate landscape.
- Houses represent a significant 85.3% portion, catering likely to families or larger groups.
- Smaller segments like hotel/boutique (combined 2.9%) offer potential for unique stay experiences.
Moss Beach Airbnb Room Capacity Analysis (2026): Bedroom Distribution
Distribution of Listings by Number of Bedrooms
Room Capacity Insights for Moss Beach
- The dominant room capacity in Moss Beach is 3 bedrooms listings, making up 38.2% of the market. This suggests a strong demand for properties suitable for families or small groups.
- Together, 3 bedrooms and 4 bedrooms properties represent 55.8% of the active Airbnb listings in Moss Beach, indicating a high concentration in these sizes.
- A significant 64.6% of listings offer 3+ bedrooms, catering to larger groups and families seeking more space in Moss Beach.
Moss Beach Vacation Rental Guest Capacity Trends (2026)
Distribution of Listings by Guest Capacity
Guest Capacity Insights for Moss Beach
- The most common guest capacity trend in Moss Beach vacation rentals is listings accommodating 6 guests (41.2%). This suggests the primary traveler segment is likely larger groups.
- Properties designed for 6 guests and 8+ guests dominate the Moss Beach STR market, accounting for 76.5% of listings.
- 76.5% of properties accommodate 6+ guests, serving the market segment for larger families or group travel in Moss Beach.
- On average, properties in Moss Beach are equipped to host 6.1 guests.
Moss Beach Airbnb Booking Patterns (2026): Available vs. Booked Days
Available Days Distribution
Booked Days Distribution
Booking Pattern Insights for Moss Beach
- The most common availability pattern in Moss Beach falls within the 181-270 days range, representing 41.2% of listings. This suggests many properties have significant open periods on their calendars.
- Approximately 53.0% of listings show high availability (181+ days open annually), indicating potential for increased bookings or specific owner usage patterns.
- For booked days, the 91-180 days range is most frequent in Moss Beach (41.2%), reflecting common guest stay durations or potential owner blocking patterns.
- A notable 50.0% of properties secure long booking periods (181+ days booked per year), highlighting successful long-term rental strategies or significant owner usage.
Moss Beach Airbnb Minimum Stay Requirements Analysis
Distribution of Listings by Minimum Night Requirement
1 Night
3 listings
8.8% of total
2 Nights
18 listings
52.9% of total
3 Nights
1 listings
2.9% of total
30+ Nights
12 listings
35.3% of total
Key Insights
- The most prevalent minimum stay requirement in Moss Beach is 2 Nights, adopted by 52.9% of listings. This highlights the market's preference for shorter, flexible bookings.
- A strong majority (61.7%) of the Moss Beach Airbnb data shows acceptance of very short stays (1-2 nights), indicating a dynamic, high-turnover market.
- A significant segment (35.3%) caters to monthly stays (30+ nights) in Moss Beach, pointing to opportunities in the extended-stay market.
Recommendations
- Align with the market by considering a 2 Nights minimum stay, as 52.9% of Moss Beach hosts use this setting.
- If feasible, allowing 1-night stays, especially midweek or during low season, could capture last-minute bookings, as only 8.8% currently do.
- A 2-night minimum appears standard (52.9%). Consider this for weekends or peak periods.
- Explore offering discounts for stays of 30+ nights to attract the 35.3% of the market seeking extended stays.
- Adjust minimum nights based on seasonality – potentially shorter during low season and longer during peak demand periods in Moss Beach.
Moss Beach Airbnb Cancellation Policy Trends Analysis (2026)
Flexible
4 listings
11.8% of total
Moderate
14 listings
41.2% of total
Firm
13 listings
38.2% of total
Strict
3 listings
8.8% of total
Cancellation Policy Insights for Moss Beach
- The prevailing Airbnb cancellation policy trend in Moss Beach is Moderate, used by 41.2% of listings.
- There's a relatively balanced mix between guest-friendly (53.0%) and stricter (47.0%) policies, offering choices for different guest needs.
- Strict cancellation policies are quite rare (8.8%), potentially making listings with this policy less competitive unless justified by high demand or property type.
Recommendations for Hosts
- Consider adopting a Moderate policy to align with the 41.2% market standard in Moss Beach.
- Using a Strict policy might deter some guests, as only 8.8% of listings use it. Evaluate if potential revenue protection outweighs possible lower booking rates.
- Regularly review your cancellation policy against competitors and market demand shifts in Moss Beach.
Moss Beach STR Booking Lead Time Analysis (2026)
Average Booking Lead Time by Month
Booking Lead Time Insights for Moss Beach
- The overall average booking lead time for vacation rentals in Moss Beach is 45 days.
- Guests book furthest in advance for stays during August (average 67 days), likely coinciding with peak travel demand or local events.
- The shortest booking windows occur for stays in January (average 27 days), indicating more last-minute travel plans during this time.
- Seasonally, Summer (57 days avg.) sees the longest lead times, while Winter (38 days avg.) has the shortest, reflecting typical travel planning cycles.
Recommendations for Hosts
- Use the overall average lead time (45 days) as a baseline for your pricing and availability strategy in Moss Beach.
- For August stays, consider implementing length-of-stay discounts or slightly higher rates for bookings made less than 67 days out to capitalize on advance planning.
- Target marketing efforts for the Summer season well in advance (at least 57 days) to capture early planners.
- Monitor your own booking lead times against these Moss Beach averages to identify opportunities for dynamic pricing adjustments.
Popular & Essential Airbnb Amenities in Moss Beach (2026)
Amenity Prevalence
Amenity Insights for Moss Beach
- Essential amenities in Moss Beach that guests expect include: Smoke alarm, Wifi, Hangers, Shampoo, Hair dryer, Essentials, Hot water, Carbon monoxide alarm, Heating, Microwave. Lacking these (any) could significantly impact bookings.
Recommendations for Hosts
- Ensure your listing includes all essential amenities for Moss Beach: Smoke alarm, Wifi, Hangers, Shampoo, Hair dryer, Essentials, Hot water, Carbon monoxide alarm, Heating, Microwave.
- Prioritize adding missing essentials: Carbon monoxide alarm, Heating, Microwave.
- Highlight unique or less common amenities you offer (e.g., hot tub, dedicated workspace, EV charger) in your listing description and photos.
- Regularly check competitor amenities in Moss Beach to stay competitive.
Moss Beach Airbnb Guest Demographics & Profile Analysis (2026)
Guest Profile Summary for Moss Beach
- The typical guest profile for Airbnb in Moss Beach consists of primarily domestic travelers (95%), often arriving from nearby San Francisco, typically belonging to the Post-2000s (Gen Z/Alpha) group (50%), primarily speaking English or Spanish.
- Domestic travelers account for 94.7% of guests.
- Key international markets include United States (94.7%) and United Kingdom (1.3%).
- Top languages spoken are English (65.7%) followed by Spanish (12.4%).
- A significant demographic segment is the Post-2000s (Gen Z/Alpha) group, representing 50% of guests.
Recommendations for Hosts
- Target domestic marketing efforts towards travelers from San Francisco and San Jose.
- Tailor amenities and listing descriptions to appeal to the dominant Post-2000s (Gen Z/Alpha) demographic (e.g., highlight fast WiFi, smart home features, local guides).
- Highlight unique local experiences or amenities relevant to the primary guest profile.
- Consider seasonal promotions aligned with peak travel times for key origin markets.
Nearby Short-Term Rental Market Comparison
How does the Moss Beach Airbnb market stack up against its neighbors? Compare key performance metrics like average monthly revenue, ADR, and occupancy rates in surrounding areas to understand the broader regional STR landscape.
| Market | Active Properties | Monthly Revenue | Daily Rate | Avg. Occupancy |
|---|---|---|---|---|
| Carmel Point | 15 | $14,483 | $1046.17 | 54% |
| Del Monte Forest | 105 | $10,280 | $964.89 | 47% |
| Sonoma | 228 | $9,647 | $819.87 | 43% |
| Marshall | 18 | $8,897 | $607.75 | 50% |
| St. Helena | 50 | $8,684 | $924.70 | 38% |
| Carmel-by-the-Sea | 305 | $8,657 | $680.02 | 49% |
| Kenwood | 60 | $8,643 | $810.83 | 41% |
| Glen Ellen | 85 | $8,482 | $799.53 | 43% |
| Eldridge | 21 | $8,410 | $930.61 | 41% |
| Dillon Beach | 82 | $8,062 | $703.26 | 41% |