Olympic Valley Airbnb Market Analysis 2026: Short Term Rental Data & Vacation Rental Statistics in California, United States
Is Airbnb profitable in Olympic Valley in 2026? Explore comprehensive Airbnb analytics for Olympic Valley, California, United States to uncover income potential. This 2026 STR market report for Olympic Valley, based on AirROI data from February 2025 to January 2026, reveals key trends in the market of 441 active listings.
Whether you're considering an Airbnb investment in Olympic Valley, optimizing your existing vacation rental, or exploring rental arbitrage opportunities, understanding the Olympic Valley Airbnb data is crucial. Leveraging the low regulation environment is key to maximizing your short term rental income potential. Let's dive into the specifics.
Key Olympic Valley Airbnb Performance Metrics Overview
Monthly Airbnb Revenue Variations & Income Potential in Olympic Valley (2026)
Understanding the monthly revenue variations for Airbnb listings in Olympic Valley is key to maximizing your short term rental income potential. Seasonality significantly impacts earnings. Our analysis, based on data from the past 12 months, shows that the peak revenue month for STRs in Olympic Valley is typically February, while October often presents the lowest earnings, highlighting opportunities for strategic pricing adjustments during shoulder and low seasons. Explore the typical Airbnb income in Olympic Valley across different performance tiers:
- Best-in-class properties (Top 10%) achieve $12,174+ monthly, often utilizing dynamic pricing and superior guest experiences.
- Strong performing properties (Top 25%) earn $7,468 or more, indicating effective management and desirable locations/amenities.
- Typical properties (Median) generate around $4,305 per month, representing the average market performance.
- Entry-level properties (Bottom 25%) see earnings around $2,410, often with potential for optimization.
Average Monthly Airbnb Earnings Trend in Olympic Valley
Olympic Valley Airbnb Occupancy Rate Trends (2026)
Maximize your bookings by understanding the Olympic Valley STR occupancy trends. Seasonal demand shifts significantly influence how often properties are booked. Typically, Februarysees the highest demand (peak season occupancy), while October experiences the lowest (low season). Effective strategies, like adjusting minimum stays or offering promotions, can boost occupancy during slower periods. Here's how different property tiers perform in Olympic Valley:
- Best-in-class properties (Top 10%) achieve 63%+ occupancy, indicating high desirability and potentially optimized availability.
- Strong performing properties (Top 25%) maintain 46% or higher occupancy, suggesting good market fit and guest satisfaction.
- Typical properties (Median) have an occupancy rate around 31%.
- Entry-level properties (Bottom 25%) average 19% occupancy, potentially facing higher vacancy.
Average Monthly Occupancy Rate Trend in Olympic Valley
Average Daily Rate (ADR) Airbnb Trends in Olympic Valley (2026)
Effective short term rental pricing strategy in Olympic Valley involves understanding monthly ADR fluctuations. The Average Daily Rate (ADR) for Airbnb in Olympic Valley typically peaks in January and dips lowest during October. Leveraging Airbnb dynamic pricing tools or strategies based on this seasonality can significantly boost revenue. Here's a look at the typical nightly rates achieved:
- Best-in-class properties (Top 10%) command rates of $1,014+ per night, often due to premium features or locations.
- Strong performing properties (Top 25%) achieve nightly rates of $668 or more.
- Typical properties (Median) charge around $428 per night.
- Entry-level properties (Bottom 25%) earn around $322 per night.
Average Daily Rate (ADR) Trend by Month in Olympic Valley
Get Live Olympic Valley Market Intelligence 👇

Explore Real-time Analytics
Airbnb Seasonality Analysis & Trends in Olympic Valley (2026)
Peak Season (February, March, January)
- Revenue averages $9,898 per month
- Occupancy rates average 50.2%
- Daily rates average $646
Shoulder Season
- Revenue averages $5,418 per month
- Occupancy maintains around 33.1%
- Daily rates hold near $541
Low Season (September, October, November)
- Revenue drops to average $2,600 per month
- Occupancy decreases to average 19.3%
- Daily rates adjust to average $469
Seasonality Insights for Olympic Valley
- The Airbnb seasonality in Olympic Valley shows highly seasonal trends requiring careful strategy. While the sections above show seasonal averages, it's also insightful to look at the extremes:
- During the high season, the absolute peak month showcases Olympic Valley's highest earning potential, with monthly revenues capable of climbing to $11,412, occupancy reaching a high of 59.1%, and ADRs peaking at $669.
- Conversely, the slowest single month of the year, typically falling within the low season, marks the market's lowest point. In this month, revenue might dip to $2,298, occupancy could drop to 18.4%, and ADRs may adjust down to $462.
- Understanding both the seasonal averages and these monthly peaks and troughs in revenue, occupancy, and ADR is crucial for maximizing your Airbnb profit potential in Olympic Valley.
Seasonal Strategies for Maximizing Profit
- Peak Season: Maximize revenue through premium pricing and potentially longer minimum stays. Ensure high availability.
- Low Season: Offer competitive pricing, special promotions (e.g., extended stay discounts), and flexible cancellation policies. Target off-season travelers like remote workers or budget-conscious guests.
- Shoulder Seasons: Implement dynamic pricing that balances peak and low rates. Target weekend travelers or specific events. Offer slightly more flexible terms than peak season.
- Regularly analyze your own performance against these Olympic Valley seasonality benchmarks and adjust your pricing and availability strategy accordingly.
Best Areas for Airbnb Investment in Olympic Valley (2026)
Exploring the top neighborhoods for short-term rentals in Olympic Valley? This section highlights key areas, outlining why they are attractive for hosts and guests, along with notable local attractions. Consider these locations based on your target guest profile and investment strategy.
| Neighborhood / Area | Why Host Here? (Target Guests & Appeal) | Key Attractions & Landmarks |
|---|---|---|
| Olympic Valley Village | The heart of Olympic Valley, offering easy access to skiing, dining, and shopping. It attracts outdoor enthusiasts year-round, especially during ski season. | Squaw Valley Ski Resort, The Olympic Museum, Alpine Meadows Ski Resort, Squaw Valley Adventure Center, Restaurants and Shops in Olympic Valley Village |
| Squaw Valley Ski Resort | A renowned skiing destination that draws winter sports lovers from all over the country. Ideal for Airbnb hosting for families and groups looking for winter getaways. | Squaw Valley Ski Resort, High Camp, Lake Tahoe |
| Tahoe National Forest | A vast area of natural beauty, perfect for nature lovers and outdoor activities such as hiking, biking, and fishing. Attracts those seeking a rustic retreat. | Hiking Trails, Lake Angela, Lakes Basin, Sierra Nevada Mountains |
| Shirley Canyon | Offers stunning panoramic views and an array of outdoor activities, this area is a hidden gem for hikers and nature lovers. | Shirley Canyon Trail, Waterfalls, Wildflower Viewing |
| Alpine Meadows | Another popular ski area, attracting snow sports enthusiasts and summer hikers alike. Great for year-round rental potential. | Alpine Meadows Ski Resort, Hiking Trails, Lake Mary |
| Lake Tahoe | A premier destination for outdoor recreational activities in both summer and winter, making it a top choice for vacation rentals. | Lake Tahoe Beaches, Boating and Watersports, Scenic Drives, Hiking Trails |
| Donner Lake | A picturesque lake area that offers plenty of water activities and is popular for family getaways, especially in summer. | Donner Lake State Park, Picnic Areas, Swimming, Boating |
| Tahoe City | A charming town on the north shore of Lake Tahoe, close to various amenities and outdoor activities, appealing to travelers seeking a quaint escape. | Commons Beach, Tahoe City Marina, Local Shops and Restaurants, Hiking Trails |
Understanding Airbnb License Requirements & STR Laws in Olympic Valley (2026)
While Olympic Valley, California, United States currently shows low STR regulations, specific Airbnb license requirements might still exist or change. Always verify the latest short term rental regulations and Airbnb license requirements directly with local government authorities for Olympic Valley to ensure full compliance before hosting.
(Source: AirROI data, 2026, based on 9% licensed listings)
Top Performing Airbnb Properties in Olympic Valley (2026)
Benchmark your potential! Explore examples of top-performing Airbnb properties in Olympic Valleybased on Trailing Twelve Month (TTM) revenue. Analyze their characteristics, revenue, occupancy rate, and ADR to understand what drives success in this market.
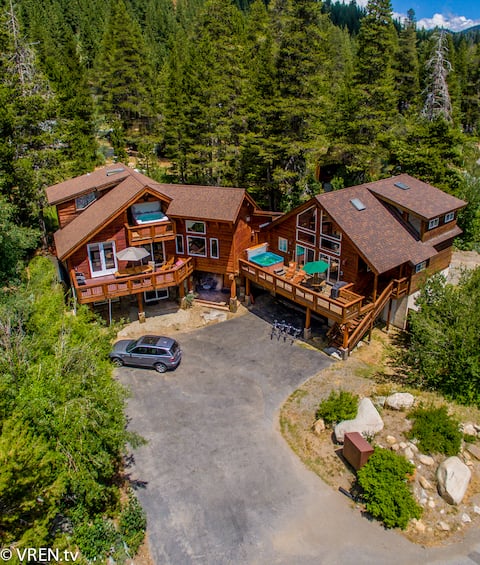
EaglesExecLodge 2 Houses 2 Hottubs views Palisades
Entire Place • 6 bedrooms

Tahoe Mountain Aperture | Hot Tub & Peloton
Entire Place • 5 bedrooms
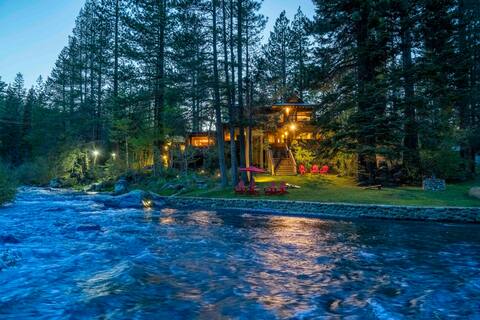
River Run at Olympic Valley - Riverfront Gem!
Entire Place • 4 bedrooms
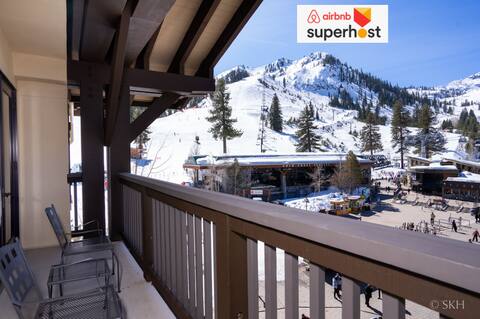
3BR Condo in Village at Palisades - Premier
Entire Place • 3 bedrooms

Retro Ski Home, Private Hot Tub, Free Ski Shuttle
Entire Place • 6 bedrooms
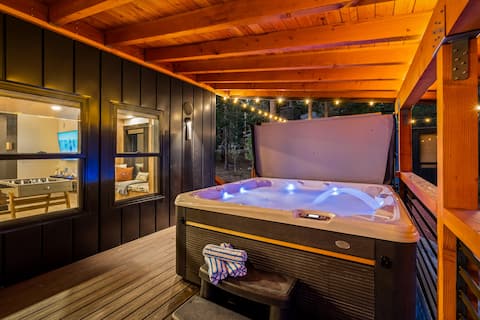
Ski Days, Hot Tub Nights • Pet-Friendly Luxe Home
Entire Place • 4 bedrooms
Note: Performance varies based on location, size, amenities, seasonality, and management quality. Data reflects the past 12 months.
Top Performing Airbnb Hosts in Olympic Valley (2026)
Learn from the best! This table showcases top-performing Airbnb hosts in Olympic Valley based on the number of properties managed and estimated total revenue over the past year. Analyze their scale and performance metrics.
| Host Name | Properties | Grossing Revenue | Stay Reviews | Avg Rating |
|---|---|---|---|---|
| Palisades Tahoe Lodge Rentals | 110 | $4,703,349 | 999 | 4.74/5.0 |
| Tahoe Getaways LLC | 27 | $1,855,618 | 550 | 4.77/5.0 |
| Lunabase Travelstays | 6 | $858,110 | 130 | 4.97/5.0 |
| Beverly | 20 | $766,725 | 1292 | 4.87/5.0 |
| Michelle | 16 | $670,866 | 123 | 4.70/5.0 |
| Tahoe Mt Properties | 5 | $636,209 | 41 | 4.94/5.0 |
| Tahoe Vacation Rentals | 14 | $600,636 | 279 | 4.83/5.0 |
| Tahoe Luxury Properties | 5 | $423,306 | 31 | 4.93/5.0 |
| BookitBnB | 10 | $419,993 | 73 | 4.87/5.0 |
| Grand Welcome | 5 | $391,442 | 115 | 4.33/5.0 |
Analyzing the strategies of top hosts, such as their property selection, pricing, and guest communication, can offer valuable lessons for optimizing your own Airbnb operations in Olympic Valley.
Dive Deeper: Advanced Olympic Valley STR Market Data (2026)
Ready to unlock more insights? AirROI provides access to advanced metrics and comprehensive Airbnb data for Olympic Valley. Explore detailed analytics beyond this report to refine your investment strategy, optimize pricing, and maximize your vacation rental profits.
Explore Advanced MetricsOlympic Valley Short-Term Rental Market Composition (2026): Property & Room Types
Room Type Distribution
Property Type Distribution
Market Composition Insights for Olympic Valley
- The Olympic Valley Airbnb market composition is heavily skewed towards Entire Home/Apt listings, which make up 90.2% of the 441 active rentals. This indicates strong guest preference for privacy and space.
- Looking at the property type distribution in Olympic Valley, Apartment/Condo properties are the most common (63%), reflecting the local real estate landscape.
- Houses represent a significant 23.4% portion, catering likely to families or larger groups.
- The presence of 9.1% Hotel/Boutique listings indicates integration with traditional hospitality.
- Smaller segments like outdoor/unique, others (combined 4.6%) offer potential for unique stay experiences.
Olympic Valley Airbnb Room Capacity Analysis (2026): Bedroom Distribution
Distribution of Listings by Number of Bedrooms
Room Capacity Insights for Olympic Valley
- The dominant room capacity in Olympic Valley is 1 bedroom listings, making up 30.6% of the market. This suggests a strong demand for properties suitable for couples or solo travelers.
- Together, 1 bedroom and 2 bedrooms properties represent 52.6% of the active Airbnb listings in Olympic Valley, indicating a high concentration in these sizes.
- A significant 26.8% of listings offer 3+ bedrooms, catering to larger groups and families seeking more space in Olympic Valley.
Olympic Valley Vacation Rental Guest Capacity Trends (2026)
Distribution of Listings by Guest Capacity
Guest Capacity Insights for Olympic Valley
- The most common guest capacity trend in Olympic Valley vacation rentals is listings accommodating 4 guests (39.2%). This suggests the primary traveler segment is likely small families or groups.
- Properties designed for 4 guests and 8+ guests dominate the Olympic Valley STR market, accounting for 68.0% of listings.
- 51.2% of properties accommodate 6+ guests, serving the market segment for larger families or group travel in Olympic Valley.
- On average, properties in Olympic Valley are equipped to host 5.5 guests.
Olympic Valley Airbnb Booking Patterns (2026): Available vs. Booked Days
Available Days Distribution
Booked Days Distribution
Booking Pattern Insights for Olympic Valley
- The most common availability pattern in Olympic Valley falls within the 271-366 days range, representing 55.8% of listings. This suggests many properties have significant open periods on their calendars.
- Approximately 94.3% of listings show high availability (181+ days open annually), indicating potential for increased bookings or specific owner usage patterns.
- For booked days, the 31-90 days range is most frequent in Olympic Valley (41%), reflecting common guest stay durations or potential owner blocking patterns.
- A notable 6.6% of properties secure long booking periods (181+ days booked per year), highlighting successful long-term rental strategies or significant owner usage.
Olympic Valley Airbnb Minimum Stay Requirements Analysis
Distribution of Listings by Minimum Night Requirement
1 Night
54 listings
12.2% of total
2 Nights
96 listings
21.8% of total
3 Nights
17 listings
3.9% of total
4-6 Nights
10 listings
2.3% of total
7-29 Nights
7 listings
1.6% of total
30+ Nights
257 listings
58.3% of total
Key Insights
- The most prevalent minimum stay requirement in Olympic Valley is 30+ Nights, adopted by 58.3% of listings. This highlights the market's preference for longer commitments.
- A significant segment (58.3%) caters to monthly stays (30+ nights) in Olympic Valley, pointing to opportunities in the extended-stay market.
Recommendations
- Align with the market by considering a 30+ Nights minimum stay, as 58.3% of Olympic Valley hosts use this setting.
- If feasible, allowing 1-night stays, especially midweek or during low season, could capture last-minute bookings, as only 12.2% currently do.
- Explore offering discounts for stays of 30+ nights to attract the 58.3% of the market seeking extended stays.
- Adjust minimum nights based on seasonality – potentially shorter during low season and longer during peak demand periods in Olympic Valley.
Olympic Valley Airbnb Cancellation Policy Trends Analysis (2026)
Super Strict 30 Days
29 listings
6.6% of total
Limited
13 listings
2.9% of total
Non-refundable
2 listings
0.5% of total
Refundable
2 listings
0.5% of total
Super Strict 60 Days
6 listings
1.4% of total
Flexible
11 listings
2.5% of total
Moderate
41 listings
9.3% of total
Firm
277 listings
62.8% of total
Strict
60 listings
13.6% of total
Cancellation Policy Insights for Olympic Valley
- The prevailing Airbnb cancellation policy trend in Olympic Valley is Firm, used by 62.8% of listings.
- A majority (76.4%) of hosts in Olympic Valley utilize Firm or Strict policies, indicating a market where hosts prioritize booking security.
Recommendations for Hosts
- Consider adopting a Firm policy to align with the 62.8% market standard in Olympic Valley.
- Using a Strict policy might deter some guests, as only 13.6% of listings use it. Evaluate if potential revenue protection outweighs possible lower booking rates.
- Regularly review your cancellation policy against competitors and market demand shifts in Olympic Valley.
Olympic Valley STR Booking Lead Time Analysis (2026)
Average Booking Lead Time by Month
Booking Lead Time Insights for Olympic Valley
- The overall average booking lead time for vacation rentals in Olympic Valley is 61 days.
- Guests book furthest in advance for stays during January (average 78 days), likely coinciding with peak travel demand or local events.
- The shortest booking windows occur for stays in October (average 43 days), indicating more last-minute travel plans during this time.
- Seasonally, Winter (75 days avg.) sees the longest lead times, while Fall (51 days avg.) has the shortest, reflecting typical travel planning cycles.
Recommendations for Hosts
- Use the overall average lead time (61 days) as a baseline for your pricing and availability strategy in Olympic Valley.
- For January stays, consider implementing length-of-stay discounts or slightly higher rates for bookings made less than 78 days out to capitalize on advance planning.
- Target marketing efforts for the Winter season well in advance (at least 75 days) to capture early planners.
- Monitor your own booking lead times against these Olympic Valley averages to identify opportunities for dynamic pricing adjustments.
Popular & Essential Airbnb Amenities in Olympic Valley (2026)
Amenity Prevalence
Amenity Insights for Olympic Valley
- Essential amenities in Olympic Valley that guests expect include: Wifi, Smoke alarm, TV, Heating, Carbon monoxide alarm. Lacking these (any) could significantly impact bookings.
- Popular amenities like Hot water, Hair dryer, Essentials are common but not universal. Offering these can provide a competitive edge.
Recommendations for Hosts
- Ensure your listing includes all essential amenities for Olympic Valley: Wifi, Smoke alarm, TV, Heating, Carbon monoxide alarm.
- Prioritize adding missing essentials: Wifi, Smoke alarm, TV, Heating, Carbon monoxide alarm.
- Consider adding popular differentiators like Hot water or Hair dryer to increase appeal.
- Highlight unique or less common amenities you offer (e.g., hot tub, dedicated workspace, EV charger) in your listing description and photos.
- Regularly check competitor amenities in Olympic Valley to stay competitive.
Olympic Valley Airbnb Guest Demographics & Profile Analysis (2026)
Guest Profile Summary for Olympic Valley
- The typical guest profile for Airbnb in Olympic Valley consists of primarily domestic travelers (96%), often arriving from nearby San Francisco, typically belonging to the Post-2000s (Gen Z/Alpha) group (50%), primarily speaking English or Spanish.
- Domestic travelers account for 96.4% of guests.
- Key international markets include United States (96.4%) and Canada (0.7%).
- Top languages spoken are English (61.2%) followed by Spanish (14.4%).
- A significant demographic segment is the Post-2000s (Gen Z/Alpha) group, representing 50% of guests.
Recommendations for Hosts
- Target domestic marketing efforts towards travelers from San Francisco and Los Angeles.
- Tailor amenities and listing descriptions to appeal to the dominant Post-2000s (Gen Z/Alpha) demographic (e.g., highlight fast WiFi, smart home features, local guides).
- Highlight unique local experiences or amenities relevant to the primary guest profile.
- Consider seasonal promotions aligned with peak travel times for key origin markets.
Nearby Short-Term Rental Market Comparison
How does the Olympic Valley Airbnb market stack up against its neighbors? Compare key performance metrics like average monthly revenue, ADR, and occupancy rates in surrounding areas to understand the broader regional STR landscape.
| Market | Active Properties | Monthly Revenue | Daily Rate | Avg. Occupancy |
|---|---|---|---|---|
| Zephyr Cove | 192 | $6,404 | $642.42 | 37% |
| Homewood | 150 | $5,842 | $595.57 | 40% |
| Meyers | 177 | $5,840 | $500.97 | 43% |
| Glenbrook | 32 | $5,788 | $841.74 | 35% |
| Carnelian Bay | 349 | $5,362 | $561.69 | 39% |
| Incline Village-Crystal Bay | 204 | $5,197 | $589.54 | 35% |
| Tahoma | 199 | $5,011 | $605.47 | 36% |
| Lake Almanor Country Club | 18 | $4,873 | $556.22 | 44% |
| Tahoe Vista | 233 | $4,606 | $480.30 | 38% |
| Tahoe City | 792 | $4,449 | $539.47 | 36% |