Paicines Airbnb Market Analysis 2026: Short Term Rental Data & Vacation Rental Statistics in California, United States
Is Airbnb profitable in Paicines in 2026? Explore comprehensive Airbnb analytics for Paicines, California, United States to uncover income potential. This 2026 STR market report for Paicines, based on AirROI data from February 2025 to January 2026, reveals key trends in the niche market of 36 active listings.
Whether you're considering an Airbnb investment in Paicines, optimizing your existing vacation rental, or exploring rental arbitrage opportunities, understanding the Paicines Airbnb data is crucial. Leveraging the low regulation environment is key to maximizing your short term rental income potential. Let's dive into the specifics.
Key Paicines Airbnb Performance Metrics Overview
Monthly Airbnb Revenue Variations & Income Potential in Paicines (2026)
Understanding the monthly revenue variations for Airbnb listings in Paicines is key to maximizing your short term rental income potential. Seasonality significantly impacts earnings. Our analysis, based on data from the past 12 months, shows that the peak revenue month for STRs in Paicines is typically July, while February often presents the lowest earnings, highlighting opportunities for strategic pricing adjustments during shoulder and low seasons. Explore the typical Airbnb income in Paicines across different performance tiers:
- Best-in-class properties (Top 10%) achieve $14,207+ monthly, often utilizing dynamic pricing and superior guest experiences.
- Strong performing properties (Top 25%) earn $6,858 or more, indicating effective management and desirable locations/amenities.
- Typical properties (Median) generate around $3,702 per month, representing the average market performance.
- Entry-level properties (Bottom 25%) see earnings around $1,945, often with potential for optimization.
Average Monthly Airbnb Earnings Trend in Paicines
Paicines Airbnb Occupancy Rate Trends (2026)
Maximize your bookings by understanding the Paicines STR occupancy trends. Seasonal demand shifts significantly influence how often properties are booked. Typically, Octobersees the highest demand (peak season occupancy), while January experiences the lowest (low season). Effective strategies, like adjusting minimum stays or offering promotions, can boost occupancy during slower periods. Here's how different property tiers perform in Paicines:
- Best-in-class properties (Top 10%) achieve 79%+ occupancy, indicating high desirability and potentially optimized availability.
- Strong performing properties (Top 25%) maintain 66% or higher occupancy, suggesting good market fit and guest satisfaction.
- Typical properties (Median) have an occupancy rate around 46%.
- Entry-level properties (Bottom 25%) average 23% occupancy, potentially facing higher vacancy.
Average Monthly Occupancy Rate Trend in Paicines
Average Daily Rate (ADR) Airbnb Trends in Paicines (2026)
Effective short term rental pricing strategy in Paicines involves understanding monthly ADR fluctuations. The Average Daily Rate (ADR) for Airbnb in Paicines typically peaks in June and dips lowest during February. Leveraging Airbnb dynamic pricing tools or strategies based on this seasonality can significantly boost revenue. Here's a look at the typical nightly rates achieved:
- Best-in-class properties (Top 10%) command rates of $722+ per night, often due to premium features or locations.
- Strong performing properties (Top 25%) achieve nightly rates of $446 or more.
- Typical properties (Median) charge around $247 per night.
- Entry-level properties (Bottom 25%) earn around $166 per night.
Average Daily Rate (ADR) Trend by Month in Paicines
Get Live Paicines Market Intelligence 👇

Explore Real-time Analytics
Airbnb Seasonality Analysis & Trends in Paicines (2026)
Peak Season (July, October, August)
- Revenue averages $7,769 per month
- Occupancy rates average 52.5%
- Daily rates average $371
Shoulder Season
- Revenue averages $6,518 per month
- Occupancy maintains around 48.8%
- Daily rates hold near $376
Low Season (January, February, June)
- Revenue drops to average $4,423 per month
- Occupancy decreases to average 35.9%
- Daily rates adjust to average $365
Seasonality Insights for Paicines
- The Airbnb seasonality in Paicines shows moderate seasonality with distinct peak and low periods. While the sections above show seasonal averages, it's also insightful to look at the extremes:
- During the high season, the absolute peak month showcases Paicines's highest earning potential, with monthly revenues capable of climbing to $7,794, occupancy reaching a high of 54.1%, and ADRs peaking at $388.
- Conversely, the slowest single month of the year, typically falling within the low season, marks the market's lowest point. In this month, revenue might dip to $3,508, occupancy could drop to 29.3%, and ADRs may adjust down to $342.
- Understanding both the seasonal averages and these monthly peaks and troughs in revenue, occupancy, and ADR is crucial for maximizing your Airbnb profit potential in Paicines.
Seasonal Strategies for Maximizing Profit
- Peak Season: Maximize revenue through premium pricing and potentially longer minimum stays. Ensure high availability.
- Low Season: Offer competitive pricing, special promotions (e.g., extended stay discounts), and flexible cancellation policies. Target off-season travelers like remote workers or budget-conscious guests.
- Shoulder Seasons: Implement dynamic pricing that balances peak and low rates. Target weekend travelers or specific events. Offer slightly more flexible terms than peak season.
- Regularly analyze your own performance against these Paicines seasonality benchmarks and adjust your pricing and availability strategy accordingly.
Best Areas for Airbnb Investment in Paicines (2026)
Exploring the top neighborhoods for short-term rentals in Paicines? This section highlights key areas, outlining why they are attractive for hosts and guests, along with notable local attractions. Consider these locations based on your target guest profile and investment strategy.
| Neighborhood / Area | Why Host Here? (Target Guests & Appeal) | Key Attractions & Landmarks |
|---|---|---|
| Cienega | Cienega is a picturesque community known for its serene natural landscapes and proximity to scenic trails. It's perfect for guests looking for a peaceful retreat in nature, attracting outdoor enthusiasts and families. | Bolado Park, Cienega Creek, nearby hiking trails, wildlife viewing, local farms |
| Lone Pine | Lone Pine offers stunning mountain views and is great for both adventure seekers and those looking for relaxation. The area's natural beauty and outdoor activities make it a desirable location for visitors. | Access to national parks, hiking and biking trails, stargazing opportunities, local dining options, historic landmarks |
| Gavilan Hills | Gavilan Hills is a tranquil area popular for its spacious properties and lovely views. It appeals to guests searching for a quiet getaway, making it an excellent choice for Airbnb hosting. | panoramic views, wildflower meadows, local wineries, peaceful environment, hiking paths |
| San Benito County | The region is burgeoning with wine tours and agricultural landscapes, making it appealing to food and wine lovers. This area attracts tourists interested in exploring California's agriculture and culinary scene. | local wine tours, agricultural experiences, farmers markets, historic downtown Hollister, San Juan Bautista |
| Tres Pinos | Tres Pinos is on the rise as an Airbnb destination due to its charming atmosphere and community events. It's an ideal spot for guests looking for a small town experience with local flair. | local cafes, community events, art galleries, parks, quaint shops |
| Soledad | Soledad offers historical significance and cultural richness, making it a desirable spot for cultural tourism. Guests interested in history will find various attractions in this area. | Mission Soledad, vintage shops, local eateries, historical sites, community festivals |
| King City | King City is gaining popularity thanks to its vibrant culture and diversity. With easy access to nearby attractions and a welcoming community, it's perfect for both short-term and long-term stays. | King City Historical Museum, local festivals, agricultural tours, nearby state parks, community activities |
| Hollister | Hollister has a charming downtown and is close to various outdoor activities. It's a perfect mix of urban and rural, appealing to a wide variety of guests. | historic downtown, local restaurants, farm tours, bike paths, nearby natural reserves |
Understanding Airbnb License Requirements & STR Laws in Paicines (2026)
While Paicines, California, United States currently shows low STR regulations, specific Airbnb license requirements might still exist or change. Always verify the latest short term rental regulations and Airbnb license requirements directly with local government authorities for Paicines to ensure full compliance before hosting.
(Source: AirROI data, 2026, finding no licensed listings among those analyzed)
Top Performing Airbnb Properties in Paicines (2026)
Benchmark your potential! Explore examples of top-performing Airbnb properties in Paicinesbased on Trailing Twelve Month (TTM) revenue. Analyze their characteristics, revenue, occupancy rate, and ADR to understand what drives success in this market.
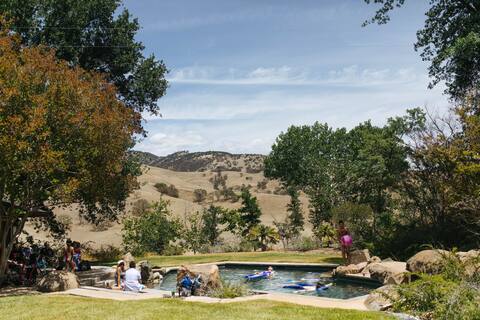
Ranch Luxury with Private Pool near Pinnacles
Entire Place • 6 bedrooms

Two Home Ranch Luxury Retreat near Pinnacles
Entire Place • 9 bedrooms
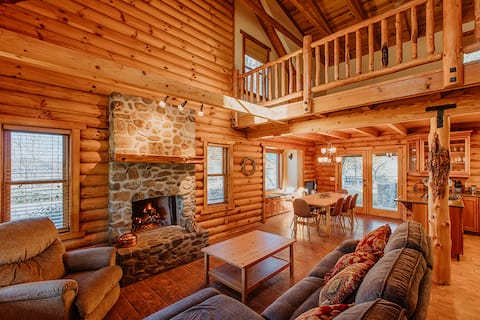
Beautiful Log Cabin near Pinnacles at Bar SZ Ranch
Entire Place • 3 bedrooms
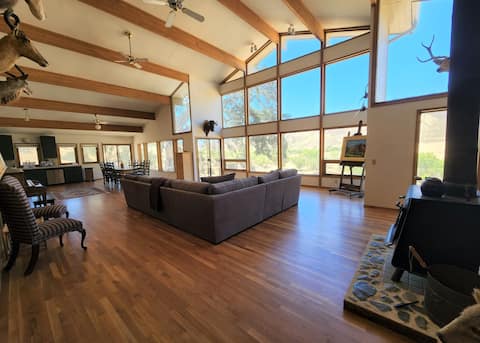
Ranch Stay-3.7 miles from Pinnacles National Park
Entire Place • 3 bedrooms

Lazy Hog Inn -1000 Acres Near Pinnacles Nat'l Park
Entire Place • 4 bedrooms

Quail Cottage for Friends & Families
Entire Place • 4 bedrooms
Note: Performance varies based on location, size, amenities, seasonality, and management quality. Data reflects the past 12 months.
Top Performing Airbnb Hosts in Paicines (2026)
Learn from the best! This table showcases top-performing Airbnb hosts in Paicines based on the number of properties managed and estimated total revenue over the past year. Analyze their scale and performance metrics.
| Host Name | Properties | Grossing Revenue | Stay Reviews | Avg Rating |
|---|---|---|---|---|
| Tim & Michelle | 4 | $759,420 | 150 | 4.96/5.0 |
| Paicines Ranch | 11 | $353,169 | 658 | 4.85/5.0 |
| Barbara Lois | 4 | $238,327 | 182 | 4.96/5.0 |
| Amy | 2 | $115,407 | 71 | 4.75/5.0 |
| David | 1 | $72,219 | 172 | 4.96/5.0 |
| Mitchell Martin | 2 | $71,917 | 146 | 4.96/5.0 |
| Collette | 4 | $66,610 | 301 | 4.83/5.0 |
| Jason | 8 | $20,989 | 52 | 4.31/5.0 |
Analyzing the strategies of top hosts, such as their property selection, pricing, and guest communication, can offer valuable lessons for optimizing your own Airbnb operations in Paicines.
Dive Deeper: Advanced Paicines STR Market Data (2026)
Ready to unlock more insights? AirROI provides access to advanced metrics and comprehensive Airbnb data for Paicines. Explore detailed analytics beyond this report to refine your investment strategy, optimize pricing, and maximize your vacation rental profits.
Explore Advanced MetricsPaicines Short-Term Rental Market Composition (2026): Property & Room Types
Room Type Distribution
Property Type Distribution
Market Composition Insights for Paicines
- The Paicines Airbnb market composition is heavily skewed towards Entire Home/Apt listings, which make up 83.3% of the 36 active rentals. This indicates strong guest preference for privacy and space.
- Looking at the property type distribution in Paicines, Outdoor/Unique properties are the most common (58.3%), reflecting the local real estate landscape.
- Houses represent a significant 19.4% portion, catering likely to families or larger groups.
- The presence of 16.7% Hotel/Boutique listings indicates integration with traditional hospitality.
Paicines Airbnb Room Capacity Analysis (2026): Bedroom Distribution
Distribution of Listings by Number of Bedrooms
Room Capacity Insights for Paicines
- The dominant room capacity in Paicines is 1 bedroom listings, making up 22.2% of the market. This suggests a strong demand for properties suitable for couples or solo travelers.
- Together, 1 bedroom and 2 bedrooms properties represent 44.4% of the active Airbnb listings in Paicines, indicating a high concentration in these sizes.
- A significant 33.4% of listings offer 3+ bedrooms, catering to larger groups and families seeking more space in Paicines.
Paicines Vacation Rental Guest Capacity Trends (2026)
Distribution of Listings by Guest Capacity
Guest Capacity Insights for Paicines
- The most common guest capacity trend in Paicines vacation rentals is listings accommodating 8+ guests (27.8%). This suggests the primary traveler segment is likely larger groups.
- Properties designed for 8+ guests and 2 guests dominate the Paicines STR market, accounting for 55.6% of listings.
- 38.9% of properties accommodate 6+ guests, serving the market segment for larger families or group travel in Paicines.
- On average, properties in Paicines are equipped to host 4.3 guests.
Paicines Airbnb Booking Patterns (2026): Available vs. Booked Days
Available Days Distribution
Booked Days Distribution
Booking Pattern Insights for Paicines
- The most common availability pattern in Paicines falls within the 271-366 days range, representing 50% of listings. This suggests many properties have significant open periods on their calendars.
- Approximately 75.0% of listings show high availability (181+ days open annually), indicating potential for increased bookings or specific owner usage patterns.
- For booked days, the 181-270 days range is most frequent in Paicines (25%), reflecting common guest stay durations or potential owner blocking patterns.
- A notable 25.0% of properties secure long booking periods (181+ days booked per year), highlighting successful long-term rental strategies or significant owner usage.
Paicines Airbnb Minimum Stay Requirements Analysis
Distribution of Listings by Minimum Night Requirement
1 Night
24 listings
66.7% of total
2 Nights
11 listings
30.6% of total
30+ Nights
1 listings
2.8% of total
Key Insights
- The most prevalent minimum stay requirement in Paicines is 1 Night, adopted by 66.7% of listings. This highlights the market's preference for shorter, flexible bookings.
- A strong majority (97.3%) of the Paicines Airbnb data shows acceptance of very short stays (1-2 nights), indicating a dynamic, high-turnover market.
- Dedicated monthly rentals (30+ nights) represent a small niche (2.8%), possibly an untapped area for hosts.
Recommendations
- Align with the market by considering a 1 Night minimum stay, as 66.7% of Paicines hosts use this setting.
- Adjust minimum nights based on seasonality – potentially shorter during low season and longer during peak demand periods in Paicines.
Paicines Airbnb Cancellation Policy Trends Analysis (2026)
Flexible
17 listings
47.2% of total
Moderate
11 listings
30.6% of total
Firm
8 listings
22.2% of total
Cancellation Policy Insights for Paicines
- The prevailing Airbnb cancellation policy trend in Paicines is Flexible, used by 47.2% of listings.
- The market strongly favors guest-friendly terms, with 77.8% of listings offering Flexible or Moderate policies. This suggests guests in Paicines may expect booking flexibility.
Recommendations for Hosts
- Consider adopting a Flexible policy to align with the 47.2% market standard in Paicines.
- Regularly review your cancellation policy against competitors and market demand shifts in Paicines.
Paicines STR Booking Lead Time Analysis (2026)
Average Booking Lead Time by Month
Booking Lead Time Insights for Paicines
- The overall average booking lead time for vacation rentals in Paicines is 42 days.
- Guests book furthest in advance for stays during March (average 77 days), likely coinciding with peak travel demand or local events.
- The shortest booking windows occur for stays in January (average 33 days), indicating more last-minute travel plans during this time.
- Seasonally, Spring (63 days avg.) sees the longest lead times, while Winter (40 days avg.) has the shortest, reflecting typical travel planning cycles.
Recommendations for Hosts
- Use the overall average lead time (42 days) as a baseline for your pricing and availability strategy in Paicines.
- For March stays, consider implementing length-of-stay discounts or slightly higher rates for bookings made less than 77 days out to capitalize on advance planning.
- Target marketing efforts for the Spring season well in advance (at least 63 days) to capture early planners.
- Monitor your own booking lead times against these Paicines averages to identify opportunities for dynamic pricing adjustments.
Popular & Essential Airbnb Amenities in Paicines (2026)
Amenity Prevalence
Amenity Insights for Paicines
- Essential amenities in Paicines that guests expect include: Wifi. Lacking these (this) could significantly impact bookings.
- Popular amenities like Free parking on premises, Heating, Fire extinguisher are common but not universal. Offering these can provide a competitive edge.
Recommendations for Hosts
- Ensure your listing includes all essential amenities for Paicines: Wifi.
- Prioritize adding missing essentials: Wifi.
- Consider adding popular differentiators like Free parking on premises or Heating to increase appeal.
- Highlight unique or less common amenities you offer (e.g., hot tub, dedicated workspace, EV charger) in your listing description and photos.
- Regularly check competitor amenities in Paicines to stay competitive.
Paicines Airbnb Guest Demographics & Profile Analysis (2026)
Guest Profile Summary for Paicines
- The typical guest profile for Airbnb in Paicines consists of primarily domestic travelers (97%), often arriving from nearby San Francisco, typically belonging to the Post-2000s (Gen Z/Alpha) group (50%), primarily speaking English or Spanish.
- Domestic travelers account for 96.9% of guests.
- Key international markets include United States (96.9%) and DC (1%).
- Top languages spoken are English (59.3%) followed by Spanish (13%).
- A significant demographic segment is the Post-2000s (Gen Z/Alpha) group, representing 50% of guests.
Recommendations for Hosts
- Target domestic marketing efforts towards travelers from San Francisco and Los Angeles.
- Tailor amenities and listing descriptions to appeal to the dominant Post-2000s (Gen Z/Alpha) demographic (e.g., highlight fast WiFi, smart home features, local guides).
- Highlight unique local experiences or amenities relevant to the primary guest profile.
- Consider seasonal promotions aligned with peak travel times for key origin markets.
Nearby Short-Term Rental Market Comparison
How does the Paicines Airbnb market stack up against its neighbors? Compare key performance metrics like average monthly revenue, ADR, and occupancy rates in surrounding areas to understand the broader regional STR landscape.
| Market | Active Properties | Monthly Revenue | Daily Rate | Avg. Occupancy |
|---|---|---|---|---|
| Carmel Point | 15 | $14,483 | $1046.17 | 54% |
| Del Monte Forest | 105 | $10,280 | $964.89 | 47% |
| Moss Beach | 34 | $10,092 | $676.91 | 53% |
| Carmel-by-the-Sea | 305 | $8,657 | $680.02 | 49% |
| Pleasure Point | 90 | $7,920 | $525.95 | 52% |
| Carmel | 29 | $7,901 | $597.00 | 49% |
| Castroville | 16 | $7,830 | $558.55 | 50% |
| Stinson Beach | 106 | $7,814 | $812.15 | 43% |
| Sand City | 10 | $7,391 | $497.43 | 60% |
| Del Rey Oaks | 33 | $7,281 | $474.67 | 54% |