Peninsula Village Airbnb Market Analysis 2026: Short Term Rental Data & Vacation Rental Statistics in California, United States
Is Airbnb profitable in Peninsula Village in 2026? Explore comprehensive Airbnb analytics for Peninsula Village, California, United States to uncover income potential. This 2026 STR market report for Peninsula Village, based on AirROI data from February 2025 to January 2026, reveals key trends in the niche market of 51 active listings.
Whether you're considering an Airbnb investment in Peninsula Village, optimizing your existing vacation rental, or exploring rental arbitrage opportunities, understanding the Peninsula Village Airbnb data is crucial. Leveraging the low regulation environment is key to maximizing your short term rental income potential. Let's dive into the specifics.
Key Peninsula Village Airbnb Performance Metrics Overview
Monthly Airbnb Revenue Variations & Income Potential in Peninsula Village (2026)
Understanding the monthly revenue variations for Airbnb listings in Peninsula Village is key to maximizing your short term rental income potential. Seasonality significantly impacts earnings. Our analysis, based on data from the past 12 months, shows that the peak revenue month for STRs in Peninsula Village is typically July, while January often presents the lowest earnings, highlighting opportunities for strategic pricing adjustments during shoulder and low seasons. Explore the typical Airbnb income in Peninsula Village across different performance tiers:
- Best-in-class properties (Top 10%) achieve $8,720+ monthly, often utilizing dynamic pricing and superior guest experiences.
- Strong performing properties (Top 25%) earn $5,029 or more, indicating effective management and desirable locations/amenities.
- Typical properties (Median) generate around $2,710 per month, representing the average market performance.
- Entry-level properties (Bottom 25%) see earnings around $1,386, often with potential for optimization.
Average Monthly Airbnb Earnings Trend in Peninsula Village
Peninsula Village Airbnb Occupancy Rate Trends (2026)
Maximize your bookings by understanding the Peninsula Village STR occupancy trends. Seasonal demand shifts significantly influence how often properties are booked. Typically, Julysees the highest demand (peak season occupancy), while January experiences the lowest (low season). Effective strategies, like adjusting minimum stays or offering promotions, can boost occupancy during slower periods. Here's how different property tiers perform in Peninsula Village:
- Best-in-class properties (Top 10%) achieve 53%+ occupancy, indicating high desirability and potentially optimized availability.
- Strong performing properties (Top 25%) maintain 41% or higher occupancy, suggesting good market fit and guest satisfaction.
- Typical properties (Median) have an occupancy rate around 29%.
- Entry-level properties (Bottom 25%) average 17% occupancy, potentially facing higher vacancy.
Average Monthly Occupancy Rate Trend in Peninsula Village
Average Daily Rate (ADR) Airbnb Trends in Peninsula Village (2026)
Effective short term rental pricing strategy in Peninsula Village involves understanding monthly ADR fluctuations. The Average Daily Rate (ADR) for Airbnb in Peninsula Village typically peaks in June and dips lowest during February. Leveraging Airbnb dynamic pricing tools or strategies based on this seasonality can significantly boost revenue. Here's a look at the typical nightly rates achieved:
- Best-in-class properties (Top 10%) command rates of $632+ per night, often due to premium features or locations.
- Strong performing properties (Top 25%) achieve nightly rates of $424 or more.
- Typical properties (Median) charge around $324 per night.
- Entry-level properties (Bottom 25%) earn around $223 per night.
Average Daily Rate (ADR) Trend by Month in Peninsula Village
Get Live Peninsula Village Market Intelligence 👇

Explore Real-time Analytics
Airbnb Seasonality Analysis & Trends in Peninsula Village (2026)
Peak Season (July, August, June)
- Revenue averages $6,220 per month
- Occupancy rates average 52.2%
- Daily rates average $389
Shoulder Season
- Revenue averages $3,639 per month
- Occupancy maintains around 27.0%
- Daily rates hold near $358
Low Season (January, November, December)
- Revenue drops to average $2,176 per month
- Occupancy decreases to average 16.1%
- Daily rates adjust to average $348
Seasonality Insights for Peninsula Village
- The Airbnb seasonality in Peninsula Village shows highly seasonal trends requiring careful strategy. While the sections above show seasonal averages, it's also insightful to look at the extremes:
- During the high season, the absolute peak month showcases Peninsula Village's highest earning potential, with monthly revenues capable of climbing to $7,458, occupancy reaching a high of 63.1%, and ADRs peaking at $402.
- Conversely, the slowest single month of the year, typically falling within the low season, marks the market's lowest point. In this month, revenue might dip to $1,331, occupancy could drop to 8.7%, and ADRs may adjust down to $320.
- Understanding both the seasonal averages and these monthly peaks and troughs in revenue, occupancy, and ADR is crucial for maximizing your Airbnb profit potential in Peninsula Village.
Seasonal Strategies for Maximizing Profit
- Peak Season: Maximize revenue through premium pricing and potentially longer minimum stays. Ensure high availability.
- Low Season: Offer competitive pricing, special promotions (e.g., extended stay discounts), and flexible cancellation policies. Target off-season travelers like remote workers or budget-conscious guests.
- Shoulder Seasons: Implement dynamic pricing that balances peak and low rates. Target weekend travelers or specific events. Offer slightly more flexible terms than peak season.
- Regularly analyze your own performance against these Peninsula Village seasonality benchmarks and adjust your pricing and availability strategy accordingly.
Best Areas for Airbnb Investment in Peninsula Village (2026)
Exploring the top neighborhoods for short-term rentals in Peninsula Village? This section highlights key areas, outlining why they are attractive for hosts and guests, along with notable local attractions. Consider these locations based on your target guest profile and investment strategy.
| Neighborhood / Area | Why Host Here? (Target Guests & Appeal) | Key Attractions & Landmarks |
|---|---|---|
| Pillar Point Harbor | A scenic coastal area known for its beautiful harbor views and maritime activities. Ideal for guests seeking outdoor adventures such as kayaking and fishing, as well as fresh seafood dining options. | Pillar Point Harbor, Harbor Seal Viewing, Kayaking and Paddleboarding, Half Moon Bay Brewing Company, Miramar Beach |
| Half Moon Bay Main Street | The charming downtown district with a blend of historic buildings and contemporary shops. Popular for its local restaurants and cafes, making it a cozy spot for travelers exploring the Half Moon Bay area. | Half Moon Bay State Beach, Main Street shops and cafes, Half Moon Bay History Association, Mavericks Beach, Pigeon Point Lighthouse |
| Pescadero | Quaint coastal town known for its stunning natural beauty and proximity to Año Nuevo State Park. A great retreat for nature lovers and those seeking tranquility away from city life. | Año Nuevo State Park, Pigeon Point Light Station Historic Site, Pescadero Marsh Natural Preserve, Pescadero Beach |
| El Granada | A picturesque village by the coast that offers stunning views of the ocean and mountains. Perfect for guests looking for a peaceful stay with outdoor activities such as hiking and beach access. | El Granada Beach, Mavericks Beach, Pigeon Point Lighthouse, Mirada Surf Beach, Half Moon Bay Coastal Trail |
| San Gregorio | A quiet rural community located near the coast, known for its beautiful landscapes and proximity to both the ocean and redwood forests. Attracts guests interested in nature and serenity. | San Gregorio State Beach, La Honda Creek Open Space Preserve, The San Gregorio General Store |
| Moss Beach | Home to stunning coastal views and the famous Fitzgerald Marine Reserve, a prime spot for guests interested in tide pooling and marine wildlife. | Fitzgerald Marine Reserve, Moss Beach Distillery, Moss Beach Park |
| Pacifica | Located just south of San Francisco, Pacifica offers beach access and hiking trails. It’s perfect for those who want a coastal escape with easy access to the city. | Pacifica State Beach, Devil's Slide Trail, Mori Point, Sweeney Ridge |
| Daly City | A diverse suburban area close to San Francisco, ideal for guests seeking affordable accommodations with quick access to the city’s attractions and amenities. | Cow Palace, Golden Gate National Park, Mori Point, Pacifica State Beach |
Understanding Airbnb License Requirements & STR Laws in Peninsula Village (2026)
While Peninsula Village, California, United States currently shows low STR regulations, specific Airbnb license requirements might still exist or change. Always verify the latest short term rental regulations and Airbnb license requirements directly with local government authorities for Peninsula Village to ensure full compliance before hosting.
(Source: AirROI data, 2026, finding no licensed listings among those analyzed)
Top Performing Airbnb Properties in Peninsula Village (2026)
Benchmark your potential! Explore examples of top-performing Airbnb properties in Peninsula Villagebased on Trailing Twelve Month (TTM) revenue. Analyze their characteristics, revenue, occupancy rate, and ADR to understand what drives success in this market.

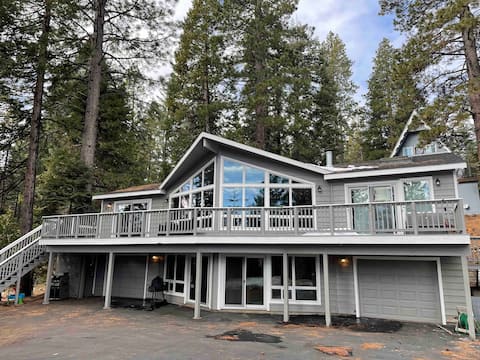
Unforgettable Lakefront 5+Bedroom in Lake Almanor
Entire Place • 5 bedrooms

R&R Casa de Lago
Entire Place • 4 bedrooms

Lake Views at Lake Almanor 11: Lakeside Resort
Entire Place • 4 bedrooms
Lake retreat for multiple families w/ game room!
Entire Place • 5 bedrooms

Westwood Lakefront Cabin w/ Hot Tub & Boat Dock!
Entire Place • 4 bedrooms

Spacious Home at Bailey Creek Golf Course
Entire Place • 5 bedrooms
Note: Performance varies based on location, size, amenities, seasonality, and management quality. Data reflects the past 12 months.
Top Performing Airbnb Hosts in Peninsula Village (2026)
Learn from the best! This table showcases top-performing Airbnb hosts in Peninsula Village based on the number of properties managed and estimated total revenue over the past year. Analyze their scale and performance metrics.
| Host Name | Properties | Grossing Revenue | Stay Reviews | Avg Rating |
|---|---|---|---|---|
| Evolve | 8 | $285,047 | 42 | 4.47/5.0 |
| Jacob | 6 | $213,616 | 53 | 4.65/5.0 |
| Chase International | 2 | $144,088 | 23 | 4.63/5.0 |
| Jacqueline | 1 | $135,416 | 10 | 4.50/5.0 |
| Sara | 1 | $84,711 | 44 | 4.98/5.0 |
| Kate | 7 | $82,444 | 20 | 4.67/5.0 |
| Amy | 1 | $66,604 | 5 | 4.80/5.0 |
| Jon & Lisa | 2 | $62,739 | 387 | 4.94/5.0 |
| Laurissa And Larry | 1 | $50,560 | 84 | 4.93/5.0 |
| Thomas | 1 | $47,157 | 12 | 5.00/5.0 |
Analyzing the strategies of top hosts, such as their property selection, pricing, and guest communication, can offer valuable lessons for optimizing your own Airbnb operations in Peninsula Village.
Dive Deeper: Advanced Peninsula Village STR Market Data (2026)
Ready to unlock more insights? AirROI provides access to advanced metrics and comprehensive Airbnb data for Peninsula Village. Explore detailed analytics beyond this report to refine your investment strategy, optimize pricing, and maximize your vacation rental profits.
Explore Advanced MetricsPeninsula Village Short-Term Rental Market Composition (2026): Property & Room Types
Room Type Distribution
Property Type Distribution
Market Composition Insights for Peninsula Village
- The Peninsula Village Airbnb market composition is heavily skewed towards Entire Home/Apt listings, which make up 100% of the 51 active rentals. This indicates strong guest preference for privacy and space.
- Looking at the property type distribution in Peninsula Village, Outdoor/Unique properties are the most common (54.9%), reflecting the local real estate landscape.
- Houses represent a significant 43.1% portion, catering likely to families or larger groups.
- Smaller segments like hotel/boutique (combined 2.0%) offer potential for unique stay experiences.
Peninsula Village Airbnb Room Capacity Analysis (2026): Bedroom Distribution
Distribution of Listings by Number of Bedrooms
Room Capacity Insights for Peninsula Village
- The dominant room capacity in Peninsula Village is 2 bedrooms listings, making up 23.5% of the market. This suggests a strong demand for properties suitable for couples or solo travelers.
- Together, 2 bedrooms and 3 bedrooms properties represent 47.0% of the active Airbnb listings in Peninsula Village, indicating a high concentration in these sizes.
- A significant 54.9% of listings offer 3+ bedrooms, catering to larger groups and families seeking more space in Peninsula Village.
Peninsula Village Vacation Rental Guest Capacity Trends (2026)
Distribution of Listings by Guest Capacity
Guest Capacity Insights for Peninsula Village
- The most common guest capacity trend in Peninsula Village vacation rentals is listings accommodating 8+ guests (49%). This suggests the primary traveler segment is likely larger groups.
- Properties designed for 8+ guests and 4 guests dominate the Peninsula Village STR market, accounting for 68.6% of listings.
- 72.5% of properties accommodate 6+ guests, serving the market segment for larger families or group travel in Peninsula Village.
- On average, properties in Peninsula Village are equipped to host 6.4 guests.
Peninsula Village Airbnb Booking Patterns (2026): Available vs. Booked Days
Available Days Distribution
Booked Days Distribution
Booking Pattern Insights for Peninsula Village
- The most common availability pattern in Peninsula Village falls within the 271-366 days range, representing 54.9% of listings. This suggests many properties have significant open periods on their calendars.
- Approximately 98.0% of listings show high availability (181+ days open annually), indicating potential for increased bookings or specific owner usage patterns.
- For booked days, the 91-180 days range is most frequent in Peninsula Village (43.1%), reflecting common guest stay durations or potential owner blocking patterns.
- A notable 2.0% of properties secure long booking periods (181+ days booked per year), highlighting successful long-term rental strategies or significant owner usage.
Peninsula Village Airbnb Minimum Stay Requirements Analysis
Distribution of Listings by Minimum Night Requirement
1 Night
2 listings
3.9% of total
2 Nights
19 listings
37.3% of total
3 Nights
11 listings
21.6% of total
4-6 Nights
4 listings
7.8% of total
30+ Nights
15 listings
29.4% of total
Key Insights
- The most prevalent minimum stay requirement in Peninsula Village is 2 Nights, adopted by 37.3% of listings. This highlights the market's preference for shorter, flexible bookings.
- A significant segment (29.4%) caters to monthly stays (30+ nights) in Peninsula Village, pointing to opportunities in the extended-stay market.
Recommendations
- Align with the market by considering a 2 Nights minimum stay, as 37.3% of Peninsula Village hosts use this setting.
- If feasible, allowing 1-night stays, especially midweek or during low season, could capture last-minute bookings, as only 3.9% currently do.
- A 2-night minimum appears standard (37.3%). Consider this for weekends or peak periods.
- Explore offering discounts for stays of 30+ nights to attract the 29.4% of the market seeking extended stays.
- Adjust minimum nights based on seasonality – potentially shorter during low season and longer during peak demand periods in Peninsula Village.
Peninsula Village Airbnb Cancellation Policy Trends Analysis (2026)
Super Strict 30 Days
6 listings
11.8% of total
Flexible
2 listings
3.9% of total
Moderate
6 listings
11.8% of total
Firm
25 listings
49% of total
Strict
12 listings
23.5% of total
Cancellation Policy Insights for Peninsula Village
- The prevailing Airbnb cancellation policy trend in Peninsula Village is Firm, used by 49% of listings.
- A majority (72.5%) of hosts in Peninsula Village utilize Firm or Strict policies, indicating a market where hosts prioritize booking security.
Recommendations for Hosts
- Consider adopting a Firm policy to align with the 49% market standard in Peninsula Village.
- Regularly review your cancellation policy against competitors and market demand shifts in Peninsula Village.
Peninsula Village STR Booking Lead Time Analysis (2026)
Average Booking Lead Time by Month
Booking Lead Time Insights for Peninsula Village
- The overall average booking lead time for vacation rentals in Peninsula Village is 72 days.
- Guests book furthest in advance for stays during July (average 123 days), likely coinciding with peak travel demand or local events.
- The shortest booking windows occur for stays in February (average 14 days), indicating more last-minute travel plans during this time.
- Seasonally, Summer (101 days avg.) sees the longest lead times, while Winter (36 days avg.) has the shortest, reflecting typical travel planning cycles.
Recommendations for Hosts
- Use the overall average lead time (72 days) as a baseline for your pricing and availability strategy in Peninsula Village.
- For July stays, consider implementing length-of-stay discounts or slightly higher rates for bookings made less than 123 days out to capitalize on advance planning.
- During February, focus on last-minute booking availability and promotions, as guests book with very short notice (14 days avg.).
- Target marketing efforts for the Summer season well in advance (at least 101 days) to capture early planners.
- Monitor your own booking lead times against these Peninsula Village averages to identify opportunities for dynamic pricing adjustments.
Popular & Essential Airbnb Amenities in Peninsula Village (2026)
Amenity Prevalence
Amenity Insights for Peninsula Village
- Essential amenities in Peninsula Village that guests expect include: Free parking on premises, Smoke alarm, Wifi, Kitchen. Lacking these (any) could significantly impact bookings.
- Popular amenities like BBQ grill, Carbon monoxide alarm, TV are common but not universal. Offering these can provide a competitive edge.
Recommendations for Hosts
- Ensure your listing includes all essential amenities for Peninsula Village: Free parking on premises, Smoke alarm, Wifi, Kitchen.
- Prioritize adding missing essentials: Free parking on premises, Smoke alarm, Wifi, Kitchen.
- Consider adding popular differentiators like BBQ grill or Carbon monoxide alarm to increase appeal.
- Highlight unique or less common amenities you offer (e.g., hot tub, dedicated workspace, EV charger) in your listing description and photos.
- Regularly check competitor amenities in Peninsula Village to stay competitive.
Peninsula Village Airbnb Guest Demographics & Profile Analysis (2026)
Guest Profile Summary for Peninsula Village
- The typical guest profile for Airbnb in Peninsula Village consists of primarily domestic travelers (100%), often arriving from nearby Reno, typically belonging to the Post-2000s (Gen Z/Alpha) group (50%), primarily speaking English or Spanish.
- Domestic travelers account for 100.0% of guests.
- Top languages spoken are English (74.5%) followed by Spanish (13.7%).
- A significant demographic segment is the Post-2000s (Gen Z/Alpha) group, representing 50% of guests.
Recommendations for Hosts
- Target domestic marketing efforts towards travelers from Reno and Chico.
- Tailor amenities and listing descriptions to appeal to the dominant Post-2000s (Gen Z/Alpha) demographic (e.g., highlight fast WiFi, smart home features, local guides).
- Highlight unique local experiences or amenities relevant to the primary guest profile.
- Consider seasonal promotions aligned with peak travel times for key origin markets.
Nearby Short-Term Rental Market Comparison
How does the Peninsula Village Airbnb market stack up against its neighbors? Compare key performance metrics like average monthly revenue, ADR, and occupancy rates in surrounding areas to understand the broader regional STR landscape.
| Market | Active Properties | Monthly Revenue | Daily Rate | Avg. Occupancy |
|---|---|---|---|---|
| Homewood | 150 | $5,842 | $595.57 | 40% |
| Carnelian Bay | 349 | $5,362 | $561.69 | 39% |
| Tahoma | 199 | $5,011 | $605.47 | 36% |
| Lake Almanor Country Club | 18 | $4,873 | $556.22 | 44% |
| Tahoe Vista | 233 | $4,606 | $480.30 | 38% |
| Shasta Lake | 23 | $4,482 | $423.63 | 47% |
| Tahoe City | 792 | $4,449 | $539.47 | 36% |
| Kings Beach | 451 | $4,427 | $470.97 | 38% |
| Truckee | 1,576 | $4,243 | $574.96 | 33% |
| Olympic Valley | 441 | $4,232 | $548.11 | 34% |