Penngrove Airbnb Market Analysis 2026: Short Term Rental Data & Vacation Rental Statistics in California, United States
Is Airbnb profitable in Penngrove in 2026? Explore comprehensive Airbnb analytics for Penngrove, California, United States to uncover income potential. This 2026 STR market report for Penngrove, based on AirROI data from February 2025 to January 2026, reveals key trends in the niche market of 19 active listings.
Whether you're considering an Airbnb investment in Penngrove, optimizing your existing vacation rental, or exploring rental arbitrage opportunities, understanding the Penngrove Airbnb data is crucial. Leveraging the low regulation environment is key to maximizing your short term rental income potential. Let's dive into the specifics.
Key Penngrove Airbnb Performance Metrics Overview
Monthly Airbnb Revenue Variations & Income Potential in Penngrove (2026)
Understanding the monthly revenue variations for Airbnb listings in Penngrove is key to maximizing your short term rental income potential. Seasonality significantly impacts earnings. Our analysis, based on data from the past 12 months, shows that the peak revenue month for STRs in Penngrove is typically November, while December often presents the lowest earnings, highlighting opportunities for strategic pricing adjustments during shoulder and low seasons. Explore the typical Airbnb income in Penngrove across different performance tiers:
- Best-in-class properties (Top 10%) achieve $10,460+ monthly, often utilizing dynamic pricing and superior guest experiences.
- Strong performing properties (Top 25%) earn $5,863 or more, indicating effective management and desirable locations/amenities.
- Typical properties (Median) generate around $3,469 per month, representing the average market performance.
- Entry-level properties (Bottom 25%) see earnings around $2,201, often with potential for optimization.
Average Monthly Airbnb Earnings Trend in Penngrove
Penngrove Airbnb Occupancy Rate Trends (2026)
Maximize your bookings by understanding the Penngrove STR occupancy trends. Seasonal demand shifts significantly influence how often properties are booked. Typically, Novembersees the highest demand (peak season occupancy), while December experiences the lowest (low season). Effective strategies, like adjusting minimum stays or offering promotions, can boost occupancy during slower periods. Here's how different property tiers perform in Penngrove:
- Best-in-class properties (Top 10%) achieve 78%+ occupancy, indicating high desirability and potentially optimized availability.
- Strong performing properties (Top 25%) maintain 63% or higher occupancy, suggesting good market fit and guest satisfaction.
- Typical properties (Median) have an occupancy rate around 45%.
- Entry-level properties (Bottom 25%) average 28% occupancy, potentially facing higher vacancy.
Average Monthly Occupancy Rate Trend in Penngrove
Average Daily Rate (ADR) Airbnb Trends in Penngrove (2026)
Effective short term rental pricing strategy in Penngrove involves understanding monthly ADR fluctuations. The Average Daily Rate (ADR) for Airbnb in Penngrove typically peaks in May and dips lowest during January. Leveraging Airbnb dynamic pricing tools or strategies based on this seasonality can significantly boost revenue. Here's a look at the typical nightly rates achieved:
- Best-in-class properties (Top 10%) command rates of $751+ per night, often due to premium features or locations.
- Strong performing properties (Top 25%) achieve nightly rates of $486 or more.
- Typical properties (Median) charge around $225 per night.
- Entry-level properties (Bottom 25%) earn around $148 per night.
Average Daily Rate (ADR) Trend by Month in Penngrove
Get Live Penngrove Market Intelligence 👇

Explore Real-time Analytics
Airbnb Seasonality Analysis & Trends in Penngrove (2026)
Peak Season (November, July, May)
- Revenue averages $5,672 per month
- Occupancy rates average 53.9%
- Daily rates average $428
Shoulder Season
- Revenue averages $4,587 per month
- Occupancy maintains around 46.2%
- Daily rates hold near $421
Low Season (February, September, December)
- Revenue drops to average $3,104 per month
- Occupancy decreases to average 39.4%
- Daily rates adjust to average $417
Seasonality Insights for Penngrove
- The Airbnb seasonality in Penngrove shows moderate seasonality with distinct peak and low periods. While the sections above show seasonal averages, it's also insightful to look at the extremes:
- During the high season, the absolute peak month showcases Penngrove's highest earning potential, with monthly revenues capable of climbing to $6,092, occupancy reaching a high of 61.3%, and ADRs peaking at $435.
- Conversely, the slowest single month of the year, typically falling within the low season, marks the market's lowest point. In this month, revenue might dip to $2,953, occupancy could drop to 32.8%, and ADRs may adjust down to $406.
- Understanding both the seasonal averages and these monthly peaks and troughs in revenue, occupancy, and ADR is crucial for maximizing your Airbnb profit potential in Penngrove.
Seasonal Strategies for Maximizing Profit
- Peak Season: Maximize revenue through premium pricing and potentially longer minimum stays. Ensure high availability.
- Low Season: Offer competitive pricing, special promotions (e.g., extended stay discounts), and flexible cancellation policies. Target off-season travelers like remote workers or budget-conscious guests.
- Shoulder Seasons: Implement dynamic pricing that balances peak and low rates. Target weekend travelers or specific events. Offer slightly more flexible terms than peak season.
- Regularly analyze your own performance against these Penngrove seasonality benchmarks and adjust your pricing and availability strategy accordingly.
Best Areas for Airbnb Investment in Penngrove (2026)
Exploring the top neighborhoods for short-term rentals in Penngrove? This section highlights key areas, outlining why they are attractive for hosts and guests, along with notable local attractions. Consider these locations based on your target guest profile and investment strategy.
| Neighborhood / Area | Why Host Here? (Target Guests & Appeal) | Key Attractions & Landmarks |
|---|---|---|
| Downtown Penngrove | Centrally located with easy access to local amenities, dining, and events. Ideal for travelers seeking a quaint small-town experience while being close to larger cities. | Penngrove Park, Local restaurants and cafes, Small town events, Proximity to Petaluma, Wine country tours |
| Penngrove Historical District | Rich in history with charming vintage homes and a unique atmosphere. Perfect for guests interested in local history and culture, with easy access to scenic walks and community events. | Historical homes and architecture, Local community events, Scenic walking trails, Proximity to Petaluma, Art studios |
| Nearby Sonoma County | Famous for its wineries and beautiful landscapes. Attracts visitors looking for wine tours, culinary experiences, and outdoor activities in a picturesque setting. | Sonoma County wineries, Bodega Bay, Sonoma Coast State Park, Outdoor hiking and biking trails, Wine tasting experiences |
| Point Reyes National Seashore | A stunning natural area with scenic views and wildlife. Great for outdoor enthusiasts and nature lovers, offering a variety of recreational activities. | Point Reyes Lighthouse, Hiking trails, Wildlife viewing, Scenic coastal areas, Beach access |
| Petaluma | A charming nearby city known for its historic downtown and vibrant arts scene. Great for guests who want to explore local shopping, dining, and culture. | Petaluma Historic Downtown, Local breweries and restaurants, Petaluma River, Arts and crafts events, Shopping boutiques |
| Wine Country | A short drive away, this area is renowned for its vineyards and scenic beauty, perfect for romantic getaways and luxury stays. | Napa Valley wineries, Sonoma Valley wineries, Gourmet dining options, Scenic drives, Hot air balloon rides |
| Lagoons and Parks | Surrounding natural areas with lagoons and parks are perfect for outdoor activities such as hiking and birdwatching, attracting visitors interested in nature. | Laguna de Santa Rosa, Local parks, Birdwatching, Nature trails, Picnic areas |
| Craft Brewery District | A growing area for craft breweries and microbreweries, attracting foodies and beer enthusiasts looking for unique local flavors. | Local breweries, Craft beer tastings, Food trucks and restaurant collaborations, Beer festivals, Community events |
Understanding Airbnb License Requirements & STR Laws in Penngrove (2026)
While Penngrove, California, United States currently shows low STR regulations, specific Airbnb license requirements might still exist or change. Always verify the latest short term rental regulations and Airbnb license requirements directly with local government authorities for Penngrove to ensure full compliance before hosting.
(Source: AirROI data, 2026, based on 5% licensed listings)
Top Performing Airbnb Properties in Penngrove (2026)
Benchmark your potential! Explore examples of top-performing Airbnb properties in Penngrovebased on Trailing Twelve Month (TTM) revenue. Analyze their characteristics, revenue, occupancy rate, and ADR to understand what drives success in this market.

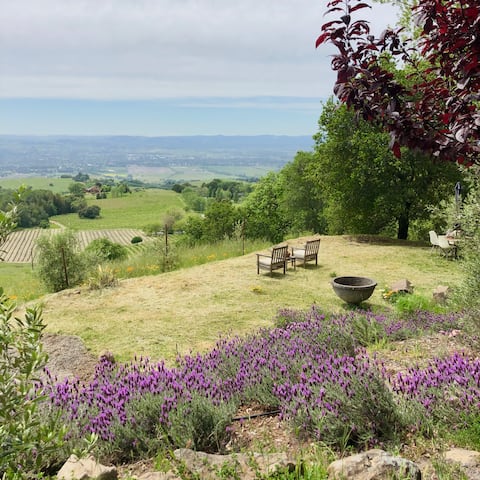
Charming Penngrove Compound
Entire Place • 5 bedrooms

Charming Home in Penngrove
Entire Place • 3 bedrooms
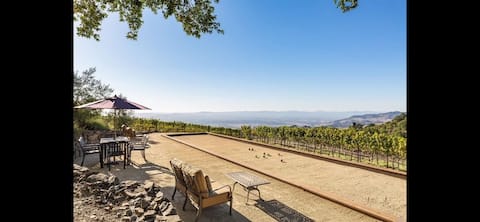
Sonoma Mountain Incredible Views Artist's Retreat
Entire Place • 2 bedrooms
Private Vineyard | Views | A-Frame on 5 acres
Entire Place • 3 bedrooms

Willow Farm Cabin & Farm Retreat
Entire Place • 3 bedrooms

Valley View-Sonoma Mountain Terrace
Entire Place • 1 bedroom
Note: Performance varies based on location, size, amenities, seasonality, and management quality. Data reflects the past 12 months.
Top Performing Airbnb Hosts in Penngrove (2026)
Learn from the best! This table showcases top-performing Airbnb hosts in Penngrove based on the number of properties managed and estimated total revenue over the past year. Analyze their scale and performance metrics.
| Host Name | Properties | Grossing Revenue | Stay Reviews | Avg Rating |
|---|---|---|---|---|
| Frank | 2 | $203,383 | 205 | 4.91/5.0 |
| Lynn | 3 | $134,946 | 1247 | 4.97/5.0 |
| Michelle | 1 | $74,783 | 474 | 4.97/5.0 |
| Brett | 1 | $72,360 | 5 | 5.00/5.0 |
| Namita | 1 | $55,236 | 136 | 5.00/5.0 |
| Kristi | 1 | $46,488 | 8 | 3.75/5.0 |
| Aaron Patrick | 1 | $36,109 | 19 | 5.00/5.0 |
| Michael And Susan | 1 | $34,306 | 53 | 4.98/5.0 |
| David | 1 | $30,638 | 123 | 4.98/5.0 |
| Carrie | 1 | $29,268 | 50 | 5.00/5.0 |
Analyzing the strategies of top hosts, such as their property selection, pricing, and guest communication, can offer valuable lessons for optimizing your own Airbnb operations in Penngrove.
Dive Deeper: Advanced Penngrove STR Market Data (2026)
Ready to unlock more insights? AirROI provides access to advanced metrics and comprehensive Airbnb data for Penngrove. Explore detailed analytics beyond this report to refine your investment strategy, optimize pricing, and maximize your vacation rental profits.
Explore Advanced MetricsPenngrove Short-Term Rental Market Composition (2026): Property & Room Types
Room Type Distribution
Property Type Distribution
Market Composition Insights for Penngrove
- The Penngrove Airbnb market composition is heavily skewed towards Entire Home/Apt listings, which make up 84.2% of the 19 active rentals. This indicates strong guest preference for privacy and space.
- Looking at the property type distribution in Penngrove, House properties are the most common (63.2%), reflecting the local real estate landscape.
- Houses represent a significant 63.2% portion, catering likely to families or larger groups.
- The presence of 10.5% Hotel/Boutique listings indicates integration with traditional hospitality.
Penngrove Airbnb Room Capacity Analysis (2026): Bedroom Distribution
Distribution of Listings by Number of Bedrooms
Room Capacity Insights for Penngrove
- The dominant room capacity in Penngrove is 1 bedroom listings, making up 31.6% of the market. This suggests a strong demand for properties suitable for couples or solo travelers.
- Together, 1 bedroom and 3 bedrooms properties represent 57.9% of the active Airbnb listings in Penngrove, indicating a high concentration in these sizes.
- A significant 36.9% of listings offer 3+ bedrooms, catering to larger groups and families seeking more space in Penngrove.
Penngrove Vacation Rental Guest Capacity Trends (2026)
Distribution of Listings by Guest Capacity
Guest Capacity Insights for Penngrove
- The most common guest capacity trend in Penngrove vacation rentals is listings accommodating 2 guests (31.6%). This suggests the primary traveler segment is likely couples or solo travelers.
- Properties designed for 2 guests and 6 guests dominate the Penngrove STR market, accounting for 52.7% of listings.
- 42.2% of properties accommodate 6+ guests, serving the market segment for larger families or group travel in Penngrove.
- On average, properties in Penngrove are equipped to host 3.9 guests.
Penngrove Airbnb Booking Patterns (2026): Available vs. Booked Days
Available Days Distribution
Booked Days Distribution
Booking Pattern Insights for Penngrove
- The most common availability pattern in Penngrove falls within the 271-366 days range, representing 42.1% of listings. This suggests many properties have significant open periods on their calendars.
- Approximately 73.7% of listings show high availability (181+ days open annually), indicating potential for increased bookings or specific owner usage patterns.
- For booked days, the 91-180 days range is most frequent in Penngrove (31.6%), reflecting common guest stay durations or potential owner blocking patterns.
- A notable 26.4% of properties secure long booking periods (181+ days booked per year), highlighting successful long-term rental strategies or significant owner usage.
Penngrove Airbnb Minimum Stay Requirements Analysis
Distribution of Listings by Minimum Night Requirement
1 Night
5 listings
26.3% of total
2 Nights
5 listings
26.3% of total
3 Nights
1 listings
5.3% of total
4-6 Nights
1 listings
5.3% of total
7-29 Nights
1 listings
5.3% of total
30+ Nights
6 listings
31.6% of total
Key Insights
- The most prevalent minimum stay requirement in Penngrove is 30+ Nights, adopted by 31.6% of listings. This highlights the market's preference for longer commitments.
- A significant segment (31.6%) caters to monthly stays (30+ nights) in Penngrove, pointing to opportunities in the extended-stay market.
Recommendations
- Align with the market by considering a 30+ Nights minimum stay, as 31.6% of Penngrove hosts use this setting.
- If feasible, allowing 1-night stays, especially midweek or during low season, could capture last-minute bookings, as only 26.3% currently do.
- Explore offering discounts for stays of 30+ nights to attract the 31.6% of the market seeking extended stays.
- Adjust minimum nights based on seasonality – potentially shorter during low season and longer during peak demand periods in Penngrove.
Penngrove Airbnb Cancellation Policy Trends Analysis (2026)
Limited
2 listings
10.5% of total
Super Strict 30 Days
1 listings
5.3% of total
Flexible
4 listings
21.1% of total
Moderate
6 listings
31.6% of total
Firm
5 listings
26.3% of total
Strict
1 listings
5.3% of total
Cancellation Policy Insights for Penngrove
- The prevailing Airbnb cancellation policy trend in Penngrove is Moderate, used by 31.6% of listings.
- There's a relatively balanced mix between guest-friendly (52.7%) and stricter (31.6%) policies, offering choices for different guest needs.
- Strict cancellation policies are quite rare (5.3%), potentially making listings with this policy less competitive unless justified by high demand or property type.
Recommendations for Hosts
- Consider adopting a Moderate policy to align with the 31.6% market standard in Penngrove.
- Using a Strict policy might deter some guests, as only 5.3% of listings use it. Evaluate if potential revenue protection outweighs possible lower booking rates.
- Regularly review your cancellation policy against competitors and market demand shifts in Penngrove.
Penngrove STR Booking Lead Time Analysis (2026)
Average Booking Lead Time by Month
Booking Lead Time Insights for Penngrove
- The overall average booking lead time for vacation rentals in Penngrove is 47 days.
- Guests book furthest in advance for stays during October (average 88 days), likely coinciding with peak travel demand or local events.
- The shortest booking windows occur for stays in January (average 21 days), indicating more last-minute travel plans during this time.
- Seasonally, Fall (73 days avg.) sees the longest lead times, while Winter (31 days avg.) has the shortest, reflecting typical travel planning cycles.
Recommendations for Hosts
- Use the overall average lead time (47 days) as a baseline for your pricing and availability strategy in Penngrove.
- For October stays, consider implementing length-of-stay discounts or slightly higher rates for bookings made less than 88 days out to capitalize on advance planning.
- Target marketing efforts for the Fall season well in advance (at least 73 days) to capture early planners.
- Monitor your own booking lead times against these Penngrove averages to identify opportunities for dynamic pricing adjustments.
Popular & Essential Airbnb Amenities in Penngrove (2026)
Amenity Prevalence
Amenity Insights for Penngrove
- Essential amenities in Penngrove that guests expect include: Smoke alarm, First aid kit, Free parking on premises, Wifi. Lacking these (any) could significantly impact bookings.
- Popular amenities like Carbon monoxide alarm, Kitchen, Heating are common but not universal. Offering these can provide a competitive edge.
Recommendations for Hosts
- Ensure your listing includes all essential amenities for Penngrove: Smoke alarm, First aid kit, Free parking on premises, Wifi.
- Consider adding popular differentiators like Carbon monoxide alarm or Kitchen to increase appeal.
- Highlight unique or less common amenities you offer (e.g., hot tub, dedicated workspace, EV charger) in your listing description and photos.
- Regularly check competitor amenities in Penngrove to stay competitive.
Penngrove Airbnb Guest Demographics & Profile Analysis (2026)
Guest Profile Summary for Penngrove
- The typical guest profile for Airbnb in Penngrove consists of primarily domestic travelers (96%), often arriving from nearby San Francisco, typically belonging to the Post-2000s (Gen Z/Alpha) group (50%), primarily speaking English or Spanish.
- Domestic travelers account for 96.2% of guests.
- Key international markets include United States (96.2%) and United Kingdom (0.6%).
- Top languages spoken are English (61.4%) followed by Spanish (16.3%).
- A significant demographic segment is the Post-2000s (Gen Z/Alpha) group, representing 50% of guests.
Recommendations for Hosts
- Target domestic marketing efforts towards travelers from San Francisco and New York.
- Tailor amenities and listing descriptions to appeal to the dominant Post-2000s (Gen Z/Alpha) demographic (e.g., highlight fast WiFi, smart home features, local guides).
- Highlight unique local experiences or amenities relevant to the primary guest profile.
- Consider seasonal promotions aligned with peak travel times for key origin markets.
Nearby Short-Term Rental Market Comparison
How does the Penngrove Airbnb market stack up against its neighbors? Compare key performance metrics like average monthly revenue, ADR, and occupancy rates in surrounding areas to understand the broader regional STR landscape.
| Market | Active Properties | Monthly Revenue | Daily Rate | Avg. Occupancy |
|---|---|---|---|---|
| Moss Beach | 34 | $10,092 | $676.91 | 53% |
| Sonoma | 228 | $9,647 | $819.87 | 43% |
| Marshall | 18 | $8,897 | $607.75 | 50% |
| St. Helena | 50 | $8,684 | $924.70 | 38% |
| Kenwood | 60 | $8,643 | $810.83 | 41% |
| Glen Ellen | 85 | $8,482 | $799.53 | 43% |
| Eldridge | 21 | $8,410 | $930.61 | 41% |
| Dillon Beach | 82 | $8,062 | $703.26 | 41% |
| Stinson Beach | 106 | $7,814 | $812.15 | 43% |
| Healdsburg | 195 | $7,538 | $744.46 | 41% |