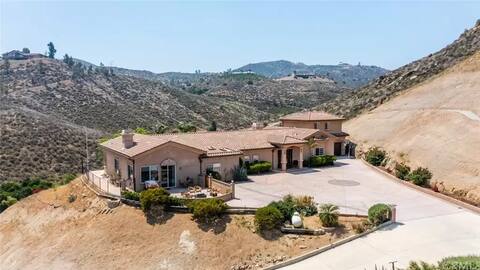
Perris Airbnb Market Analysis 2026: Short Term Rental Data & Vacation Rental Statistics in California, United States
Is Airbnb profitable in Perris in 2026? Explore comprehensive Airbnb analytics for Perris, California, United States to uncover income potential. This 2026 STR market report for Perris, based on AirROI data from February 2025 to January 2026, reveals key trends in the niche market of 37 active listings.
Whether you're considering an Airbnb investment in Perris, optimizing your existing vacation rental, or exploring rental arbitrage opportunities, understanding the Perris Airbnb data is crucial. Leveraging the low regulation environment is key to maximizing your short term rental income potential. Let's dive into the specifics.
Key Perris Airbnb Performance Metrics Overview
Monthly Airbnb Revenue Variations & Income Potential in Perris (2026)
Understanding the monthly revenue variations for Airbnb listings in Perris is key to maximizing your short term rental income potential. Seasonality significantly impacts earnings. Our analysis, based on data from the past 12 months, shows that the peak revenue month for STRs in Perris is typically April, while February often presents the lowest earnings, highlighting opportunities for strategic pricing adjustments during shoulder and low seasons. Explore the typical Airbnb income in Perris across different performance tiers:
- Best-in-class properties (Top 10%) achieve $6,879+ monthly, often utilizing dynamic pricing and superior guest experiences.
- Strong performing properties (Top 25%) earn $3,354 or more, indicating effective management and desirable locations/amenities.
- Typical properties (Median) generate around $1,532 per month, representing the average market performance.
- Entry-level properties (Bottom 25%) see earnings around $710, often with potential for optimization.
Average Monthly Airbnb Earnings Trend in Perris
Perris Airbnb Occupancy Rate Trends (2026)
Maximize your bookings by understanding the Perris STR occupancy trends. Seasonal demand shifts significantly influence how often properties are booked. Typically, Marchsees the highest demand (peak season occupancy), while February experiences the lowest (low season). Effective strategies, like adjusting minimum stays or offering promotions, can boost occupancy during slower periods. Here's how different property tiers perform in Perris:
- Best-in-class properties (Top 10%) achieve 68%+ occupancy, indicating high desirability and potentially optimized availability.
- Strong performing properties (Top 25%) maintain 48% or higher occupancy, suggesting good market fit and guest satisfaction.
- Typical properties (Median) have an occupancy rate around 29%.
- Entry-level properties (Bottom 25%) average 16% occupancy, potentially facing higher vacancy.
Average Monthly Occupancy Rate Trend in Perris
Average Daily Rate (ADR) Airbnb Trends in Perris (2026)
Effective short term rental pricing strategy in Perris involves understanding monthly ADR fluctuations. The Average Daily Rate (ADR) for Airbnb in Perris typically peaks in September and dips lowest during February. Leveraging Airbnb dynamic pricing tools or strategies based on this seasonality can significantly boost revenue. Here's a look at the typical nightly rates achieved:
- Best-in-class properties (Top 10%) command rates of $562+ per night, often due to premium features or locations.
- Strong performing properties (Top 25%) achieve nightly rates of $260 or more.
- Typical properties (Median) charge around $121 per night.
- Entry-level properties (Bottom 25%) earn around $71 per night.
Average Daily Rate (ADR) Trend by Month in Perris
Get Live Perris Market Intelligence 👇

Explore Real-time Analytics
Airbnb Seasonality Analysis & Trends in Perris (2026)
Peak Season (April, March, May)
- Revenue averages $3,293 per month
- Occupancy rates average 35.7%
- Daily rates average $240
Shoulder Season
- Revenue averages $2,879 per month
- Occupancy maintains around 34.2%
- Daily rates hold near $236
Low Season (January, February, August)
- Revenue drops to average $2,239 per month
- Occupancy decreases to average 32.6%
- Daily rates adjust to average $223
Seasonality Insights for Perris
- The Airbnb seasonality in Perris shows moderate seasonality with distinct peak and low periods. While the sections above show seasonal averages, it's also insightful to look at the extremes:
- During the high season, the absolute peak month showcases Perris's highest earning potential, with monthly revenues capable of climbing to $3,523, occupancy reaching a high of 43.7%, and ADRs peaking at $255.
- Conversely, the slowest single month of the year, typically falling within the low season, marks the market's lowest point. In this month, revenue might dip to $2,090, occupancy could drop to 29.4%, and ADRs may adjust down to $219.
- Understanding both the seasonal averages and these monthly peaks and troughs in revenue, occupancy, and ADR is crucial for maximizing your Airbnb profit potential in Perris.
Seasonal Strategies for Maximizing Profit
- Peak Season: Maximize revenue through premium pricing and potentially longer minimum stays. Ensure high availability.
- Low Season: Offer competitive pricing, special promotions (e.g., extended stay discounts), and flexible cancellation policies. Target off-season travelers like remote workers or budget-conscious guests.
- Shoulder Seasons: Implement dynamic pricing that balances peak and low rates. Target weekend travelers or specific events. Offer slightly more flexible terms than peak season.
- Regularly analyze your own performance against these Perris seasonality benchmarks and adjust your pricing and availability strategy accordingly.
Best Areas for Airbnb Investment in Perris (2026)
Exploring the top neighborhoods for short-term rentals in Perris? This section highlights key areas, outlining why they are attractive for hosts and guests, along with notable local attractions. Consider these locations based on your target guest profile and investment strategy.
| Neighborhood / Area | Why Host Here? (Target Guests & Appeal) | Key Attractions & Landmarks |
|---|---|---|
| Lakeview | A scenic area near Diamond Valley Lake, popular for outdoor activities, fishing, and hiking. Attracts nature lovers and families looking for a relaxing getaway. | Diamond Valley Lake, Valle Vista Park, Perris Valley Historical Museum, local hiking trails |
| Perris Fairgrounds | Home to various events, fairs, and festivals throughout the year. Great for hosting guests attending events and activities. | Perris Auto Speedway, Perris Fairgrounds Events, local food festivals, community events |
| Sunnymead Ranch | A beautiful residential community with a lake, park, and recreation areas. Well-suited for families looking for a peaceful environment. | Sunnymead Ranch Lake, parks and hiking trails, recreational activities, proximity to shopping centers |
| Downtown Perris | The historical center of Perris with a charming downtown feel. Close to shops, dining, and community activities. | Perris Depot Museum, local shops and restaurants, community events, historical sites |
| Menifee | Nearby growing community with shopping, dining, and recreational opportunities, popular among tourists looking for a suburban experience. | Menifee Marketplace, local parks, golf courses, Menifee Lakes |
| Canyon Lake | A residential area around a private lake, popular with those looking for leisure activities and a resort-like experience. | Canyon Lake, boating and fishing, golf courses, community events |
| Quail Valley | Offers a more rural vibe with scenic views and outdoor activities. Perfect for guests looking for tranquillity and nature. | Lakeview Nature Center, local parks, hiking trails, nearby vineyards |
| Ramona Expressway | A major thoroughfare that offers easy access to surrounding areas. Attractive for travel-focused guests and those attending nearby events or attractions. | easy access to shopping and dining, quick routes to neighboring cities, proximity to recreational activities, scenic drives |
Understanding Airbnb License Requirements & STR Laws in Perris (2026)
While Perris, California, United States currently shows low STR regulations, specific Airbnb license requirements might still exist or change. Always verify the latest short term rental regulations and Airbnb license requirements directly with local government authorities for Perris to ensure full compliance before hosting.
(Source: AirROI data, 2026, finding no licensed listings among those analyzed)
Top Performing Airbnb Properties in Perris (2026)
Benchmark your potential! Explore examples of top-performing Airbnb properties in Perrisbased on Trailing Twelve Month (TTM) revenue. Analyze their characteristics, revenue, occupancy rate, and ADR to understand what drives success in this market.
Serenity Mansion - Hilltop mansion with 25 beds!
Entire Place • 6 bedrooms

20% Off January! -Pool & Hot Tub, Great Views!
Entire Place • 7 bedrooms

Hacienda de Paz (Estate of Peace)
Entire Place • 5 bedrooms

Galaviz Mountain Ranch: Spacious stay, large patio
Entire Place • 4 bedrooms

❤️1st In BedComfort + Smarthome + SurroundSound ❤️
Entire Place • 4 bedrooms

Home in Perris, (Avocado Ave.)
Entire Place • 4 bedrooms
Note: Performance varies based on location, size, amenities, seasonality, and management quality. Data reflects the past 12 months.
Top Performing Airbnb Hosts in Perris (2026)
Learn from the best! This table showcases top-performing Airbnb hosts in Perris based on the number of properties managed and estimated total revenue over the past year. Analyze their scale and performance metrics.
| Host Name | Properties | Grossing Revenue | Stay Reviews | Avg Rating |
|---|---|---|---|---|
| Richard | 1 | $143,786 | 114 | 4.97/5.0 |
| SunnyDays | 1 | $136,671 | 29 | 4.52/5.0 |
| Steve | 4 | $120,103 | 477 | 4.42/5.0 |
| Yamilett | 1 | $80,149 | 15 | 4.87/5.0 |
| Alba | 1 | $51,658 | 31 | 4.58/5.0 |
| John | 1 | $44,286 | 345 | 4.87/5.0 |
| Jing | 4 | $33,512 | 33 | 4.65/5.0 |
| Toyin | 1 | $29,472 | 51 | 4.90/5.0 |
| Patrick | 1 | $26,810 | 6 | 5.00/5.0 |
| Grace C. | 1 | $22,958 | 52 | 4.52/5.0 |
Analyzing the strategies of top hosts, such as their property selection, pricing, and guest communication, can offer valuable lessons for optimizing your own Airbnb operations in Perris.
Dive Deeper: Advanced Perris STR Market Data (2026)
Ready to unlock more insights? AirROI provides access to advanced metrics and comprehensive Airbnb data for Perris. Explore detailed analytics beyond this report to refine your investment strategy, optimize pricing, and maximize your vacation rental profits.
Explore Advanced MetricsPerris Short-Term Rental Market Composition (2026): Property & Room Types
Room Type Distribution
Property Type Distribution
Market Composition Insights for Perris
- The Perris Airbnb market composition is heavily skewed towards Entire Home/Apt listings, which make up 70.3% of the 37 active rentals. This indicates strong guest preference for privacy and space.
- Looking at the property type distribution in Perris, House properties are the most common (78.4%), reflecting the local real estate landscape.
- Houses represent a significant 78.4% portion, catering likely to families or larger groups.
- Smaller segments like apartment/condo (combined 2.7%) offer potential for unique stay experiences.
Perris Airbnb Room Capacity Analysis (2026): Bedroom Distribution
Distribution of Listings by Number of Bedrooms
Room Capacity Insights for Perris
- The dominant room capacity in Perris is 1 bedroom listings, making up 24.3% of the market. This suggests a strong demand for properties suitable for couples or solo travelers.
- Together, 1 bedroom and 5+ bedrooms properties represent 37.8% of the active Airbnb listings in Perris, indicating a high concentration in these sizes.
- A significant 40.5% of listings offer 3+ bedrooms, catering to larger groups and families seeking more space in Perris.
Perris Vacation Rental Guest Capacity Trends (2026)
Distribution of Listings by Guest Capacity
Guest Capacity Insights for Perris
- The most common guest capacity trend in Perris vacation rentals is listings accommodating 8+ guests (29.7%). This suggests the primary traveler segment is likely larger groups.
- Properties designed for 8+ guests and 6 guests dominate the Perris STR market, accounting for 45.9% of listings.
- 51.3% of properties accommodate 6+ guests, serving the market segment for larger families or group travel in Perris.
- On average, properties in Perris are equipped to host 4.3 guests.
Perris Airbnb Booking Patterns (2026): Available vs. Booked Days
Available Days Distribution
Booked Days Distribution
Booking Pattern Insights for Perris
- The most common availability pattern in Perris falls within the 271-366 days range, representing 54.1% of listings. This suggests many properties have significant open periods on their calendars.
- Approximately 97.3% of listings show high availability (181+ days open annually), indicating potential for increased bookings or specific owner usage patterns.
- For booked days, the 91-180 days range is most frequent in Perris (45.9%), reflecting common guest stay durations or potential owner blocking patterns.
- A notable 2.7% of properties secure long booking periods (181+ days booked per year), highlighting successful long-term rental strategies or significant owner usage.
Perris Airbnb Minimum Stay Requirements Analysis
Distribution of Listings by Minimum Night Requirement
1 Night
10 listings
27% of total
2 Nights
13 listings
35.1% of total
4-6 Nights
1 listings
2.7% of total
7-29 Nights
8 listings
21.6% of total
30+ Nights
5 listings
13.5% of total
Key Insights
- The most prevalent minimum stay requirement in Perris is 2 Nights, adopted by 35.1% of listings. This highlights the market's preference for shorter, flexible bookings.
- A strong majority (62.1%) of the Perris Airbnb data shows acceptance of very short stays (1-2 nights), indicating a dynamic, high-turnover market.
- A significant segment (13.5%) caters to monthly stays (30+ nights) in Perris, pointing to opportunities in the extended-stay market.
Recommendations
- Align with the market by considering a 2 Nights minimum stay, as 35.1% of Perris hosts use this setting.
- If feasible, allowing 1-night stays, especially midweek or during low season, could capture last-minute bookings, as only 27% currently do.
- Explore offering discounts for stays of 30+ nights to attract the 13.5% of the market seeking extended stays.
- Adjust minimum nights based on seasonality – potentially shorter during low season and longer during peak demand periods in Perris.
Perris Airbnb Cancellation Policy Trends Analysis (2026)
Super Strict 30 Days
1 listings
2.7% of total
Flexible
12 listings
32.4% of total
Moderate
8 listings
21.6% of total
Firm
8 listings
21.6% of total
Strict
8 listings
21.6% of total
Cancellation Policy Insights for Perris
- The prevailing Airbnb cancellation policy trend in Perris is Flexible, used by 32.4% of listings.
- There's a relatively balanced mix between guest-friendly (54.0%) and stricter (43.2%) policies, offering choices for different guest needs.
Recommendations for Hosts
- Consider adopting a Flexible policy to align with the 32.4% market standard in Perris.
- Regularly review your cancellation policy against competitors and market demand shifts in Perris.
Perris STR Booking Lead Time Analysis (2026)
Average Booking Lead Time by Month
Booking Lead Time Insights for Perris
- The overall average booking lead time for vacation rentals in Perris is 37 days.
- Guests book furthest in advance for stays during October (average 53 days), likely coinciding with peak travel demand or local events.
- The shortest booking windows occur for stays in August (average 22 days), indicating more last-minute travel plans during this time.
- Seasonally, Spring (38 days avg.) sees the longest lead times, while Summer (24 days avg.) has the shortest, reflecting typical travel planning cycles.
Recommendations for Hosts
- Use the overall average lead time (37 days) as a baseline for your pricing and availability strategy in Perris.
- For October stays, consider implementing length-of-stay discounts or slightly higher rates for bookings made less than 53 days out to capitalize on advance planning.
- Target marketing efforts for the Spring season well in advance (at least 38 days) to capture early planners.
- Monitor your own booking lead times against these Perris averages to identify opportunities for dynamic pricing adjustments.
Popular & Essential Airbnb Amenities in Perris (2026)
Amenity Prevalence
Amenity Insights for Perris
- Essential amenities in Perris that guests expect include: Wifi, Free parking on premises. Lacking these (any) could significantly impact bookings.
- Popular amenities like Dishes and silverware, Air conditioning, Kitchen are common but not universal. Offering these can provide a competitive edge.
Recommendations for Hosts
- Ensure your listing includes all essential amenities for Perris: Wifi, Free parking on premises.
- Prioritize adding missing essentials: Wifi, Free parking on premises.
- Consider adding popular differentiators like Dishes and silverware or Air conditioning to increase appeal.
- Highlight unique or less common amenities you offer (e.g., hot tub, dedicated workspace, EV charger) in your listing description and photos.
- Regularly check competitor amenities in Perris to stay competitive.
Perris Airbnb Guest Demographics & Profile Analysis (2026)
Guest Profile Summary for Perris
- The typical guest profile for Airbnb in Perris consists of primarily domestic travelers (95%), often arriving from nearby Los Angeles, typically belonging to the Post-2000s (Gen Z/Alpha) group (50%), primarily speaking English or Spanish.
- Domestic travelers account for 94.5% of guests.
- Key international markets include United States (94.5%) and Brazil (1.4%).
- Top languages spoken are English (59.2%) followed by Spanish (24.3%).
- A significant demographic segment is the Post-2000s (Gen Z/Alpha) group, representing 50% of guests.
Recommendations for Hosts
- Target domestic marketing efforts towards travelers from Los Angeles and San Diego.
- Tailor amenities and listing descriptions to appeal to the dominant Post-2000s (Gen Z/Alpha) demographic (e.g., highlight fast WiFi, smart home features, local guides).
- Highlight unique local experiences or amenities relevant to the primary guest profile.
- Consider seasonal promotions aligned with peak travel times for key origin markets.
Nearby Short-Term Rental Market Comparison
How does the Perris Airbnb market stack up against its neighbors? Compare key performance metrics like average monthly revenue, ADR, and occupancy rates in surrounding areas to understand the broader regional STR landscape.
| Market | Active Properties | Monthly Revenue | Daily Rate | Avg. Occupancy |
|---|---|---|---|---|
| Newport Beach | 1,273 | $8,950 | $744.06 | 47% |
| Rancho San Diego | 25 | $8,649 | $568.72 | 48% |
| Malibu | 251 | $8,293 | $1263.89 | 35% |
| Thousand Palms | 33 | $8,119 | $725.48 | 36% |
| Manhattan Beach | 267 | $7,875 | $585.30 | 53% |
| Lakeside | 33 | $7,537 | $604.33 | 44% |
| GlenOak Hills | 41 | $7,394 | $648.65 | 41% |
| Bermuda Dunes | 143 | $7,324 | $664.90 | 39% |
| Mount Helix | 33 | $7,163 | $594.94 | 50% |
| Del Mar | 128 | $7,011 | $671.56 | 45% |