Petaluma Airbnb Market Analysis 2026: Short Term Rental Data & Vacation Rental Statistics in California, United States
Is Airbnb profitable in Petaluma in 2026? Explore comprehensive Airbnb analytics for Petaluma, California, United States to uncover income potential. This 2026 STR market report for Petaluma, based on AirROI data from February 2025 to January 2026, reveals key trends in the niche market of 139 active listings.
Whether you're considering an Airbnb investment in Petaluma, optimizing your existing vacation rental, or exploring rental arbitrage opportunities, understanding the Petaluma Airbnb data is crucial. Leveraging the low regulation environment is key to maximizing your short term rental income potential. Let's dive into the specifics.
Key Petaluma Airbnb Performance Metrics Overview
Monthly Airbnb Revenue Variations & Income Potential in Petaluma (2026)
Understanding the monthly revenue variations for Airbnb listings in Petaluma is key to maximizing your short term rental income potential. Seasonality significantly impacts earnings. Our analysis, based on data from the past 12 months, shows that the peak revenue month for STRs in Petaluma is typically July, while January often presents the lowest earnings, highlighting opportunities for strategic pricing adjustments during shoulder and low seasons. Explore the typical Airbnb income in Petaluma across different performance tiers:
- Best-in-class properties (Top 10%) achieve $9,564+ monthly, often utilizing dynamic pricing and superior guest experiences.
- Strong performing properties (Top 25%) earn $5,742 or more, indicating effective management and desirable locations/amenities.
- Typical properties (Median) generate around $3,300 per month, representing the average market performance.
- Entry-level properties (Bottom 25%) see earnings around $1,960, often with potential for optimization.
Average Monthly Airbnb Earnings Trend in Petaluma
Petaluma Airbnb Occupancy Rate Trends (2026)
Maximize your bookings by understanding the Petaluma STR occupancy trends. Seasonal demand shifts significantly influence how often properties are booked. Typically, Julysees the highest demand (peak season occupancy), while January experiences the lowest (low season). Effective strategies, like adjusting minimum stays or offering promotions, can boost occupancy during slower periods. Here's how different property tiers perform in Petaluma:
- Best-in-class properties (Top 10%) achieve 85%+ occupancy, indicating high desirability and potentially optimized availability.
- Strong performing properties (Top 25%) maintain 70% or higher occupancy, suggesting good market fit and guest satisfaction.
- Typical properties (Median) have an occupancy rate around 49%.
- Entry-level properties (Bottom 25%) average 27% occupancy, potentially facing higher vacancy.
Average Monthly Occupancy Rate Trend in Petaluma
Average Daily Rate (ADR) Airbnb Trends in Petaluma (2026)
Effective short term rental pricing strategy in Petaluma involves understanding monthly ADR fluctuations. The Average Daily Rate (ADR) for Airbnb in Petaluma typically peaks in May and dips lowest during February. Leveraging Airbnb dynamic pricing tools or strategies based on this seasonality can significantly boost revenue. Here's a look at the typical nightly rates achieved:
- Best-in-class properties (Top 10%) command rates of $587+ per night, often due to premium features or locations.
- Strong performing properties (Top 25%) achieve nightly rates of $326 or more.
- Typical properties (Median) charge around $195 per night.
- Entry-level properties (Bottom 25%) earn around $132 per night.
Average Daily Rate (ADR) Trend by Month in Petaluma
Get Live Petaluma Market Intelligence 👇

Explore Real-time Analytics
Airbnb Seasonality Analysis & Trends in Petaluma (2026)
Peak Season (July, June, August)
- Revenue averages $5,574 per month
- Occupancy rates average 55.4%
- Daily rates average $287
Shoulder Season
- Revenue averages $4,568 per month
- Occupancy maintains around 48.4%
- Daily rates hold near $288
Low Season (January, February, November)
- Revenue drops to average $3,374 per month
- Occupancy decreases to average 44.0%
- Daily rates adjust to average $277
Seasonality Insights for Petaluma
- The Airbnb seasonality in Petaluma shows moderate seasonality with distinct peak and low periods. While the sections above show seasonal averages, it's also insightful to look at the extremes:
- During the high season, the absolute peak month showcases Petaluma's highest earning potential, with monthly revenues capable of climbing to $5,827, occupancy reaching a high of 59.0%, and ADRs peaking at $297.
- Conversely, the slowest single month of the year, typically falling within the low season, marks the market's lowest point. In this month, revenue might dip to $3,101, occupancy could drop to 38.8%, and ADRs may adjust down to $264.
- Understanding both the seasonal averages and these monthly peaks and troughs in revenue, occupancy, and ADR is crucial for maximizing your Airbnb profit potential in Petaluma.
Seasonal Strategies for Maximizing Profit
- Peak Season: Maximize revenue through premium pricing and potentially longer minimum stays. Ensure high availability.
- Low Season: Offer competitive pricing, special promotions (e.g., extended stay discounts), and flexible cancellation policies. Target off-season travelers like remote workers or budget-conscious guests.
- Shoulder Seasons: Implement dynamic pricing that balances peak and low rates. Target weekend travelers or specific events. Offer slightly more flexible terms than peak season.
- Regularly analyze your own performance against these Petaluma seasonality benchmarks and adjust your pricing and availability strategy accordingly.
Best Areas for Airbnb Investment in Petaluma (2026)
Exploring the top neighborhoods for short-term rentals in Petaluma? This section highlights key areas, outlining why they are attractive for hosts and guests, along with notable local attractions. Consider these locations based on your target guest profile and investment strategy.
| Neighborhood / Area | Why Host Here? (Target Guests & Appeal) | Key Attractions & Landmarks |
|---|---|---|
| Downtown Petaluma | The heart of Petaluma, with charming historic buildings, unique shops, and a vibrant restaurant scene. It's a popular spot for tourists looking to experience the local culture and community events. | Petaluma Historic Museum, The Petaluma River, Shollenberger Park, Petaluma Arts Center, Great Petaluma Mill |
| East Petaluma | A residential area that's gaining popularity with families and young professionals. Close to amenities and parks, making it appealing for longer stays and family vacations. | Latimer Grove Park, St. Vincent de Paul Park, Petaluma Village Premium Outlets, Parks and Open Spaces, Local wineries |
| West Petaluma | Known for its scenic views and proximity to nature trails. A great retreat for those seeking outdoor activities and relaxation away from the busier parts of town. | Petaluma Adobe State Historic Park, Natchez Ranch, Shollenberger Park, Local hiking trails, Wineries in Sonoma County |
| Petaluma Riverfront | A picturesque area along the river offering scenic views, walking paths, and a relaxed atmosphere. Ideal for visitors looking for peace and tranquility with easy access to downtown. | Petaluma River Walk, Restaurants and cafes along the river, Kayaking and paddle boarding, Local art installations, Outdoor festivals |
| Lakeville Highway | A gateway to the wine country, this area attracts visitors seeking wine tours and vineyard experiences, making it ideal for Airbnb hosting. | Wine tasting rooms, Vineyard tours, Outdoor events and festivals, Local farmers market, Historic sites |
| East Washington Street | A mix of residential and commercial areas with shopping and dining options. Close to public transportation and amenities, appealing to a variety of travelers. | Petaluma Fairgrounds, Local shopping centers, Dining options, Civic Center, Public parks |
| Sonoma Mountain | Offers stunning views and a tranquil atmosphere, perfect for vacation rentals. Attracts nature lovers and those seeking a retreat. | Sonoma Mountain State Park, Hiking trails, Scenic vistas, Local artisan shops, Wine tasting in surrounding areas |
| Rosedale | A family-friendly neighborhood that offers parks and schools. Appealing for families visiting the area or looking for extended stays. | Rosedale Park, Local playgrounds, Community events, Schools and child-friendly attractions, Nearby shopping |
Understanding Airbnb License Requirements & STR Laws in Petaluma (2026)
While Petaluma, California, United States currently shows low STR regulations, specific Airbnb license requirements might still exist or change. Always verify the latest short term rental regulations and Airbnb license requirements directly with local government authorities for Petaluma to ensure full compliance before hosting.
(Source: AirROI data, 2026, based on 7% licensed listings)
Top Performing Airbnb Properties in Petaluma (2026)
Benchmark your potential! Explore examples of top-performing Airbnb properties in Petalumabased on Trailing Twelve Month (TTM) revenue. Analyze their characteristics, revenue, occupancy rate, and ADR to understand what drives success in this market.

Petaluma Ranch Resort-Pool/spa/OD fire & kitchen
Entire Place • 6 bedrooms
The Roost - A Private Escape in Downtown Petaluma!
Entire Place • 3 bedrooms
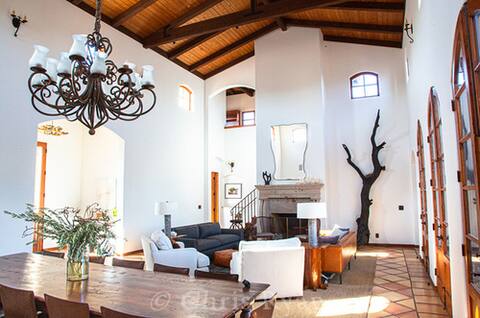
Gorgeous Mediterranean Estate Ranch
Entire Place • 4 bedrooms

Updated and Spacious 3BR/2BA Victorian Style Home
Entire Place • 3 bedrooms

Spacious Restored Downtown Craftsman
Entire Place • 3 bedrooms

Stunning Sonoma County Home with Amazing Views
Entire Place • 3 bedrooms
Note: Performance varies based on location, size, amenities, seasonality, and management quality. Data reflects the past 12 months.
Top Performing Airbnb Hosts in Petaluma (2026)
Learn from the best! This table showcases top-performing Airbnb hosts in Petaluma based on the number of properties managed and estimated total revenue over the past year. Analyze their scale and performance metrics.
| Host Name | Properties | Grossing Revenue | Stay Reviews | Avg Rating |
|---|---|---|---|---|
| Bespoke Travel | 4 | $332,013 | 159 | 4.86/5.0 |
| Lauren | 2 | $287,801 | 139 | 4.97/5.0 |
| Frank | 4 | $258,512 | 533 | 4.88/5.0 |
| Matt & Ginny | 1 | $147,224 | 100 | 4.97/5.0 |
| Evolve | 2 | $140,910 | 33 | 4.96/5.0 |
| Chris | 1 | $135,831 | 50 | 5.00/5.0 |
| Parker | 1 | $128,475 | 131 | 4.81/5.0 |
| Scott | 1 | $127,346 | 158 | 4.96/5.0 |
| Terence | 1 | $125,678 | 13 | 5.00/5.0 |
| Kate | 2 | $124,111 | 18 | 5.00/5.0 |
Analyzing the strategies of top hosts, such as their property selection, pricing, and guest communication, can offer valuable lessons for optimizing your own Airbnb operations in Petaluma.
Dive Deeper: Advanced Petaluma STR Market Data (2026)
Ready to unlock more insights? AirROI provides access to advanced metrics and comprehensive Airbnb data for Petaluma. Explore detailed analytics beyond this report to refine your investment strategy, optimize pricing, and maximize your vacation rental profits.
Explore Advanced MetricsPetaluma Short-Term Rental Market Composition (2026): Property & Room Types
Room Type Distribution
Property Type Distribution
Market Composition Insights for Petaluma
- The Petaluma Airbnb market composition is heavily skewed towards Entire Home/Apt listings, which make up 84.2% of the 139 active rentals. This indicates strong guest preference for privacy and space.
- Looking at the property type distribution in Petaluma, House properties are the most common (47.5%), reflecting the local real estate landscape.
- Houses represent a significant 47.5% portion, catering likely to families or larger groups.
- The presence of 23% Hotel/Boutique listings indicates integration with traditional hospitality.
- Smaller segments like unique stays (combined 0.7%) offer potential for unique stay experiences.
Petaluma Airbnb Room Capacity Analysis (2026): Bedroom Distribution
Distribution of Listings by Number of Bedrooms
Room Capacity Insights for Petaluma
- The dominant room capacity in Petaluma is 1 bedroom listings, making up 37.4% of the market. This suggests a strong demand for properties suitable for couples or solo travelers.
- Together, 1 bedroom and 2 bedrooms properties represent 56.8% of the active Airbnb listings in Petaluma, indicating a high concentration in these sizes.
- A significant 25.3% of listings offer 3+ bedrooms, catering to larger groups and families seeking more space in Petaluma.
Petaluma Vacation Rental Guest Capacity Trends (2026)
Distribution of Listings by Guest Capacity
Guest Capacity Insights for Petaluma
- The most common guest capacity trend in Petaluma vacation rentals is listings accommodating 2 guests (35.3%). This suggests the primary traveler segment is likely couples or solo travelers.
- Properties designed for 2 guests and 4 guests dominate the Petaluma STR market, accounting for 52.6% of listings.
- 26.6% of properties accommodate 6+ guests, serving the market segment for larger families or group travel in Petaluma.
- On average, properties in Petaluma are equipped to host 3.6 guests.
Petaluma Airbnb Booking Patterns (2026): Available vs. Booked Days
Available Days Distribution
Booked Days Distribution
Booking Pattern Insights for Petaluma
- The most common availability pattern in Petaluma falls within the 271-366 days range, representing 33.8% of listings. This suggests many properties have significant open periods on their calendars.
- Approximately 64.0% of listings show high availability (181+ days open annually), indicating potential for increased bookings or specific owner usage patterns.
- For booked days, the 91-180 days range is most frequent in Petaluma (28.8%), reflecting common guest stay durations or potential owner blocking patterns.
- A notable 37.4% of properties secure long booking periods (181+ days booked per year), highlighting successful long-term rental strategies or significant owner usage.
Petaluma Airbnb Minimum Stay Requirements Analysis
Distribution of Listings by Minimum Night Requirement
1 Night
27 listings
19.4% of total
2 Nights
40 listings
28.8% of total
3 Nights
6 listings
4.3% of total
4-6 Nights
7 listings
5% of total
7-29 Nights
6 listings
4.3% of total
30+ Nights
53 listings
38.1% of total
Key Insights
- The most prevalent minimum stay requirement in Petaluma is 30+ Nights, adopted by 38.1% of listings. This highlights the market's preference for longer commitments.
- A significant segment (38.1%) caters to monthly stays (30+ nights) in Petaluma, pointing to opportunities in the extended-stay market.
Recommendations
- Align with the market by considering a 30+ Nights minimum stay, as 38.1% of Petaluma hosts use this setting.
- If feasible, allowing 1-night stays, especially midweek or during low season, could capture last-minute bookings, as only 19.4% currently do.
- Explore offering discounts for stays of 30+ nights to attract the 38.1% of the market seeking extended stays.
- Adjust minimum nights based on seasonality – potentially shorter during low season and longer during peak demand periods in Petaluma.
Petaluma Airbnb Cancellation Policy Trends Analysis (2026)
Limited
2 listings
1.4% of total
Super Strict 30 Days
1 listings
0.7% of total
Super Strict 60 Days
3 listings
2.2% of total
Flexible
20 listings
14.4% of total
Moderate
51 listings
36.7% of total
Firm
41 listings
29.5% of total
Strict
21 listings
15.1% of total
Cancellation Policy Insights for Petaluma
- The prevailing Airbnb cancellation policy trend in Petaluma is Moderate, used by 36.7% of listings.
- There's a relatively balanced mix between guest-friendly (51.1%) and stricter (44.6%) policies, offering choices for different guest needs.
Recommendations for Hosts
- Consider adopting a Moderate policy to align with the 36.7% market standard in Petaluma.
- Regularly review your cancellation policy against competitors and market demand shifts in Petaluma.
Petaluma STR Booking Lead Time Analysis (2026)
Average Booking Lead Time by Month
Booking Lead Time Insights for Petaluma
- The overall average booking lead time for vacation rentals in Petaluma is 50 days.
- Guests book furthest in advance for stays during May (average 67 days), likely coinciding with peak travel demand or local events.
- The shortest booking windows occur for stays in February (average 30 days), indicating more last-minute travel plans during this time.
- Seasonally, Fall (56 days avg.) sees the longest lead times, while Winter (39 days avg.) has the shortest, reflecting typical travel planning cycles.
Recommendations for Hosts
- Use the overall average lead time (50 days) as a baseline for your pricing and availability strategy in Petaluma.
- For May stays, consider implementing length-of-stay discounts or slightly higher rates for bookings made less than 67 days out to capitalize on advance planning.
- Target marketing efforts for the Fall season well in advance (at least 56 days) to capture early planners.
- Monitor your own booking lead times against these Petaluma averages to identify opportunities for dynamic pricing adjustments.
Popular & Essential Airbnb Amenities in Petaluma (2026)
Amenity Prevalence
Amenity Insights for Petaluma
- Essential amenities in Petaluma that guests expect include: Wifi, Smoke alarm, Heating, Hot water. Lacking these (any) could significantly impact bookings.
- Popular amenities like Hair dryer, Carbon monoxide alarm, Essentials are common but not universal. Offering these can provide a competitive edge.
Recommendations for Hosts
- Ensure your listing includes all essential amenities for Petaluma: Wifi, Smoke alarm, Heating, Hot water.
- Prioritize adding missing essentials: Smoke alarm, Heating, Hot water.
- Consider adding popular differentiators like Hair dryer or Carbon monoxide alarm to increase appeal.
- Highlight unique or less common amenities you offer (e.g., hot tub, dedicated workspace, EV charger) in your listing description and photos.
- Regularly check competitor amenities in Petaluma to stay competitive.
Petaluma Airbnb Guest Demographics & Profile Analysis (2026)
Guest Profile Summary for Petaluma
- The typical guest profile for Airbnb in Petaluma consists of primarily domestic travelers (95%), often arriving from nearby San Francisco, typically belonging to the Post-2000s (Gen Z/Alpha) group (50%), primarily speaking English or Spanish.
- Domestic travelers account for 94.7% of guests.
- Key international markets include United States (94.7%) and United Kingdom (0.8%).
- Top languages spoken are English (60%) followed by Spanish (15.3%).
- A significant demographic segment is the Post-2000s (Gen Z/Alpha) group, representing 50% of guests.
Recommendations for Hosts
- Target domestic marketing efforts towards travelers from San Francisco and Los Angeles.
- Tailor amenities and listing descriptions to appeal to the dominant Post-2000s (Gen Z/Alpha) demographic (e.g., highlight fast WiFi, smart home features, local guides).
- Highlight unique local experiences or amenities relevant to the primary guest profile.
- Consider seasonal promotions aligned with peak travel times for key origin markets.
Nearby Short-Term Rental Market Comparison
How does the Petaluma Airbnb market stack up against its neighbors? Compare key performance metrics like average monthly revenue, ADR, and occupancy rates in surrounding areas to understand the broader regional STR landscape.
| Market | Active Properties | Monthly Revenue | Daily Rate | Avg. Occupancy |
|---|---|---|---|---|
| Moss Beach | 34 | $10,092 | $676.91 | 53% |
| Sonoma | 228 | $9,647 | $819.87 | 43% |
| Marshall | 18 | $8,897 | $607.75 | 50% |
| St. Helena | 50 | $8,684 | $924.70 | 38% |
| Kenwood | 60 | $8,643 | $810.83 | 41% |
| Glen Ellen | 85 | $8,482 | $799.53 | 43% |
| Eldridge | 21 | $8,410 | $930.61 | 41% |
| Dillon Beach | 82 | $8,062 | $703.26 | 41% |
| Stinson Beach | 106 | $7,814 | $812.15 | 43% |
| Healdsburg | 195 | $7,538 | $744.46 | 41% |