Plumas Eureka Airbnb Market Analysis 2025: Short Term Rental Data & Vacation Rental Statistics in California, United States
Is Airbnb profitable in Plumas Eureka in 2025? Explore comprehensive Airbnb analytics for Plumas Eureka, California, United States to uncover income potential. This 2025 STR market report for Plumas Eureka, based on AirROI data from October 2024 to September 2025, reveals key trends in the niche market of 18 active listings.
Whether you're considering an Airbnb investment in Plumas Eureka, optimizing your existing vacation rental, or exploring rental arbitrage opportunities, understanding the Plumas Eureka Airbnb data is crucial. Leveraging the low regulation environment is key to maximizing your short term rental income potential. Let's dive into the specifics.
Key Plumas Eureka Airbnb Performance Metrics Overview
Monthly Airbnb Revenue Variations & Income Potential in Plumas Eureka (2025)
Understanding the monthly revenue variations for Airbnb listings in Plumas Eureka is key to maximizing your short term rental income potential. Seasonality significantly impacts earnings. Our analysis, based on data from the past 12 months, shows that the peak revenue month for STRs in Plumas Eureka is typically July, while April often presents the lowest earnings, highlighting opportunities for strategic pricing adjustments during shoulder and low seasons. Explore the typical Airbnb income in Plumas Eureka across different performance tiers:
- Best-in-class properties (Top 10%) achieve $7,261+ monthly, often utilizing dynamic pricing and superior guest experiences.
- Strong performing properties (Top 25%) earn $5,363 or more, indicating effective management and desirable locations/amenities.
- Typical properties (Median) generate around $3,387 per month, representing the average market performance.
- Entry-level properties (Bottom 25%) see earnings around $2,386, often with potential for optimization.
Average Monthly Airbnb Earnings Trend in Plumas Eureka
Plumas Eureka Airbnb Occupancy Rate Trends (2025)
Maximize your bookings by understanding the Plumas Eureka STR occupancy trends. Seasonal demand shifts significantly influence how often properties are booked. Typically, Julysees the highest demand (peak season occupancy), while April experiences the lowest (low season). Effective strategies, like adjusting minimum stays or offering promotions, can boost occupancy during slower periods. Here's how different property tiers perform in Plumas Eureka:
- Best-in-class properties (Top 10%) achieve 62%+ occupancy, indicating high desirability and potentially optimized availability.
- Strong performing properties (Top 25%) maintain 48% or higher occupancy, suggesting good market fit and guest satisfaction.
- Typical properties (Median) have an occupancy rate around 31%.
- Entry-level properties (Bottom 25%) average 20% occupancy, potentially facing higher vacancy.
Average Monthly Occupancy Rate Trend in Plumas Eureka
Average Daily Rate (ADR) Airbnb Trends in Plumas Eureka (2025)
Effective short term rental pricing strategy in Plumas Eureka involves understanding monthly ADR fluctuations. The Average Daily Rate (ADR) for Airbnb in Plumas Eureka typically peaks in June and dips lowest during January. Leveraging Airbnb dynamic pricing tools or strategies based on this seasonality can significantly boost revenue. Here's a look at the typical nightly rates achieved:
- Best-in-class properties (Top 10%) command rates of $604+ per night, often due to premium features or locations.
- Strong performing properties (Top 25%) achieve nightly rates of $508 or more.
- Typical properties (Median) charge around $366 per night.
- Entry-level properties (Bottom 25%) earn around $296 per night.
Average Daily Rate (ADR) Trend by Month in Plumas Eureka
Get Live Plumas Eureka Market Intelligence 👇

Explore Real-time Analytics
Airbnb Seasonality Analysis & Trends in Plumas Eureka (2025)
Peak Season (July, June, August)
- Revenue averages $6,841 per month
- Occupancy rates average 51.6%
- Daily rates average $474
Shoulder Season
- Revenue averages $4,124 per month
- Occupancy maintains around 34.5%
- Daily rates hold near $399
Low Season (January, February, April)
- Revenue drops to average $1,933 per month
- Occupancy decreases to average 22.3%
- Daily rates adjust to average $378
Seasonality Insights for Plumas Eureka
- The Airbnb seasonality in Plumas Eureka shows highly seasonal trends requiring careful strategy. While the sections above show seasonal averages, it's also insightful to look at the extremes:
- During the high season, the absolute peak month showcases Plumas Eureka's highest earning potential, with monthly revenues capable of climbing to $7,868, occupancy reaching a high of 61.7%, and ADRs peaking at $482.
- Conversely, the slowest single month of the year, typically falling within the low season, marks the market's lowest point. In this month, revenue might dip to $1,305, occupancy could drop to 11.9%, and ADRs may adjust down to $364.
- Understanding both the seasonal averages and these monthly peaks and troughs in revenue, occupancy, and ADR is crucial for maximizing your Airbnb profit potential in Plumas Eureka.
Seasonal Strategies for Maximizing Profit
- Peak Season: Maximize revenue through premium pricing and potentially longer minimum stays. Ensure high availability.
- Low Season: Offer competitive pricing, special promotions (e.g., extended stay discounts), and flexible cancellation policies. Target off-season travelers like remote workers or budget-conscious guests.
- Shoulder Seasons: Implement dynamic pricing that balances peak and low rates. Target weekend travelers or specific events. Offer slightly more flexible terms than peak season.
- Regularly analyze your own performance against these Plumas Eureka seasonality benchmarks and adjust your pricing and availability strategy accordingly.
Best Areas for Airbnb Investment in Plumas Eureka (2025)
Exploring the top neighborhoods for short-term rentals in Plumas Eureka? This section highlights key areas, outlining why they are attractive for hosts and guests, along with notable local attractions. Consider these locations based on your target guest profile and investment strategy.
| Neighborhood / Area | Why Host Here? (Target Guests & Appeal) | Key Attractions & Landmarks |
|---|---|---|
| Lake Davis | A beautiful alpine lake surrounded by the Sierra Nevada mountains, perfect for outdoor enthusiasts and families looking for a serene getaway. Popular for fishing, boating, and hiking. | Lake Davis, Dunkeldack Point, Davis Campground, Hiking trails, Fishing spots |
| Graeagle | A charming mountain village known for its scenic beauty, golf courses, and proximity to the Plumas National Forest. Ideal for visitors seeking both adventure and relaxation. | Graeagle Mill Works, Whitehawk Ranch Golf Club, Plumas Eureka State Park, Hiking trails, Local shops and cafes |
| Quincy | The historic county seat of Plumas County, offering charming shops, restaurants, and access to outdoor activities. A great spot for those who appreciate history and community. | Plumas County Museum, Quincy Library Gallery, Johnsville Historic Ski Area, Local arts and crafts, Annual events and festivals |
| Spanish Creek | A tranquil area known for its scenic river and natural beauty, ideal for those looking for a peaceful retreat and outdoor activities such as fishing and hiking. | Spanish Creek, Fishing spots, Hiking trails, Wildlife viewing |
| Pioneer Town | A unique historical site that features old mining structures and a glimpse into California's gold rush past. Appeals to history buffs and those interested in unique experiences. | Pioneer Town Museum, Historical mining sites, Guided tours, Scenic views |
| Gold Lake | A picturesque lake area that attracts visitors for its stunning views and opportunities for outdoor recreation such as swimming, picnicking, and hiking. | Gold Lake, Swimming spots, Hiking trails, Photography opportunities |
| Chester | A beautiful town near Lake Almanor, offering quaint shops, restaurants, and access to outdoor activities. Perfect for families and groups looking to explore nature. | Lake Almanor, Chester Park, Local shops, Dining options, Nature trails |
| Loyalton | A small town that serves as a gateway to the surrounding Sierra Nevada mountains, ideal for those seeking adventure sports and exploring the great outdoors. | Sierra Valley, Wildlife viewing, Hiking opportunities, Local parks |
Understanding Airbnb License Requirements & STR Laws in Plumas Eureka (2025)
While Plumas Eureka, California, United States currently shows low STR regulations, specific Airbnb license requirements might still exist or change. Always verify the latest short term rental regulations and Airbnb license requirements directly with local government authorities for Plumas Eureka to ensure full compliance before hosting.
(Source: AirROI data, 2025, finding no licensed listings among those analyzed)
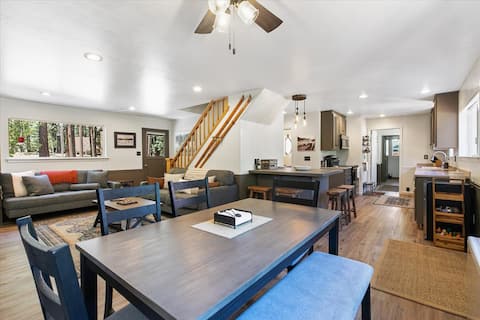
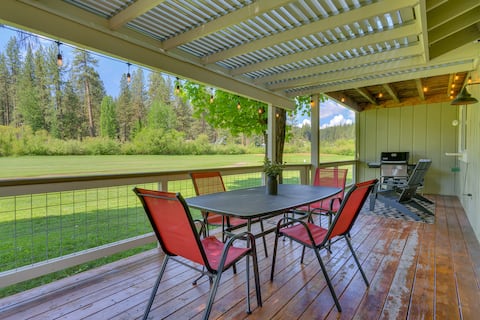
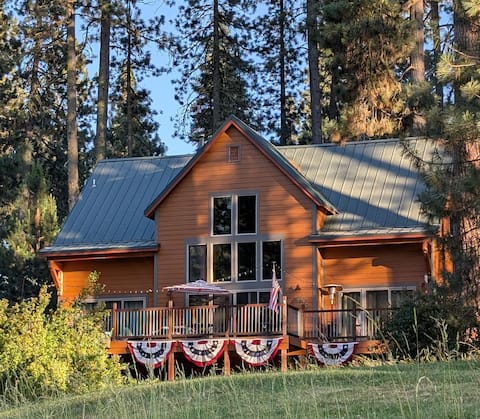
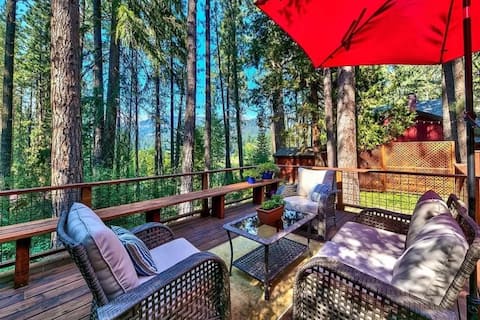
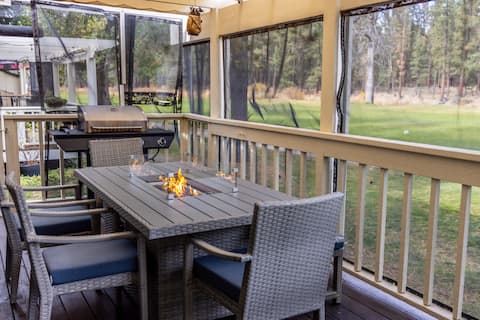
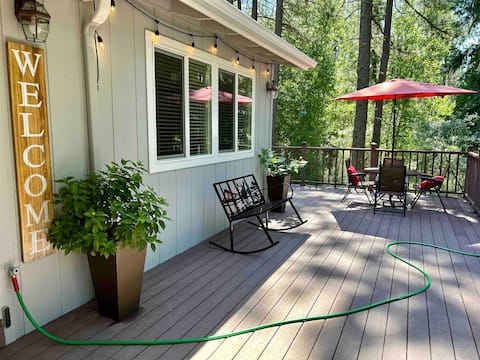
Top Performing Airbnb Properties in Plumas Eureka (2025)
Benchmark your potential! Explore examples of top-performing Airbnb properties in Plumas Eurekabased on Trailing Twelve Month (TTM) revenue. Analyze their characteristics, revenue, occupancy rate, and ADR to understand what drives success in this market.
Graeagle Retreat by the River
Entire Place • 5 bedrooms
Golf Course Escape • Views+Coffee Bar+Shuffleboard
Entire Place • 4 bedrooms
Rcabin on Plumas Pines Golf Course
Entire Place • 3 bedrooms
Modern Cozy Cabin w/ Spectacular Deck
Entire Place • 3 bedrooms
Breath Fresh Mt Air from Private Deck w/River View
Entire Place • 4 bedrooms
The Evergreen Relaxing Cabin
Entire Place • 2 bedrooms
Note: Performance varies based on location, size, amenities, seasonality, and management quality. Data reflects the past 12 months.
Top Performing Airbnb Hosts in Plumas Eureka (2025)
Learn from the best! This table showcases top-performing Airbnb hosts in Plumas Eureka based on the number of properties managed and estimated total revenue over the past year. Analyze their scale and performance metrics.
| Host Name | Properties | Grossing Revenue | Stay Reviews | Avg Rating |
|---|---|---|---|---|
| Allen | 1 | $96,051 | 26 | 5.00/5.0 |
| Plumas Pines | 6 | $80,978 | 14 | 4.88/5.0 |
| Chelsea | 1 | $69,901 | 75 | 4.99/5.0 |
| Julie | 1 | $69,041 | 17 | 5.00/5.0 |
| Garrett | 2 | $62,358 | 82 | 4.95/5.0 |
| Jeff | 1 | $54,151 | 67 | 4.99/5.0 |
| Tyler | 1 | $51,376 | 50 | 5.00/5.0 |
| Wendy | 1 | $44,556 | 60 | 4.98/5.0 |
| Allison | 1 | $38,639 | 37 | 4.84/5.0 |
| Mara | 1 | $37,071 | 15 | 5.00/5.0 |
Analyzing the strategies of top hosts, such as their property selection, pricing, and guest communication, can offer valuable lessons for optimizing your own Airbnb operations in Plumas Eureka.
Dive Deeper: Advanced Plumas Eureka STR Market Data (2025)
Ready to unlock more insights? AirROI provides access to advanced metrics and comprehensive Airbnb data for Plumas Eureka. Explore detailed analytics beyond this report to refine your investment strategy, optimize pricing, and maximize your vacation rental profits.
Explore Advanced MetricsPlumas Eureka Short-Term Rental Market Composition (2025): Property & Room Types
Room Type Distribution
Property Type Distribution
Market Composition Insights for Plumas Eureka
- The Plumas Eureka Airbnb market composition is heavily skewed towards Entire Home/Apt listings, which make up 100% of the 18 active rentals. This indicates strong guest preference for privacy and space.
- Looking at the property type distribution in Plumas Eureka, House properties are the most common (88.9%), reflecting the local real estate landscape.
- Houses represent a significant 88.9% portion, catering likely to families or larger groups.
Plumas Eureka Airbnb Room Capacity Analysis (2025): Bedroom Distribution
Distribution of Listings by Number of Bedrooms
Room Capacity Insights for Plumas Eureka
- The dominant room capacity in Plumas Eureka is 3 bedrooms listings, making up 61.1% of the market. This suggests a strong demand for properties suitable for families or small groups.
- Together, 3 bedrooms and 4 bedrooms properties represent 77.8% of the active Airbnb listings in Plumas Eureka, indicating a high concentration in these sizes.
- A significant 83.4% of listings offer 3+ bedrooms, catering to larger groups and families seeking more space in Plumas Eureka.
Plumas Eureka Vacation Rental Guest Capacity Trends (2025)
Distribution of Listings by Guest Capacity
Guest Capacity Insights for Plumas Eureka
- The most common guest capacity trend in Plumas Eureka vacation rentals is listings accommodating 8+ guests (44.4%). This suggests the primary traveler segment is likely larger groups.
- Properties designed for 8+ guests and 6 guests dominate the Plumas Eureka STR market, accounting for 72.2% of listings.
- 83.3% of properties accommodate 6+ guests, serving the market segment for larger families or group travel in Plumas Eureka.
- On average, properties in Plumas Eureka are equipped to host 6.7 guests.
Plumas Eureka Airbnb Booking Patterns (2025): Available vs. Booked Days
Available Days Distribution
Booked Days Distribution
Booking Pattern Insights for Plumas Eureka
- The most common availability pattern in Plumas Eureka falls within the 271-366 days range, representing 50% of listings. This suggests many properties have significant open periods on their calendars.
- Approximately 94.4% of listings show high availability (181+ days open annually), indicating potential for increased bookings or specific owner usage patterns.
- For booked days, the 91-180 days range is most frequent in Plumas Eureka (44.4%), reflecting common guest stay durations or potential owner blocking patterns.
- A notable 5.6% of properties secure long booking periods (181+ days booked per year), highlighting successful long-term rental strategies or significant owner usage.
Plumas Eureka Airbnb Minimum Stay Requirements Analysis
Distribution of Listings by Minimum Night Requirement
1 Night
1 listings
5.9% of total
2 Nights
7 listings
41.2% of total
3 Nights
2 listings
11.8% of total
30+ Nights
7 listings
41.2% of total
Key Insights
- The most prevalent minimum stay requirement in Plumas Eureka is 2 Nights, adopted by 41.2% of listings. This highlights the market's preference for shorter, flexible bookings.
- A significant segment (41.2%) caters to monthly stays (30+ nights) in Plumas Eureka, pointing to opportunities in the extended-stay market.
Recommendations
- Align with the market by considering a 2 Nights minimum stay, as 41.2% of Plumas Eureka hosts use this setting.
- If feasible, allowing 1-night stays, especially midweek or during low season, could capture last-minute bookings, as only 5.9% currently do.
- A 2-night minimum appears standard (41.2%). Consider this for weekends or peak periods.
- Explore offering discounts for stays of 30+ nights to attract the 41.2% of the market seeking extended stays.
- Adjust minimum nights based on seasonality – potentially shorter during low season and longer during peak demand periods in Plumas Eureka.
Plumas Eureka Airbnb Cancellation Policy Trends Analysis (2025)
Super Strict 30 Days
3 listings
17.6% of total
Super Strict 60 Days
2 listings
11.8% of total
Flexible
3 listings
17.6% of total
Moderate
4 listings
23.5% of total
Firm
5 listings
29.4% of total
Cancellation Policy Insights for Plumas Eureka
- The prevailing Airbnb cancellation policy trend in Plumas Eureka is Firm, used by 29.4% of listings.
- There's a relatively balanced mix between guest-friendly (41.1%) and stricter (29.4%) policies, offering choices for different guest needs.
Recommendations for Hosts
- Consider adopting a Firm policy to align with the 29.4% market standard in Plumas Eureka.
- Regularly review your cancellation policy against competitors and market demand shifts in Plumas Eureka.
Plumas Eureka STR Booking Lead Time Analysis (2025)
Average Booking Lead Time by Month
Booking Lead Time Insights for Plumas Eureka
- The overall average booking lead time for vacation rentals in Plumas Eureka is 94 days.
- Guests book furthest in advance for stays during July (average 146 days), likely coinciding with peak travel demand or local events.
- The shortest booking windows occur for stays in March (average 8 days), indicating more last-minute travel plans during this time.
- Seasonally, Summer (121 days avg.) sees the longest lead times, while Winter (36 days avg.) has the shortest, reflecting typical travel planning cycles.
Recommendations for Hosts
- Use the overall average lead time (94 days) as a baseline for your pricing and availability strategy in Plumas Eureka.
- For July stays, consider implementing length-of-stay discounts or slightly higher rates for bookings made less than 146 days out to capitalize on advance planning.
- During March, focus on last-minute booking availability and promotions, as guests book with very short notice (8 days avg.).
- Target marketing efforts for the Summer season well in advance (at least 121 days) to capture early planners.
- Monitor your own booking lead times against these Plumas Eureka averages to identify opportunities for dynamic pricing adjustments.
Popular & Essential Airbnb Amenities in Plumas Eureka (2025)
Amenity Prevalence
Amenity Insights for Plumas Eureka
- Essential amenities in Plumas Eureka that guests expect include: Smoke alarm, Wifi, Kitchen, Dryer, Washer. Lacking these (any) could significantly impact bookings.
- Popular amenities like BBQ grill, Coffee maker, TV are common but not universal. Offering these can provide a competitive edge.
Recommendations for Hosts
- Ensure your listing includes all essential amenities for Plumas Eureka: Smoke alarm, Wifi, Kitchen, Dryer, Washer.
- Consider adding popular differentiators like BBQ grill or Coffee maker to increase appeal.
- Highlight unique or less common amenities you offer (e.g., hot tub, dedicated workspace, EV charger) in your listing description and photos.
- Regularly check competitor amenities in Plumas Eureka to stay competitive.
Plumas Eureka Airbnb Guest Demographics & Profile Analysis (2025)
Guest Profile Summary for Plumas Eureka
- The typical guest profile for Airbnb in Plumas Eureka consists of primarily domestic travelers (99%), often arriving from nearby Reno, typically belonging to the Post-2000s (Gen Z/Alpha) group (50%), primarily speaking English or Spanish.
- Domestic travelers account for 98.7% of guests.
- Key international markets include United States (98.7%) and Japan (1.3%).
- Top languages spoken are English (82.1%) followed by Spanish (14.3%).
- A significant demographic segment is the Post-2000s (Gen Z/Alpha) group, representing 50% of guests.
Recommendations for Hosts
- Target domestic marketing efforts towards travelers from Reno and Sacramento.
- Tailor amenities and listing descriptions to appeal to the dominant Post-2000s (Gen Z/Alpha) demographic (e.g., highlight fast WiFi, smart home features, local guides).
- Highlight unique local experiences or amenities relevant to the primary guest profile.
- Consider seasonal promotions aligned with peak travel times for key origin markets.
Nearby Short-Term Rental Market Comparison
How does the Plumas Eureka Airbnb market stack up against its neighbors? Compare key performance metrics like average monthly revenue, ADR, and occupancy rates in surrounding areas to understand the broader regional STR landscape.
| Market | Active Properties | Monthly Revenue | Daily Rate | Avg. Occupancy |
|---|---|---|---|---|
| Glenbrook | 29 | $6,719 | $847.10 | 37% |
| Zephyr Cove | 186 | $6,651 | $656.39 | 38% |
| Meyers | 193 | $5,560 | $472.31 | 42% |
| Homewood | 151 | $5,491 | $582.90 | 38% |
| Carnelian Bay | 348 | $5,486 | $556.65 | 39% |
| Tahoma | 193 | $5,314 | $606.60 | 37% |
| Incline Village-Crystal Bay | 219 | $4,990 | $551.68 | 36% |
| Olympic Valley | 426 | $4,714 | $554.88 | 36% |
| Stateline | 32 | $4,677 | $532.34 | 42% |
| Tahoe Vista | 230 | $4,650 | $464.16 | 39% |