Pollock Pines Airbnb Market Analysis 2026: Short Term Rental Data & Vacation Rental Statistics in California, United States
Is Airbnb profitable in Pollock Pines in 2026? Explore comprehensive Airbnb analytics for Pollock Pines, California, United States to uncover income potential. This 2026 STR market report for Pollock Pines, based on AirROI data from February 2025 to January 2026, reveals key trends in the niche market of 67 active listings.
Whether you're considering an Airbnb investment in Pollock Pines, optimizing your existing vacation rental, or exploring rental arbitrage opportunities, understanding the Pollock Pines Airbnb data is crucial. Navigating the high regulation landscape is key to maximizing your short term rental income potential. Let's dive into the specifics.
Key Pollock Pines Airbnb Performance Metrics Overview
Monthly Airbnb Revenue Variations & Income Potential in Pollock Pines (2026)
Understanding the monthly revenue variations for Airbnb listings in Pollock Pines is key to maximizing your short term rental income potential. Seasonality significantly impacts earnings. Our analysis, based on data from the past 12 months, shows that the peak revenue month for STRs in Pollock Pines is typically July, while January often presents the lowest earnings, highlighting opportunities for strategic pricing adjustments during shoulder and low seasons. Explore the typical Airbnb income in Pollock Pines across different performance tiers:
- Best-in-class properties (Top 10%) achieve $7,188+ monthly, often utilizing dynamic pricing and superior guest experiences.
- Strong performing properties (Top 25%) earn $4,938 or more, indicating effective management and desirable locations/amenities.
- Typical properties (Median) generate around $2,940 per month, representing the average market performance.
- Entry-level properties (Bottom 25%) see earnings around $1,620, often with potential for optimization.
Average Monthly Airbnb Earnings Trend in Pollock Pines
Pollock Pines Airbnb Occupancy Rate Trends (2026)
Maximize your bookings by understanding the Pollock Pines STR occupancy trends. Seasonal demand shifts significantly influence how often properties are booked. Typically, Julysees the highest demand (peak season occupancy), while January experiences the lowest (low season). Effective strategies, like adjusting minimum stays or offering promotions, can boost occupancy during slower periods. Here's how different property tiers perform in Pollock Pines:
- Best-in-class properties (Top 10%) achieve 70%+ occupancy, indicating high desirability and potentially optimized availability.
- Strong performing properties (Top 25%) maintain 53% or higher occupancy, suggesting good market fit and guest satisfaction.
- Typical properties (Median) have an occupancy rate around 37%.
- Entry-level properties (Bottom 25%) average 24% occupancy, potentially facing higher vacancy.
Average Monthly Occupancy Rate Trend in Pollock Pines
Average Daily Rate (ADR) Airbnb Trends in Pollock Pines (2026)
Effective short term rental pricing strategy in Pollock Pines involves understanding monthly ADR fluctuations. The Average Daily Rate (ADR) for Airbnb in Pollock Pines typically peaks in December and dips lowest during February. Leveraging Airbnb dynamic pricing tools or strategies based on this seasonality can significantly boost revenue. Here's a look at the typical nightly rates achieved:
- Best-in-class properties (Top 10%) command rates of $450+ per night, often due to premium features or locations.
- Strong performing properties (Top 25%) achieve nightly rates of $318 or more.
- Typical properties (Median) charge around $245 per night.
- Entry-level properties (Bottom 25%) earn around $175 per night.
Average Daily Rate (ADR) Trend by Month in Pollock Pines
Get Live Pollock Pines Market Intelligence 👇

Explore Real-time Analytics
Airbnb Seasonality Analysis & Trends in Pollock Pines (2026)
Peak Season (July, October, August)
- Revenue averages $4,567 per month
- Occupancy rates average 47.2%
- Daily rates average $279
Shoulder Season
- Revenue averages $3,656 per month
- Occupancy maintains around 39.3%
- Daily rates hold near $282
Low Season (January, February, April)
- Revenue drops to average $2,733 per month
- Occupancy decreases to average 31.6%
- Daily rates adjust to average $268
Seasonality Insights for Pollock Pines
- The Airbnb seasonality in Pollock Pines shows moderate seasonality with distinct peak and low periods. While the sections above show seasonal averages, it's also insightful to look at the extremes:
- During the high season, the absolute peak month showcases Pollock Pines's highest earning potential, with monthly revenues capable of climbing to $4,897, occupancy reaching a high of 48.8%, and ADRs peaking at $295.
- Conversely, the slowest single month of the year, typically falling within the low season, marks the market's lowest point. In this month, revenue might dip to $2,727, occupancy could drop to 28.1%, and ADRs may adjust down to $251.
- Understanding both the seasonal averages and these monthly peaks and troughs in revenue, occupancy, and ADR is crucial for maximizing your Airbnb profit potential in Pollock Pines.
Seasonal Strategies for Maximizing Profit
- Peak Season: Maximize revenue through premium pricing and potentially longer minimum stays. Ensure high availability.
- Low Season: Offer competitive pricing, special promotions (e.g., extended stay discounts), and flexible cancellation policies. Target off-season travelers like remote workers or budget-conscious guests.
- Shoulder Seasons: Implement dynamic pricing that balances peak and low rates. Target weekend travelers or specific events. Offer slightly more flexible terms than peak season.
- Regularly analyze your own performance against these Pollock Pines seasonality benchmarks and adjust your pricing and availability strategy accordingly.
Best Areas for Airbnb Investment in Pollock Pines (2026)
Exploring the top neighborhoods for short-term rentals in Pollock Pines? This section highlights key areas, outlining why they are attractive for hosts and guests, along with notable local attractions. Consider these locations based on your target guest profile and investment strategy.
| Neighborhood / Area | Why Host Here? (Target Guests & Appeal) | Key Attractions & Landmarks |
|---|---|---|
| Lake Valley State Recreation Area | A beautiful natural retreat featuring a stunning lake and numerous outdoor activities. Perfect for nature enthusiasts and families looking to enjoy a peaceful getaway with access to hiking and water sports. | Lake Valley Reservoir, Hiking Trails, Fishing, Picnicking Areas, Scenic Views |
| Sly Park Recreation Area | A popular destination for camping and outdoor adventures, offering a range of recreational activities close to nature. Ideal for families and groups who love the outdoors. | Sly Park Lake, Camping, Hiking Trails, Fishing, Picnic Areas |
| Pollock Pines Historic District | Rich in history, this area offers a charming small-town atmosphere with local shops and eateries. Attracts visitors interested in the history and culture of the region. | Historic Sites, Local Artisans, Restaurants, Community Events, Antique Shops |
| El Dorado National Forest | A large national forest that offers year-round outdoor activities including hiking, mountain biking, skiing, and more. Perfect for adventurers and nature lovers. | Hiking Trails, Camping, Mountain Biking, Wildlife Viewing, Skiing in Winter |
| Adventure Mountain Lake Tahoe | A well-known winter sports destination offering skiing and snowboarding in the winter and mountain biking in the summer. Great for those looking to attract winter sports enthusiasts. | Skiing and Snowboarding, Mountain Biking, Scenic Views, Lodging Facilities, Outdoor Recreation |
| Silver Lake | A picturesque alpine lake providing opportunities for fishing, boating, and hiking. Ideal for visitors seeking a relaxing lakeside experience. | Fishing, Boating, Trails around the Lake, Picnic Areas, Scenic Views |
| Caples Lake | A serene lake setting that is perfect for summer picnics and winter activities like ice fishing. Attracts guests throughout the year for various activities. | Fishing, Boating, Snowshoeing, Hiking Trails, Camping |
| Historical Gold Rush Towns | Nearby historic towns like Placerville and Coloma known for their Gold Rush history, attract visitors interested in history and local culture. | Gold Bug Park, Historic Main Street, El Dorado County Historical Museum, Local Wineries, Farmers Markets |
Understanding Airbnb License Requirements & STR Laws in Pollock Pines (2026)
Yes, Pollock Pines, California, United States enforces high STR regulations. Obtaining a license and ensuring compliance is almost certainly required according to current 2026 STR laws. Always verify the latest short term rental regulations and Airbnb license requirements directly with local government authorities for Pollock Pines to ensure full compliance before hosting.
(Source: AirROI data, 2026, based on 36% licensed listings)
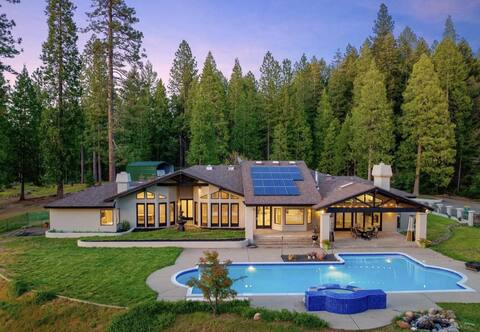
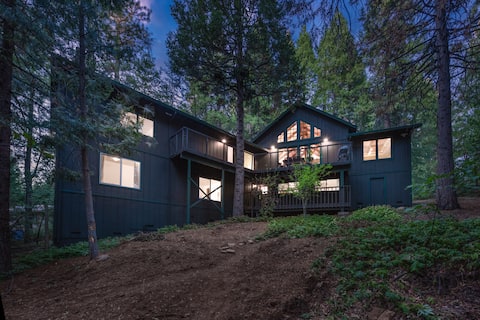
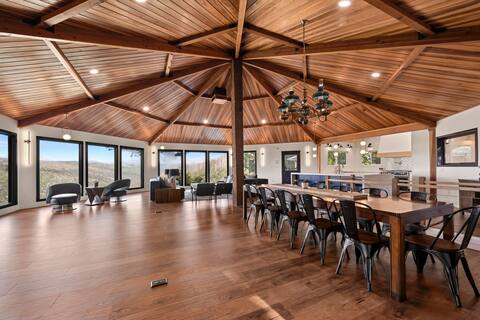
Top Performing Airbnb Properties in Pollock Pines (2026)
Benchmark your potential! Explore examples of top-performing Airbnb properties in Pollock Pinesbased on Trailing Twelve Month (TTM) revenue. Analyze their characteristics, revenue, occupancy rate, and ADR to understand what drives success in this market.

Cozy River Cabin/HOT TUB/Escape from the Bay
Entire Place • 1 bedroom
Holidays w/The Entire Family-On The Way To Tahoe
Entire Place • 5 bedrooms
Luxury Mountain Home | Families | Apple Hill
Entire Place • 5 bedrooms

Wicker Moose Manor: 3600 SqFt Multi-family Getaway
Entire Place • 5 bedrooms
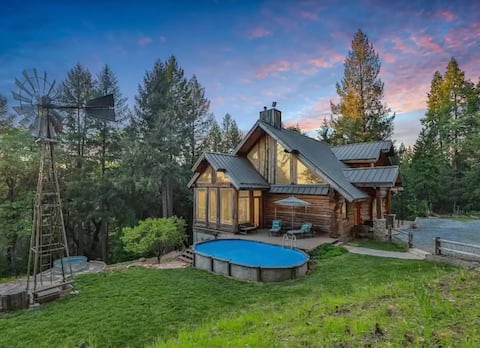
Lazy Bear Haven - Luxury Log Cabin Retreat
Entire Place • 5 bedrooms
Mountain Chalet with a majestic view
Entire Place • 7 bedrooms
Note: Performance varies based on location, size, amenities, seasonality, and management quality. Data reflects the past 12 months.
Top Performing Airbnb Hosts in Pollock Pines (2026)
Learn from the best! This table showcases top-performing Airbnb hosts in Pollock Pines based on the number of properties managed and estimated total revenue over the past year. Analyze their scale and performance metrics.
| Host Name | Properties | Grossing Revenue | Stay Reviews | Avg Rating |
|---|---|---|---|---|
| Evolve | 8 | $311,153 | 442 | 4.88/5.0 |
| Ryker | 4 | $192,410 | 157 | 4.85/5.0 |
| Kyle | 2 | $159,230 | 294 | 4.93/5.0 |
| Kathryn | 1 | $103,408 | 133 | 4.96/5.0 |
| Madison | 4 | $87,432 | 167 | 4.91/5.0 |
| Jackie | 1 | $82,624 | 110 | 4.89/5.0 |
| Lazy Bear Haven | 1 | $82,603 | 47 | 5.00/5.0 |
| Ellie | 1 | $81,262 | 36 | 4.83/5.0 |
| Dion | 1 | $75,042 | 204 | 4.94/5.0 |
| Nicholas | 2 | $74,427 | 213 | 4.88/5.0 |
Analyzing the strategies of top hosts, such as their property selection, pricing, and guest communication, can offer valuable lessons for optimizing your own Airbnb operations in Pollock Pines.
Dive Deeper: Advanced Pollock Pines STR Market Data (2026)
Ready to unlock more insights? AirROI provides access to advanced metrics and comprehensive Airbnb data for Pollock Pines. Explore detailed analytics beyond this report to refine your investment strategy, optimize pricing, and maximize your vacation rental profits.
Explore Advanced MetricsPollock Pines Short-Term Rental Market Composition (2026): Property & Room Types
Room Type Distribution
Property Type Distribution
Market Composition Insights for Pollock Pines
- The Pollock Pines Airbnb market composition is heavily skewed towards Entire Home/Apt listings, which make up 95.5% of the 67 active rentals. This indicates strong guest preference for privacy and space.
- Looking at the property type distribution in Pollock Pines, Outdoor/Unique properties are the most common (46.3%), reflecting the local real estate landscape.
- Houses represent a significant 46.3% portion, catering likely to families or larger groups.
- Smaller segments like apartment/condo, unique stays, others (combined 7.5%) offer potential for unique stay experiences.
Pollock Pines Airbnb Room Capacity Analysis (2026): Bedroom Distribution
Distribution of Listings by Number of Bedrooms
Room Capacity Insights for Pollock Pines
- The dominant room capacity in Pollock Pines is 3 bedrooms listings, making up 37.3% of the market. This suggests a strong demand for properties suitable for families or small groups.
- Together, 3 bedrooms and 2 bedrooms properties represent 70.1% of the active Airbnb listings in Pollock Pines, indicating a high concentration in these sizes.
- A significant 52.3% of listings offer 3+ bedrooms, catering to larger groups and families seeking more space in Pollock Pines.
Pollock Pines Vacation Rental Guest Capacity Trends (2026)
Distribution of Listings by Guest Capacity
Guest Capacity Insights for Pollock Pines
- The most common guest capacity trend in Pollock Pines vacation rentals is listings accommodating 6 guests (35.8%). This suggests the primary traveler segment is likely larger groups.
- Properties designed for 6 guests and 4 guests dominate the Pollock Pines STR market, accounting for 68.6% of listings.
- 52.2% of properties accommodate 6+ guests, serving the market segment for larger families or group travel in Pollock Pines.
- On average, properties in Pollock Pines are equipped to host 5.1 guests.
Pollock Pines Airbnb Booking Patterns (2026): Available vs. Booked Days
Available Days Distribution
Booked Days Distribution
Booking Pattern Insights for Pollock Pines
- The most common availability pattern in Pollock Pines falls within the 181-270 days range, representing 49.3% of listings. This suggests many properties have significant open periods on their calendars.
- Approximately 86.6% of listings show high availability (181+ days open annually), indicating potential for increased bookings or specific owner usage patterns.
- For booked days, the 91-180 days range is most frequent in Pollock Pines (49.3%), reflecting common guest stay durations or potential owner blocking patterns.
- A notable 14.9% of properties secure long booking periods (181+ days booked per year), highlighting successful long-term rental strategies or significant owner usage.
Pollock Pines Airbnb Minimum Stay Requirements Analysis
Distribution of Listings by Minimum Night Requirement
1 Night
9 listings
13.4% of total
2 Nights
30 listings
44.8% of total
3 Nights
2 listings
3% of total
4-6 Nights
2 listings
3% of total
7-29 Nights
7 listings
10.4% of total
30+ Nights
17 listings
25.4% of total
Key Insights
- The most prevalent minimum stay requirement in Pollock Pines is 2 Nights, adopted by 44.8% of listings. This highlights the market's preference for shorter, flexible bookings.
- A significant segment (25.4%) caters to monthly stays (30+ nights) in Pollock Pines, pointing to opportunities in the extended-stay market.
Recommendations
- Align with the market by considering a 2 Nights minimum stay, as 44.8% of Pollock Pines hosts use this setting.
- If feasible, allowing 1-night stays, especially midweek or during low season, could capture last-minute bookings, as only 13.4% currently do.
- A 2-night minimum appears standard (44.8%). Consider this for weekends or peak periods.
- Explore offering discounts for stays of 30+ nights to attract the 25.4% of the market seeking extended stays.
- Adjust minimum nights based on seasonality – potentially shorter during low season and longer during peak demand periods in Pollock Pines.
Pollock Pines Airbnb Cancellation Policy Trends Analysis (2026)
Limited
3 listings
4.5% of total
Flexible
10 listings
14.9% of total
Moderate
18 listings
26.9% of total
Firm
22 listings
32.8% of total
Strict
14 listings
20.9% of total
Cancellation Policy Insights for Pollock Pines
- The prevailing Airbnb cancellation policy trend in Pollock Pines is Firm, used by 32.8% of listings.
- A majority (53.7%) of hosts in Pollock Pines utilize Firm or Strict policies, indicating a market where hosts prioritize booking security.
Recommendations for Hosts
- Consider adopting a Firm policy to align with the 32.8% market standard in Pollock Pines.
- Regularly review your cancellation policy against competitors and market demand shifts in Pollock Pines.
Pollock Pines STR Booking Lead Time Analysis (2026)
Average Booking Lead Time by Month
Booking Lead Time Insights for Pollock Pines
- The overall average booking lead time for vacation rentals in Pollock Pines is 37 days.
- Guests book furthest in advance for stays during May (average 51 days), likely coinciding with peak travel demand or local events.
- The shortest booking windows occur for stays in March (average 22 days), indicating more last-minute travel plans during this time.
- Seasonally, Summer (44 days avg.) sees the longest lead times, while Winter (34 days avg.) has the shortest, reflecting typical travel planning cycles.
Recommendations for Hosts
- Use the overall average lead time (37 days) as a baseline for your pricing and availability strategy in Pollock Pines.
- For May stays, consider implementing length-of-stay discounts or slightly higher rates for bookings made less than 51 days out to capitalize on advance planning.
- Target marketing efforts for the Summer season well in advance (at least 44 days) to capture early planners.
- Monitor your own booking lead times against these Pollock Pines averages to identify opportunities for dynamic pricing adjustments.
Popular & Essential Airbnb Amenities in Pollock Pines (2026)
Amenity Prevalence
Amenity Insights for Pollock Pines
- Essential amenities in Pollock Pines that guests expect include: Smoke alarm, Free parking on premises, TV, Wifi, Dishes and silverware, Carbon monoxide alarm, Kitchen, Heating, Hot water, Refrigerator. Lacking these (any) could significantly impact bookings.
Recommendations for Hosts
- Ensure your listing includes all essential amenities for Pollock Pines: Smoke alarm, Free parking on premises, TV, Wifi, Dishes and silverware, Carbon monoxide alarm, Kitchen, Heating, Hot water, Refrigerator.
- Prioritize adding missing essentials: Dishes and silverware, Carbon monoxide alarm, Kitchen, Heating, Hot water, Refrigerator.
- Highlight unique or less common amenities you offer (e.g., hot tub, dedicated workspace, EV charger) in your listing description and photos.
- Regularly check competitor amenities in Pollock Pines to stay competitive.
Pollock Pines Airbnb Guest Demographics & Profile Analysis (2026)
Guest Profile Summary for Pollock Pines
- The typical guest profile for Airbnb in Pollock Pines consists of primarily domestic travelers (98%), often arriving from nearby San Francisco, typically belonging to the Post-2000s (Gen Z/Alpha) group (50%), primarily speaking English or Spanish.
- Domestic travelers account for 97.8% of guests.
- Key international markets include United States (97.8%) and Canada (0.5%).
- Top languages spoken are English (65.6%) followed by Spanish (15.3%).
- A significant demographic segment is the Post-2000s (Gen Z/Alpha) group, representing 50% of guests.
Recommendations for Hosts
- Target domestic marketing efforts towards travelers from San Francisco and San Jose.
- Tailor amenities and listing descriptions to appeal to the dominant Post-2000s (Gen Z/Alpha) demographic (e.g., highlight fast WiFi, smart home features, local guides).
- Highlight unique local experiences or amenities relevant to the primary guest profile.
- Consider seasonal promotions aligned with peak travel times for key origin markets.
Nearby Short-Term Rental Market Comparison
How does the Pollock Pines Airbnb market stack up against its neighbors? Compare key performance metrics like average monthly revenue, ADR, and occupancy rates in surrounding areas to understand the broader regional STR landscape.
| Market | Active Properties | Monthly Revenue | Daily Rate | Avg. Occupancy |
|---|---|---|---|---|
| Wawona | 66 | $7,186 | $548.44 | 45% |
| Yosemite National Park | 227 | $6,835 | $511.03 | 44% |
| Zephyr Cove | 192 | $6,404 | $642.42 | 37% |
| Homewood | 150 | $5,842 | $595.57 | 40% |
| Meyers | 177 | $5,840 | $500.97 | 43% |
| Glenbrook | 32 | $5,788 | $841.74 | 35% |
| Yosemite West | 29 | $5,597 | $423.79 | 49% |
| Carnelian Bay | 349 | $5,362 | $561.69 | 39% |
| Incline Village-Crystal Bay | 204 | $5,197 | $589.54 | 35% |
| Tahoma | 199 | $5,011 | $605.47 | 36% |