Rodeo Airbnb Market Analysis 2025: Short Term Rental Data & Vacation Rental Statistics in California, United States
Is Airbnb profitable in Rodeo in 2025? Explore comprehensive Airbnb analytics for Rodeo, California, United States to uncover income potential. This 2025 STR market report for Rodeo, based on AirROI data from April 2024 to March 2025, reveals key trends in the niche market of 19 active listings.
Whether you're considering an Airbnb investment in Rodeo, optimizing your existing vacation rental, or exploring rental arbitrage opportunities, understanding the Rodeo Airbnb data is crucial. Leveraging the low regulation environment is key to maximizing your short term rental income potential. Let's dive into the specifics.
Key Rodeo Airbnb Performance Metrics Overview
Monthly Airbnb Revenue Variations & Income Potential in Rodeo (2025)
Understanding the monthly revenue variations for Airbnb listings in Rodeo is key to maximizing your short term rental income potential. Seasonality significantly impacts earnings. Our analysis, based on data from the past 12 months, shows that the peak revenue month for STRs in Rodeo is typically May, while February often presents the lowest earnings, highlighting opportunities for strategic pricing adjustments during shoulder and low seasons. Explore the typical Airbnb income in Rodeo across different performance tiers:
- Best-in-class properties (Top 10%) achieve $6,858+ monthly, often utilizing dynamic pricing and superior guest experiences.
- Strong performing properties (Top 25%) earn $4,494 or more, indicating effective management and desirable locations/amenities.
- Typical properties (Median) generate around $1,855 per month, representing the average market performance.
- Entry-level properties (Bottom 25%) see earnings around $906, often with potential for optimization.
Average Monthly Airbnb Earnings Trend in Rodeo
Rodeo Airbnb Occupancy Rate Trends (2025)
Maximize your bookings by understanding the Rodeo STR occupancy trends. Seasonal demand shifts significantly influence how often properties are booked. Typically, Maysees the highest demand (peak season occupancy), while March experiences the lowest (low season). Effective strategies, like adjusting minimum stays or offering promotions, can boost occupancy during slower periods. Here's how different property tiers perform in Rodeo:
- Best-in-class properties (Top 10%) achieve 78%+ occupancy, indicating high desirability and potentially optimized availability.
- Strong performing properties (Top 25%) maintain 59% or higher occupancy, suggesting good market fit and guest satisfaction.
- Typical properties (Median) have an occupancy rate around 40%.
- Entry-level properties (Bottom 25%) average 21% occupancy, potentially facing higher vacancy.
Average Monthly Occupancy Rate Trend in Rodeo
Average Daily Rate (ADR) Airbnb Trends in Rodeo (2025)
Effective short term rental pricing strategy in Rodeo involves understanding monthly ADR fluctuations. The Average Daily Rate (ADR) for Airbnb in Rodeo typically peaks in May and dips lowest during December. Leveraging Airbnb dynamic pricing tools or strategies based on this seasonality can significantly boost revenue. Here's a look at the typical nightly rates achieved:
- Best-in-class properties (Top 10%) command rates of $367+ per night, often due to premium features or locations.
- Strong performing properties (Top 25%) achieve nightly rates of $247 or more.
- Typical properties (Median) charge around $157 per night.
- Entry-level properties (Bottom 25%) earn around $73 per night.
Average Daily Rate (ADR) Trend by Month in Rodeo
Get Live Rodeo Market Intelligence 👇

Explore Real-time Analytics
Airbnb Seasonality Analysis & Trends in Rodeo (2025)
Peak Season (May, April, June)
- Revenue averages $5,026 per month
- Occupancy rates average 52.7%
- Daily rates average $191
Shoulder Season
- Revenue averages $2,650 per month
- Occupancy maintains around 43.7%
- Daily rates hold near $176
Low Season (January, February, March)
- Revenue drops to average $1,543 per month
- Occupancy decreases to average 33.2%
- Daily rates adjust to average $173
Seasonality Insights for Rodeo
- The Airbnb seasonality in Rodeo shows highly seasonal trends requiring careful strategy. While the sections above show seasonal averages, it's also insightful to look at the extremes:
- During the high season, the absolute peak month showcases Rodeo's highest earning potential, with monthly revenues capable of climbing to $5,378, occupancy reaching a high of 57.7%, and ADRs peaking at $195.
- Conversely, the slowest single month of the year, typically falling within the low season, marks the market's lowest point. In this month, revenue might dip to $1,255, occupancy could drop to 25.1%, and ADRs may adjust down to $158.
- Understanding both the seasonal averages and these monthly peaks and troughs in revenue, occupancy, and ADR is crucial for maximizing your Airbnb profit potential in Rodeo.
Seasonal Strategies for Maximizing Profit
- Peak Season: Maximize revenue through premium pricing and potentially longer minimum stays. Ensure high availability.
- Low Season: Offer competitive pricing, special promotions (e.g., extended stay discounts), and flexible cancellation policies. Target off-season travelers like remote workers or budget-conscious guests.
- Shoulder Seasons: Implement dynamic pricing that balances peak and low rates. Target weekend travelers or specific events. Offer slightly more flexible terms than peak season.
- Regularly analyze your own performance against these Rodeo seasonality benchmarks and adjust your pricing and availability strategy accordingly.
Best Areas for Airbnb Investment in Rodeo (2025)
Exploring the top neighborhoods for short-term rentals in Rodeo? This section highlights key areas, outlining why they are attractive for hosts and guests, along with notable local attractions. Consider these locations based on your target guest profile and investment strategy.
| Neighborhood / Area | Why Host Here? (Target Guests & Appeal) | Key Attractions & Landmarks |
|---|---|---|
| Rodeo Bay | Beautiful waterfront area popular for its scenic views and recreational activities. Great for guests looking for outdoor experiences and relaxation by the water. | Rodeo Beach, Marin Headlands, Golden Gate National Park, Point Reyes National Seashore, Muir Woods National Monument |
| Rodeo Historic District | Charming historic area with preserved architecture and a rich history. Ideal for guests interested in the cultural aspects of Rodeo. | Rodeo Theater, Old Town Hall, Local museums, Cultural festivals |
| Nearby Vallejo | Just a short drive away, Vallejo offers a variety of attractions and amenities. Attracts visitors seeking more urban experiences. | Six Flags Discovery Kingdom, Vallejo Ferry to San Francisco, California Maritime Academy, Downtown Vallejo restaurants |
| Rodeo Community Park | Family-friendly area with parks and recreational facilities, perfect for families with children visiting the region. | Rodeo Community Park, Walking trails, Picnic areas, Playgrounds |
| Crockett | Nearby town with a small-town charm and access to nature. Great for Airbnb hosting due to its community feel and friendly atmosphere. | Crockett Hills Regional Park, Crockett Waterfront, Historic Main Street, Outdoor trails |
| Port Costa | Quaint village offering rustic charm and unique spots for relaxation. Ideal for guests looking for a quiet getaway. | Port Costa's Historic District, Eating at the Warehouse Café, Nature walks along the waterfront |
| Brentwood | Growing suburban area with family-friendly amenities and parks. Attractive for longer-term stays and families. | Brentwood Farmers' Market, Parks and recreational areas, Local vineyards |
| Martinez | Historic downtown with artistic vibes and access to the Carquinez Strait. Draws many visitors for its history and beauty. | Martinez Historic District, John Muir National Historic Site, Downtown shops and eateries |
Understanding Airbnb License Requirements & STR Laws in Rodeo (2025)
While Rodeo, California, United States currently shows low STR regulations, specific Airbnb license requirements might still exist or change. Always verify the latest short term rental regulations and Airbnb license requirements directly with local government authorities for Rodeo to ensure full compliance before hosting.
(Source: AirROI data, 2025, finding no licensed listings among those analyzed)
Top Performing Airbnb Properties in Rodeo (2025)
Benchmark your potential! Explore examples of top-performing Airbnb properties in Rodeobased on Trailing Twelve Month (TTM) revenue. Analyze their characteristics, revenue, occupancy rate, and ADR to understand what drives success in this market.
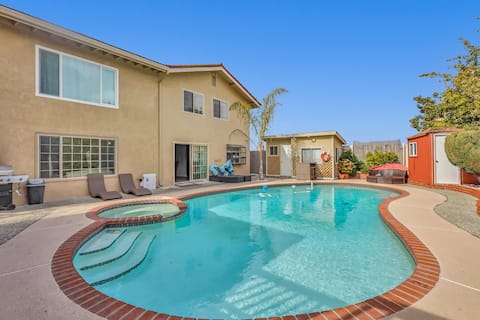
Home Away From Home w/Big Pool and Hot Tub
Entire Place • 4 bedrooms

Vacation home with big pool &Tub
Entire Place • 4 bedrooms
SF Bay view winery trails redwood trees hot tub
Entire Place • 5 bedrooms
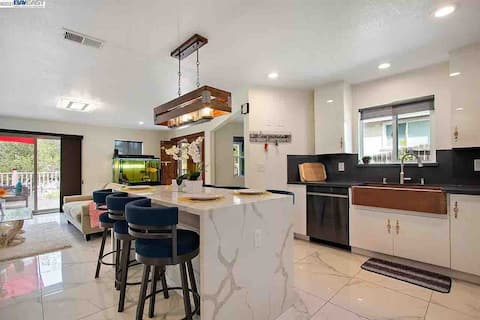
NEW Modern & Serene 4BD/2BA Home
Entire Place • 4 bedrooms
Luxury Modern Home near UC Berkeley with Swim Spa
Entire Place • 4 bedrooms
Modern Clean Studio
Entire Place • N/A
Note: Performance varies based on location, size, amenities, seasonality, and management quality. Data reflects the past 12 months.
Top Performing Airbnb Hosts in Rodeo (2025)
Learn from the best! This table showcases top-performing Airbnb hosts in Rodeo based on the number of properties managed and estimated total revenue over the past year. Analyze their scale and performance metrics.
| Host Name | Properties | Grossing Revenue | Stay Reviews | Avg Rating |
|---|---|---|---|---|
| Rids | 2 | $107,215 | 106 | 4.59/5.0 |
| Host #496661808 | 1 | $74,791 | 6 | 5.00/5.0 |
| Spencer | 1 | $52,836 | 111 | 4.89/5.0 |
| Wendy | 2 | $51,180 | 24 | 4.87/5.0 |
| Jason | 3 | $33,175 | 89 | 4.73/5.0 |
| Anna | 1 | $19,891 | 80 | 4.89/5.0 |
| Host #82157255 | 1 | $16,647 | 73 | 4.93/5.0 |
| Noah | 1 | $14,735 | 8 | 4.88/5.0 |
| Host #38482597 | 1 | $12,589 | 0 | 0.00/5.0 |
| Luna | 1 | $10,223 | 56 | 4.80/5.0 |
Analyzing the strategies of top hosts, such as their property selection, pricing, and guest communication, can offer valuable lessons for optimizing your own Airbnb operations in Rodeo.
Dive Deeper: Advanced Rodeo STR Market Data (2025)
Ready to unlock more insights? AirROI provides access to advanced metrics and comprehensive Airbnb data for Rodeo. Explore detailed analytics beyond this report to refine your investment strategy, optimize pricing, and maximize your vacation rental profits.
Explore Advanced MetricsRodeo Short-Term Rental Market Composition (2025): Property & Room Types
Room Type Distribution
Property Type Distribution
Market Composition Insights for Rodeo
- The Rodeo Airbnb market composition is heavily skewed towards Entire Home/Apt listings, which make up 78.9% of the 19 active rentals. This indicates strong guest preference for privacy and space.
- Looking at the property type distribution in Rodeo, House properties are the most common (57.9%), reflecting the local real estate landscape.
- Houses represent a significant 57.9% portion, catering likely to families or larger groups.
- The presence of 21.1% Hotel/Boutique listings indicates integration with traditional hospitality.
Rodeo Airbnb Room Capacity Analysis (2025): Bedroom Distribution
Distribution of Listings by Number of Bedrooms
Room Capacity Insights for Rodeo
- The dominant room capacity in Rodeo is 1 bedroom listings, making up 26.3% of the market. This suggests a strong demand for properties suitable for couples or solo travelers.
- Together, 1 bedroom and 4 bedrooms properties represent 47.4% of the active Airbnb listings in Rodeo, indicating a high concentration in these sizes.
- A significant 26.4% of listings offer 3+ bedrooms, catering to larger groups and families seeking more space in Rodeo.
Rodeo Vacation Rental Guest Capacity Trends (2025)
Distribution of Listings by Guest Capacity
Guest Capacity Insights for Rodeo
- The most common guest capacity trend in Rodeo vacation rentals is listings accommodating 2 guests (42.1%). This suggests the primary traveler segment is likely couples or solo travelers.
- Properties designed for 2 guests and 8+ guests dominate the Rodeo STR market, accounting for 68.4% of listings.
- A significant 42.1% of listings cater specifically to 1-2 guests, highlighting strong demand from couples and solo travelers in Rodeo.
- 36.8% of properties accommodate 6+ guests, serving the market segment for larger families or group travel in Rodeo.
- On average, properties in Rodeo are equipped to host 4.2 guests.
Rodeo Airbnb Booking Patterns (2025): Available vs. Booked Days
Available Days Distribution
Booked Days Distribution
Booking Pattern Insights for Rodeo
- The most common availability pattern in Rodeo falls within the 271-366 days range, representing 52.6% of listings. This suggests many properties have significant open periods on their calendars.
- Approximately 84.2% of listings show high availability (181+ days open annually), indicating potential for increased bookings or specific owner usage patterns.
- For booked days, the 31-90 days range is most frequent in Rodeo (42.1%), reflecting common guest stay durations or potential owner blocking patterns.
- A notable 15.8% of properties secure long booking periods (181+ days booked per year), highlighting successful long-term rental strategies or significant owner usage.
Rodeo Airbnb Minimum Stay Requirements Analysis
Distribution of Listings by Minimum Night Requirement
1 Night
6 listings
33.3% of total
2 Nights
1 listings
5.6% of total
3 Nights
6 listings
33.3% of total
7-29 Nights
1 listings
5.6% of total
30+ Nights
4 listings
22.2% of total
Key Insights
- The most prevalent minimum stay requirement in Rodeo is 1 Night, adopted by 33.3% of listings. This highlights the market's preference for shorter, flexible bookings.
- A significant segment (22.2%) caters to monthly stays (30+ nights) in Rodeo, pointing to opportunities in the extended-stay market.
Recommendations
- Align with the market by considering a 1 Night minimum stay, as 33.3% of Rodeo hosts use this setting.
- Explore offering discounts for stays of 30+ nights to attract the 22.2% of the market seeking extended stays.
- Adjust minimum nights based on seasonality – potentially shorter during low season and longer during peak demand periods in Rodeo.
Rodeo Airbnb Cancellation Policy Trends Analysis (2025)
Flexible
3 listings
23.1% of total
Moderate
1 listings
7.7% of total
Firm
2 listings
15.4% of total
Strict
7 listings
53.8% of total
Cancellation Policy Insights for Rodeo
- The prevailing Airbnb cancellation policy trend in Rodeo is Strict, used by 53.8% of listings.
- A majority (69.2%) of hosts in Rodeo utilize Firm or Strict policies, indicating a market where hosts prioritize booking security.
Recommendations for Hosts
- Consider adopting a Strict policy to align with the 53.8% market standard in Rodeo.
- With 53.8% using Strict terms, this is a viable option in Rodeo, particularly for high-value properties or during peak demand periods.
- Regularly review your cancellation policy against competitors and market demand shifts in Rodeo.
Rodeo STR Booking Lead Time Analysis (2025)
Average Booking Lead Time by Month
Booking Lead Time Insights for Rodeo
- The overall average booking lead time for vacation rentals in Rodeo is 29 days.
- Guests book furthest in advance for stays during January (average 67 days), likely coinciding with peak travel demand or local events.
- The shortest booking windows occur for stays in April (average 15 days), indicating more last-minute travel plans during this time.
- Seasonally, Winter (43 days avg.) sees the longest lead times, while Summer (29 days avg.) has the shortest, reflecting typical travel planning cycles.
Recommendations for Hosts
- Use the overall average lead time (29 days) as a baseline for your pricing and availability strategy in Rodeo.
- For January stays, consider implementing length-of-stay discounts or slightly higher rates for bookings made less than 67 days out to capitalize on advance planning.
- Target marketing efforts for the Winter season well in advance (at least 43 days) to capture early planners.
- Monitor your own booking lead times against these Rodeo averages to identify opportunities for dynamic pricing adjustments.
Popular & Essential Airbnb Amenities in Rodeo (2025)
Amenity Prevalence
Amenity Insights for Rodeo
- Essential amenities in Rodeo that guests expect include: Smoke alarm, Wifi, Essentials, Hot water, TV. Lacking these (any) could significantly impact bookings.
- Popular amenities like Heating, Free parking on premises, Carbon monoxide alarm are common but not universal. Offering these can provide a competitive edge.
Recommendations for Hosts
- Ensure your listing includes all essential amenities for Rodeo: Smoke alarm, Wifi, Essentials, Hot water, TV.
- Consider adding popular differentiators like Heating or Free parking on premises to increase appeal.
- Highlight unique or less common amenities you offer (e.g., hot tub, dedicated workspace, EV charger) in your listing description and photos.
- Regularly check competitor amenities in Rodeo to stay competitive.
Rodeo Airbnb Guest Demographics & Profile Analysis (2025)
Guest Profile Summary for Rodeo
- The typical guest profile for Airbnb in Rodeo consists of primarily domestic travelers (90%), often arriving from nearby Los Angeles, typically belonging to the Post-2000s (Gen Z/Alpha) group (50%), primarily speaking English or Spanish.
- Domestic travelers account for 90.4% of guests.
- Key international markets include United States (90.4%) and Switzerland (2.2%).
- Top languages spoken are English (63.5%) followed by Spanish (14.8%).
- A significant demographic segment is the Post-2000s (Gen Z/Alpha) group, representing 50% of guests.
Recommendations for Hosts
- Target domestic marketing efforts towards travelers from Los Angeles and Martinez.
- Tailor amenities and listing descriptions to appeal to the dominant Post-2000s (Gen Z/Alpha) demographic (e.g., highlight fast WiFi, smart home features, local guides).
- Highlight unique local experiences or amenities relevant to the primary guest profile.
- Consider seasonal promotions aligned with peak travel times for key origin markets.
Nearby Short-Term Rental Market Comparison
How does the Rodeo Airbnb market stack up against its neighbors? Compare key performance metrics like average monthly revenue, ADR, and occupancy rates in surrounding areas to understand the broader regional STR landscape.
| Market | Active Properties | Monthly Revenue | Daily Rate | Avg. Occupancy |
|---|---|---|---|---|
| Sonoma | 226 | $9,573 | $786.40 | 45% |
| Eldridge | 18 | $9,143 | $844.84 | 41% |
| Moss Beach | 33 | $9,049 | $627.14 | 54% |
| Glen Ellen | 78 | $8,497 | $722.05 | 43% |
| Kenwood | 56 | $8,325 | $764.83 | 40% |
| Dillon Beach | 78 | $8,269 | $654.37 | 43% |
| Marshall | 19 | $7,772 | $541.79 | 51% |
| St. Helena | 43 | $7,403 | $779.73 | 38% |
| Stinson Beach | 91 | $6,976 | $683.22 | 46% |
| Montara | 24 | $6,855 | $425.39 | 53% |