Sanger Airbnb Market Analysis 2026: Short Term Rental Data & Vacation Rental Statistics in California, United States
Is Airbnb profitable in Sanger in 2026? Explore comprehensive Airbnb analytics for Sanger, California, United States to uncover income potential. This 2026 STR market report for Sanger, based on AirROI data from February 2025 to January 2026, reveals key trends in the niche market of 19 active listings.
Whether you're considering an Airbnb investment in Sanger, optimizing your existing vacation rental, or exploring rental arbitrage opportunities, understanding the Sanger Airbnb data is crucial. Leveraging the low regulation environment is key to maximizing your short term rental income potential. Let's dive into the specifics.
Key Sanger Airbnb Performance Metrics Overview
Monthly Airbnb Revenue Variations & Income Potential in Sanger (2026)
Understanding the monthly revenue variations for Airbnb listings in Sanger is key to maximizing your short term rental income potential. Seasonality significantly impacts earnings. Our analysis, based on data from the past 12 months, shows that the peak revenue month for STRs in Sanger is typically May, while January often presents the lowest earnings, highlighting opportunities for strategic pricing adjustments during shoulder and low seasons. Explore the typical Airbnb income in Sanger across different performance tiers:
- Best-in-class properties (Top 10%) achieve $5,680+ monthly, often utilizing dynamic pricing and superior guest experiences.
- Strong performing properties (Top 25%) earn $3,457 or more, indicating effective management and desirable locations/amenities.
- Typical properties (Median) generate around $2,191 per month, representing the average market performance.
- Entry-level properties (Bottom 25%) see earnings around $1,195, often with potential for optimization.
Average Monthly Airbnb Earnings Trend in Sanger
Sanger Airbnb Occupancy Rate Trends (2026)
Maximize your bookings by understanding the Sanger STR occupancy trends. Seasonal demand shifts significantly influence how often properties are booked. Typically, Maysees the highest demand (peak season occupancy), while December experiences the lowest (low season). Effective strategies, like adjusting minimum stays or offering promotions, can boost occupancy during slower periods. Here's how different property tiers perform in Sanger:
- Best-in-class properties (Top 10%) achieve 73%+ occupancy, indicating high desirability and potentially optimized availability.
- Strong performing properties (Top 25%) maintain 53% or higher occupancy, suggesting good market fit and guest satisfaction.
- Typical properties (Median) have an occupancy rate around 34%.
- Entry-level properties (Bottom 25%) average 17% occupancy, potentially facing higher vacancy.
Average Monthly Occupancy Rate Trend in Sanger
Average Daily Rate (ADR) Airbnb Trends in Sanger (2026)
Effective short term rental pricing strategy in Sanger involves understanding monthly ADR fluctuations. The Average Daily Rate (ADR) for Airbnb in Sanger typically peaks in September and dips lowest during January. Leveraging Airbnb dynamic pricing tools or strategies based on this seasonality can significantly boost revenue. Here's a look at the typical nightly rates achieved:
- Best-in-class properties (Top 10%) command rates of $645+ per night, often due to premium features or locations.
- Strong performing properties (Top 25%) achieve nightly rates of $289 or more.
- Typical properties (Median) charge around $165 per night.
- Entry-level properties (Bottom 25%) earn around $120 per night.
Average Daily Rate (ADR) Trend by Month in Sanger
Get Live Sanger Market Intelligence 👇

Explore Real-time Analytics
Airbnb Seasonality Analysis & Trends in Sanger (2026)
Peak Season (May, July, April)
- Revenue averages $3,475 per month
- Occupancy rates average 42.9%
- Daily rates average $277
Shoulder Season
- Revenue averages $2,695 per month
- Occupancy maintains around 38.5%
- Daily rates hold near $265
Low Season (January, February, December)
- Revenue drops to average $1,563 per month
- Occupancy decreases to average 26.9%
- Daily rates adjust to average $237
Seasonality Insights for Sanger
- The Airbnb seasonality in Sanger shows highly seasonal trends requiring careful strategy. While the sections above show seasonal averages, it's also insightful to look at the extremes:
- During the high season, the absolute peak month showcases Sanger's highest earning potential, with monthly revenues capable of climbing to $3,728, occupancy reaching a high of 48.4%, and ADRs peaking at $298.
- Conversely, the slowest single month of the year, typically falling within the low season, marks the market's lowest point. In this month, revenue might dip to $1,063, occupancy could drop to 23.0%, and ADRs may adjust down to $227.
- Understanding both the seasonal averages and these monthly peaks and troughs in revenue, occupancy, and ADR is crucial for maximizing your Airbnb profit potential in Sanger.
Seasonal Strategies for Maximizing Profit
- Peak Season: Maximize revenue through premium pricing and potentially longer minimum stays. Ensure high availability.
- Low Season: Offer competitive pricing, special promotions (e.g., extended stay discounts), and flexible cancellation policies. Target off-season travelers like remote workers or budget-conscious guests.
- Shoulder Seasons: Implement dynamic pricing that balances peak and low rates. Target weekend travelers or specific events. Offer slightly more flexible terms than peak season.
- Regularly analyze your own performance against these Sanger seasonality benchmarks and adjust your pricing and availability strategy accordingly.
Best Areas for Airbnb Investment in Sanger (2026)
Exploring the top neighborhoods for short-term rentals in Sanger? This section highlights key areas, outlining why they are attractive for hosts and guests, along with notable local attractions. Consider these locations based on your target guest profile and investment strategy.
| Neighborhood / Area | Why Host Here? (Target Guests & Appeal) | Key Attractions & Landmarks |
|---|---|---|
| Sanger Valley | Sanger Valley offers a serene environment with beautiful landscapes and outdoor activities. It's perfect for travelers seeking a peaceful retreat while being close to nature. | Kings Canyon National Park, Sierra National Forest, Hume Lake, Woodward Park, Roeding Park |
| Downtown Sanger | The downtown area is a historic district with charming shops and restaurants. It attracts visitors looking for local culture and events, making it a viable place for short-term rentals. | Sanger Depot, Sanger Historical Society, local coffee shops, community parks, farmer's market |
| Cultural District | This area features a mix of cultural experiences and local art, attracting visitors who appreciate community events and art exhibitions throughout the year. | local art galleries, Cultural Arts Center, music festivals, food festivals, community events |
| Sanger Community Park | A family-friendly area with parks and recreational facilities, making it an ideal spot for families vacationing in the region. | Sanger Community Park, playgrounds, sports facilities, picnic areas, walking trails |
| Nearby Fresno | Fresno's proximity to Sanger makes it an attractive option for those visiting the region. Its urban amenities attract travelers looking for convenience and services. | Fresno Chaffee Zoo, Forestiere Underground Gardens, Fashion Fair Mall, Woodward Park, Fresno Art Museum |
| Sierra Foothills | Ideal for travelers interested in wine country and mountain experiences, the Sierra Foothills offer a unique blend of outdoor adventure and relaxation. | wine tasting tours, hiking trails, local wineries, scenic drives, fishing spots |
| Madera Ranchos | This area is popular for its rural charm and proximity to outdoor activities, appealing to those who want a more laid-back vacation experience. | local farms, nature trails, horseback riding, outdoor markets, Sierra Nevada Mountains |
| Clovis | Clovis is a nearby city offering a blend of small-town charm and urban amenities making it a great alternative for visitors wanting to explore the region. | Old Town Clovis, Clovis Botanical Garden, Clovis Rodeo, local eateries, vintage shops |
Understanding Airbnb License Requirements & STR Laws in Sanger (2026)
While Sanger, California, United States currently shows low STR regulations, specific Airbnb license requirements might still exist or change. Always verify the latest short term rental regulations and Airbnb license requirements directly with local government authorities for Sanger to ensure full compliance before hosting.
(Source: AirROI data, 2026, finding no licensed listings among those analyzed)
Top Performing Airbnb Properties in Sanger (2026)
Benchmark your potential! Explore examples of top-performing Airbnb properties in Sangerbased on Trailing Twelve Month (TTM) revenue. Analyze their characteristics, revenue, occupancy rate, and ADR to understand what drives success in this market.

Nat’l Park Base | Cozy Home + Fire Pit
Entire Place • 2 bedrooms

Hobbit House at Collins Creek
Entire Place • 3 bedrooms

Gateway Getaway
Entire Place • 5 bedrooms
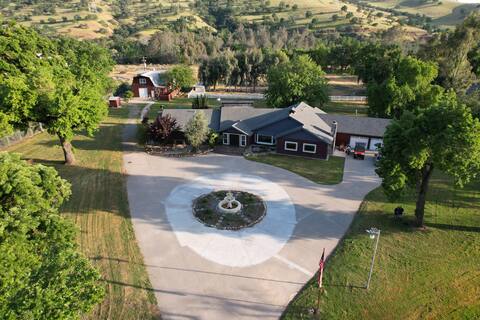
The Kings River Ranch House
Entire Place • 5 bedrooms

Hillside Tiny Home
Entire Place • 2 bedrooms
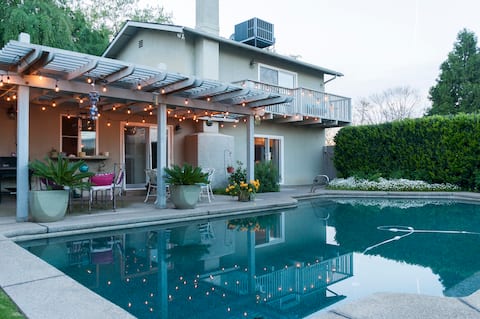
Two story guest house with pool
Entire Place • 1 bedroom
Note: Performance varies based on location, size, amenities, seasonality, and management quality. Data reflects the past 12 months.
Top Performing Airbnb Hosts in Sanger (2026)
Learn from the best! This table showcases top-performing Airbnb hosts in Sanger based on the number of properties managed and estimated total revenue over the past year. Analyze their scale and performance metrics.
| Host Name | Properties | Grossing Revenue | Stay Reviews | Avg Rating |
|---|---|---|---|---|
| Yvonne | 1 | $63,357 | 104 | 5.00/5.0 |
| Poew | 2 | $57,866 | 116 | 4.67/5.0 |
| Kaci | 1 | $57,629 | 51 | 4.96/5.0 |
| Ananda Simone Aspen | 2 | $55,776 | 731 | 4.90/5.0 |
| Leo | 1 | $50,853 | 25 | 4.92/5.0 |
| William | 1 | $44,391 | 16 | 5.00/5.0 |
| John | 3 | $41,629 | 271 | 4.93/5.0 |
| Brent | 1 | $35,859 | 40 | 5.00/5.0 |
| Rudy | 1 | $22,265 | 123 | 4.88/5.0 |
| Heather | 1 | $22,008 | 4 | 4.75/5.0 |
Analyzing the strategies of top hosts, such as their property selection, pricing, and guest communication, can offer valuable lessons for optimizing your own Airbnb operations in Sanger.
Dive Deeper: Advanced Sanger STR Market Data (2026)
Ready to unlock more insights? AirROI provides access to advanced metrics and comprehensive Airbnb data for Sanger. Explore detailed analytics beyond this report to refine your investment strategy, optimize pricing, and maximize your vacation rental profits.
Explore Advanced MetricsSanger Short-Term Rental Market Composition (2026): Property & Room Types
Room Type Distribution
Property Type Distribution
Market Composition Insights for Sanger
- The Sanger Airbnb market composition is heavily skewed towards Entire Home/Apt listings, which make up 94.7% of the 19 active rentals. This indicates strong guest preference for privacy and space.
- Looking at the property type distribution in Sanger, House properties are the most common (78.9%), reflecting the local real estate landscape.
- Houses represent a significant 78.9% portion, catering likely to families or larger groups.
Sanger Airbnb Room Capacity Analysis (2026): Bedroom Distribution
Distribution of Listings by Number of Bedrooms
Room Capacity Insights for Sanger
- The dominant room capacity in Sanger is 3 bedrooms listings, making up 36.8% of the market. This suggests a strong demand for properties suitable for families or small groups.
- Together, 3 bedrooms and 1 bedroom properties represent 63.1% of the active Airbnb listings in Sanger, indicating a high concentration in these sizes.
- A significant 57.9% of listings offer 3+ bedrooms, catering to larger groups and families seeking more space in Sanger.
Sanger Vacation Rental Guest Capacity Trends (2026)
Distribution of Listings by Guest Capacity
Guest Capacity Insights for Sanger
- The most common guest capacity trend in Sanger vacation rentals is listings accommodating 8+ guests (52.6%). This suggests the primary traveler segment is likely larger groups.
- Properties designed for 8+ guests and 2 guests dominate the Sanger STR market, accounting for 68.4% of listings.
- 57.9% of properties accommodate 6+ guests, serving the market segment for larger families or group travel in Sanger.
- On average, properties in Sanger are equipped to host 5.9 guests.
Sanger Airbnb Booking Patterns (2026): Available vs. Booked Days
Available Days Distribution
Booked Days Distribution
Booking Pattern Insights for Sanger
- The most common availability pattern in Sanger falls within the 271-366 days range, representing 42.1% of listings. This suggests many properties have significant open periods on their calendars.
- Approximately 78.9% of listings show high availability (181+ days open annually), indicating potential for increased bookings or specific owner usage patterns.
- For booked days, the 31-90 days range is most frequent in Sanger (31.6%), reflecting common guest stay durations or potential owner blocking patterns.
- A notable 26.3% of properties secure long booking periods (181+ days booked per year), highlighting successful long-term rental strategies or significant owner usage.
Sanger Airbnb Minimum Stay Requirements Analysis
Distribution of Listings by Minimum Night Requirement
1 Night
7 listings
36.8% of total
2 Nights
8 listings
42.1% of total
30+ Nights
4 listings
21.1% of total
Key Insights
- The most prevalent minimum stay requirement in Sanger is 2 Nights, adopted by 42.1% of listings. This highlights the market's preference for shorter, flexible bookings.
- A strong majority (78.9%) of the Sanger Airbnb data shows acceptance of very short stays (1-2 nights), indicating a dynamic, high-turnover market.
- A significant segment (21.1%) caters to monthly stays (30+ nights) in Sanger, pointing to opportunities in the extended-stay market.
Recommendations
- Align with the market by considering a 2 Nights minimum stay, as 42.1% of Sanger hosts use this setting.
- Explore offering discounts for stays of 30+ nights to attract the 21.1% of the market seeking extended stays.
- Adjust minimum nights based on seasonality – potentially shorter during low season and longer during peak demand periods in Sanger.
Sanger Airbnb Cancellation Policy Trends Analysis (2026)
Flexible
4 listings
21.1% of total
Moderate
6 listings
31.6% of total
Firm
5 listings
26.3% of total
Strict
4 listings
21.1% of total
Cancellation Policy Insights for Sanger
- The prevailing Airbnb cancellation policy trend in Sanger is Moderate, used by 31.6% of listings.
- There's a relatively balanced mix between guest-friendly (52.7%) and stricter (47.4%) policies, offering choices for different guest needs.
Recommendations for Hosts
- Consider adopting a Moderate policy to align with the 31.6% market standard in Sanger.
- Regularly review your cancellation policy against competitors and market demand shifts in Sanger.
Sanger STR Booking Lead Time Analysis (2026)
Average Booking Lead Time by Month
Booking Lead Time Insights for Sanger
- The overall average booking lead time for vacation rentals in Sanger is 31 days.
- Guests book furthest in advance for stays during August (average 56 days), likely coinciding with peak travel demand or local events.
- The shortest booking windows occur for stays in February (average 8 days), indicating more last-minute travel plans during this time.
- Seasonally, Summer (46 days avg.) sees the longest lead times, while Winter (23 days avg.) has the shortest, reflecting typical travel planning cycles.
Recommendations for Hosts
- Use the overall average lead time (31 days) as a baseline for your pricing and availability strategy in Sanger.
- For August stays, consider implementing length-of-stay discounts or slightly higher rates for bookings made less than 56 days out to capitalize on advance planning.
- During February, focus on last-minute booking availability and promotions, as guests book with very short notice (8 days avg.).
- Target marketing efforts for the Summer season well in advance (at least 46 days) to capture early planners.
- Monitor your own booking lead times against these Sanger averages to identify opportunities for dynamic pricing adjustments.
Popular & Essential Airbnb Amenities in Sanger (2026)
Amenity Prevalence
Amenity Insights for Sanger
- Essential amenities in Sanger that guests expect include: Heating, Carbon monoxide alarm, Air conditioning, Smoke alarm, Fire extinguisher. Lacking these (any) could significantly impact bookings.
- Popular amenities like Free parking on premises, Bed linens, TV are common but not universal. Offering these can provide a competitive edge.
Recommendations for Hosts
- Ensure your listing includes all essential amenities for Sanger: Heating, Carbon monoxide alarm, Air conditioning, Smoke alarm, Fire extinguisher.
- Consider adding popular differentiators like Free parking on premises or Bed linens to increase appeal.
- Highlight unique or less common amenities you offer (e.g., hot tub, dedicated workspace, EV charger) in your listing description and photos.
- Regularly check competitor amenities in Sanger to stay competitive.
Sanger Airbnb Guest Demographics & Profile Analysis (2026)
Guest Profile Summary for Sanger
- The typical guest profile for Airbnb in Sanger consists of primarily domestic travelers (89%), often arriving from nearby Los Angeles, typically belonging to the Post-2000s (Gen Z/Alpha) group (50%), primarily speaking English or Spanish.
- Domestic travelers account for 89.2% of guests.
- Key international markets include United States (89.2%) and Germany (3%).
- Top languages spoken are English (57.9%) followed by Spanish (22.3%).
- A significant demographic segment is the Post-2000s (Gen Z/Alpha) group, representing 50% of guests.
Recommendations for Hosts
- Target domestic marketing efforts towards travelers from Los Angeles and Sacramento.
- Tailor amenities and listing descriptions to appeal to the dominant Post-2000s (Gen Z/Alpha) demographic (e.g., highlight fast WiFi, smart home features, local guides).
- Highlight unique local experiences or amenities relevant to the primary guest profile.
- Consider seasonal promotions aligned with peak travel times for key origin markets.
Nearby Short-Term Rental Market Comparison
How does the Sanger Airbnb market stack up against its neighbors? Compare key performance metrics like average monthly revenue, ADR, and occupancy rates in surrounding areas to understand the broader regional STR landscape.
| Market | Active Properties | Monthly Revenue | Daily Rate | Avg. Occupancy |
|---|---|---|---|---|
| Wawona | 66 | $7,186 | $548.44 | 45% |
| Yosemite National Park | 227 | $6,835 | $511.03 | 44% |
| Avila Beach | 94 | $6,770 | $582.34 | 41% |
| Yosemite West | 29 | $5,597 | $423.79 | 49% |
| Three Rivers | 407 | $5,504 | $387.06 | 50% |
| Templeton | 159 | $5,070 | $541.75 | 38% |
| San Luis Obispo | 319 | $4,877 | $391.84 | 48% |
| Paso Robles | 690 | $4,837 | $449.42 | 39% |
| Lone Pine | 33 | $4,810 | $274.42 | 55% |
| Cayucos | 186 | $4,743 | $438.93 | 42% |