Santa Ana Airbnb Market Analysis 2026: Short Term Rental Data & Vacation Rental Statistics in California, United States
Is Airbnb profitable in Santa Ana in 2026? Explore comprehensive Airbnb analytics for Santa Ana, California, United States to uncover income potential. This 2026 STR market report for Santa Ana, based on AirROI data from February 2025 to January 2026, reveals key trends in the market of 766 active listings.
Whether you're considering an Airbnb investment in Santa Ana, optimizing your existing vacation rental, or exploring rental arbitrage opportunities, understanding the Santa Ana Airbnb data is crucial. Leveraging the low regulation environment is key to maximizing your short term rental income potential. Let's dive into the specifics.
Key Santa Ana Airbnb Performance Metrics Overview
Monthly Airbnb Revenue Variations & Income Potential in Santa Ana (2026)
Understanding the monthly revenue variations for Airbnb listings in Santa Ana is key to maximizing your short term rental income potential. Seasonality significantly impacts earnings. Our analysis, based on data from the past 12 months, shows that the peak revenue month for STRs in Santa Ana is typically July, while January often presents the lowest earnings, highlighting opportunities for strategic pricing adjustments during shoulder and low seasons. Explore the typical Airbnb income in Santa Ana across different performance tiers:
- Best-in-class properties (Top 10%) achieve $7,674+ monthly, often utilizing dynamic pricing and superior guest experiences.
- Strong performing properties (Top 25%) earn $5,245 or more, indicating effective management and desirable locations/amenities.
- Typical properties (Median) generate around $3,280 per month, representing the average market performance.
- Entry-level properties (Bottom 25%) see earnings around $1,526, often with potential for optimization.
Average Monthly Airbnb Earnings Trend in Santa Ana
Santa Ana Airbnb Occupancy Rate Trends (2026)
Maximize your bookings by understanding the Santa Ana STR occupancy trends. Seasonal demand shifts significantly influence how often properties are booked. Typically, Julysees the highest demand (peak season occupancy), while January experiences the lowest (low season). Effective strategies, like adjusting minimum stays or offering promotions, can boost occupancy during slower periods. Here's how different property tiers perform in Santa Ana:
- Best-in-class properties (Top 10%) achieve 87%+ occupancy, indicating high desirability and potentially optimized availability.
- Strong performing properties (Top 25%) maintain 76% or higher occupancy, suggesting good market fit and guest satisfaction.
- Typical properties (Median) have an occupancy rate around 57%.
- Entry-level properties (Bottom 25%) average 31% occupancy, potentially facing higher vacancy.
Average Monthly Occupancy Rate Trend in Santa Ana
Average Daily Rate (ADR) Airbnb Trends in Santa Ana (2026)
Effective short term rental pricing strategy in Santa Ana involves understanding monthly ADR fluctuations. The Average Daily Rate (ADR) for Airbnb in Santa Ana typically peaks in June and dips lowest during February. Leveraging Airbnb dynamic pricing tools or strategies based on this seasonality can significantly boost revenue. Here's a look at the typical nightly rates achieved:
- Best-in-class properties (Top 10%) command rates of $407+ per night, often due to premium features or locations.
- Strong performing properties (Top 25%) achieve nightly rates of $291 or more.
- Typical properties (Median) charge around $195 per night.
- Entry-level properties (Bottom 25%) earn around $132 per night.
Average Daily Rate (ADR) Trend by Month in Santa Ana
Get Live Santa Ana Market Intelligence 👇

Explore Real-time Analytics
Airbnb Seasonality Analysis & Trends in Santa Ana (2026)
Peak Season (July, June, March)
- Revenue averages $4,672 per month
- Occupancy rates average 59.9%
- Daily rates average $238
Shoulder Season
- Revenue averages $3,868 per month
- Occupancy maintains around 52.6%
- Daily rates hold near $230
Low Season (January, February, November)
- Revenue drops to average $3,091 per month
- Occupancy decreases to average 49.6%
- Daily rates adjust to average $219
Seasonality Insights for Santa Ana
- The Airbnb seasonality in Santa Ana shows moderate seasonality with distinct peak and low periods. While the sections above show seasonal averages, it's also insightful to look at the extremes:
- During the high season, the absolute peak month showcases Santa Ana's highest earning potential, with monthly revenues capable of climbing to $5,159, occupancy reaching a high of 62.0%, and ADRs peaking at $244.
- Conversely, the slowest single month of the year, typically falling within the low season, marks the market's lowest point. In this month, revenue might dip to $2,771, occupancy could drop to 41.7%, and ADRs may adjust down to $207.
- Understanding both the seasonal averages and these monthly peaks and troughs in revenue, occupancy, and ADR is crucial for maximizing your Airbnb profit potential in Santa Ana.
Seasonal Strategies for Maximizing Profit
- Peak Season: Maximize revenue through premium pricing and potentially longer minimum stays. Ensure high availability.
- Low Season: Offer competitive pricing, special promotions (e.g., extended stay discounts), and flexible cancellation policies. Target off-season travelers like remote workers or budget-conscious guests.
- Shoulder Seasons: Implement dynamic pricing that balances peak and low rates. Target weekend travelers or specific events. Offer slightly more flexible terms than peak season.
- Regularly analyze your own performance against these Santa Ana seasonality benchmarks and adjust your pricing and availability strategy accordingly.
Best Areas for Airbnb Investment in Santa Ana (2026)
Exploring the top neighborhoods for short-term rentals in Santa Ana? This section highlights key areas, outlining why they are attractive for hosts and guests, along with notable local attractions. Consider these locations based on your target guest profile and investment strategy.
| Neighborhood / Area | Why Host Here? (Target Guests & Appeal) | Key Attractions & Landmarks |
|---|---|---|
| Downtown Santa Ana | vibrant area with nightlife, dining, and cultural attractions. Hosts a variety of festivals and events, appealing to young travelers and professionals. | Santa Ana Artists Village, Bowers Museum, Santiago Park, The Observatory, Civic Center |
| Old Town Santa Ana | historic area with charming architecture and cultural significance. Close to various museums and restaurants, making it a popular choice for visitors. | Old Orange County Courthouse, Casa Moreno, The Frida Cinema, Santa Ana Museum of Art, The Kolette House |
| South Santa Ana | emerging neighborhood with diverse dining options and community events. Attracts families looking for local experiences. | Santa Ana Zoo, MainPlace Mall, Santiago Canyon, local farmer's markets, community parks |
| North Santa Ana | save area known for its residential community feel and accessibility to major highways. Great for family stays and longer visits. | The Discovery Cube, Chapman University, local parks, shopping centers, nature trails |
| Santa Ana Heights | quiet and upscale residential neighborhood with scenic views and close proximity to the coast. Ideal for those seeking a tranquil getaway. | Orange Coast College, nestled parks, viewpoints, golf courses, local vineyards |
| Metro East Santa Ana | unfolding area with potential and exciting growth. Ideal for investment as new businesses and amenities develop. | local eateries, community markets, new developments, parks, convivial atmosphere |
| West Santa Ana | growing area with a rich cultural heritage and local charm. Great for guests interested in authentic local experiences. | historic neighborhoods, local festivals, cultural events, community centers, park spaces |
| East Santa Ana | family-friendly neighborhood with access to schools, parks and amenities. Perfect for visiting families looking for comfort and convenience. | local parks, shopping centers, schools, community centers, family eateries |
Understanding Airbnb License Requirements & STR Laws in Santa Ana (2026)
While Santa Ana, California, United States currently shows low STR regulations, specific Airbnb license requirements might still exist or change. Always verify the latest short term rental regulations and Airbnb license requirements directly with local government authorities for Santa Ana to ensure full compliance before hosting.
(Source: AirROI data, 2026, based on 1% licensed listings)
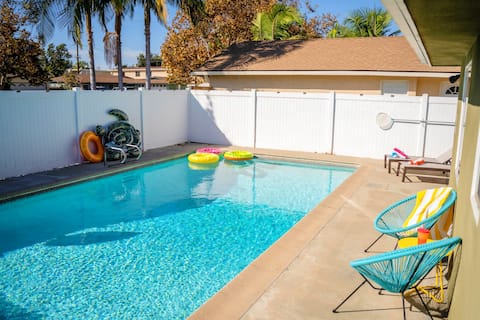
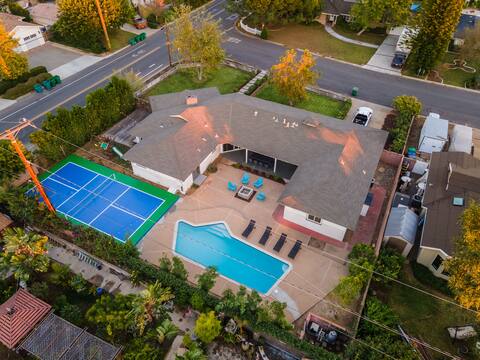
Top Performing Airbnb Properties in Santa Ana (2026)
Benchmark your potential! Explore examples of top-performing Airbnb properties in Santa Anabased on Trailing Twelve Month (TTM) revenue. Analyze their characteristics, revenue, occupancy rate, and ADR to understand what drives success in this market.

Panorama Valley View Estate
Entire Place • 5 bedrooms

4000SF+18min Disney! Stunning Pool| Expansive Yard
Entire Place • 4 bedrooms

360° HILLTOP VIEW / Ultra Modern / 15min DISNEY
Entire Place • 4 bedrooms

Beautiful luxury home 5 bdm 4.5 bath near Disney
Entire Place • 6 bedrooms
✨Disney & Beach 🏖 Heated Pool 👙Golf & Games 🕹
Entire Place • 3 bedrooms
Pickleball, Disney, beach, heated pool, sleeps12!
Entire Place • 4 bedrooms
Note: Performance varies based on location, size, amenities, seasonality, and management quality. Data reflects the past 12 months.
Top Performing Airbnb Hosts in Santa Ana (2026)
Learn from the best! This table showcases top-performing Airbnb hosts in Santa Ana based on the number of properties managed and estimated total revenue over the past year. Analyze their scale and performance metrics.
| Host Name | Properties | Grossing Revenue | Stay Reviews | Avg Rating |
|---|---|---|---|---|
| Kye | 16 | $887,783 | 524 | 4.86/5.0 |
| Denisse | 20 | $628,340 | 1166 | 4.78/5.0 |
| George | 16 | $612,747 | 582 | 4.87/5.0 |
| M V Home | 10 | $558,261 | 295 | 4.72/5.0 |
| Rafa | 15 | $457,750 | 595 | 4.62/5.0 |
| OC Rentals | 22 | $397,967 | 254 | 4.09/5.0 |
| Shirley With Lotustay | 2 | $296,429 | 40 | 4.95/5.0 |
| Jeffrey | 4 | $294,688 | 131 | 4.98/5.0 |
| Dream Getaways | 3 | $290,353 | 106 | 4.90/5.0 |
| Trung | 6 | $268,159 | 116 | 4.95/5.0 |
Analyzing the strategies of top hosts, such as their property selection, pricing, and guest communication, can offer valuable lessons for optimizing your own Airbnb operations in Santa Ana.
Dive Deeper: Advanced Santa Ana STR Market Data (2026)
Ready to unlock more insights? AirROI provides access to advanced metrics and comprehensive Airbnb data for Santa Ana. Explore detailed analytics beyond this report to refine your investment strategy, optimize pricing, and maximize your vacation rental profits.
Explore Advanced MetricsSanta Ana Short-Term Rental Market Composition (2026): Property & Room Types
Room Type Distribution
Property Type Distribution
Market Composition Insights for Santa Ana
- The Santa Ana Airbnb market composition is heavily skewed towards Entire Home/Apt listings, which make up 81.7% of the 766 active rentals. This indicates strong guest preference for privacy and space.
- Looking at the property type distribution in Santa Ana, House properties are the most common (44.6%), reflecting the local real estate landscape.
- Houses represent a significant 44.6% portion, catering likely to families or larger groups.
- The presence of 9.9% Hotel/Boutique listings indicates integration with traditional hospitality.
- Smaller segments like others, outdoor/unique (combined 3.8%) offer potential for unique stay experiences.
Santa Ana Airbnb Room Capacity Analysis (2026): Bedroom Distribution
Distribution of Listings by Number of Bedrooms
Room Capacity Insights for Santa Ana
- The dominant room capacity in Santa Ana is 1 bedroom listings, making up 32.8% of the market. This suggests a strong demand for properties suitable for couples or solo travelers.
- Together, 1 bedroom and 2 bedrooms properties represent 56.6% of the active Airbnb listings in Santa Ana, indicating a high concentration in these sizes.
- A significant 27.6% of listings offer 3+ bedrooms, catering to larger groups and families seeking more space in Santa Ana.
Santa Ana Vacation Rental Guest Capacity Trends (2026)
Distribution of Listings by Guest Capacity
Guest Capacity Insights for Santa Ana
- The most common guest capacity trend in Santa Ana vacation rentals is listings accommodating 8+ guests (31.3%). This suggests the primary traveler segment is likely larger groups.
- Properties designed for 8+ guests and 4 guests dominate the Santa Ana STR market, accounting for 47.7% of listings.
- 49.1% of properties accommodate 6+ guests, serving the market segment for larger families or group travel in Santa Ana.
- On average, properties in Santa Ana are equipped to host 4.9 guests.
Santa Ana Airbnb Booking Patterns (2026): Available vs. Booked Days
Available Days Distribution
Booked Days Distribution
Booking Pattern Insights for Santa Ana
- The most common availability pattern in Santa Ana falls within the 271-366 days range, representing 38.5% of listings. This suggests many properties have significant open periods on their calendars.
- Approximately 64.9% of listings show high availability (181+ days open annually), indicating potential for increased bookings or specific owner usage patterns.
- For booked days, the 91-180 days range is most frequent in Santa Ana (26.4%), reflecting common guest stay durations or potential owner blocking patterns.
- A notable 36.4% of properties secure long booking periods (181+ days booked per year), highlighting successful long-term rental strategies or significant owner usage.
Santa Ana Airbnb Minimum Stay Requirements Analysis
Distribution of Listings by Minimum Night Requirement
1 Night
216 listings
28.2% of total
2 Nights
131 listings
17.1% of total
3 Nights
28 listings
3.7% of total
4-6 Nights
42 listings
5.5% of total
7-29 Nights
127 listings
16.6% of total
30+ Nights
222 listings
29% of total
Key Insights
- The most prevalent minimum stay requirement in Santa Ana is 30+ Nights, adopted by 29% of listings. This highlights the market's preference for longer commitments.
- A significant segment (29%) caters to monthly stays (30+ nights) in Santa Ana, pointing to opportunities in the extended-stay market.
Recommendations
- Align with the market by considering a 30+ Nights minimum stay, as 29% of Santa Ana hosts use this setting.
- If feasible, allowing 1-night stays, especially midweek or during low season, could capture last-minute bookings, as only 28.2% currently do.
- Explore offering discounts for stays of 30+ nights to attract the 29% of the market seeking extended stays.
- Adjust minimum nights based on seasonality – potentially shorter during low season and longer during peak demand periods in Santa Ana.
Santa Ana Airbnb Cancellation Policy Trends Analysis (2026)
Super Strict 30 Days
5 listings
0.7% of total
Limited
5 listings
0.7% of total
Flexible
115 listings
15% of total
Moderate
152 listings
19.9% of total
Firm
268 listings
35% of total
Strict
220 listings
28.8% of total
Cancellation Policy Insights for Santa Ana
- The prevailing Airbnb cancellation policy trend in Santa Ana is Firm, used by 35% of listings.
- A majority (63.8%) of hosts in Santa Ana utilize Firm or Strict policies, indicating a market where hosts prioritize booking security.
Recommendations for Hosts
- Consider adopting a Firm policy to align with the 35% market standard in Santa Ana.
- Regularly review your cancellation policy against competitors and market demand shifts in Santa Ana.
Santa Ana STR Booking Lead Time Analysis (2026)
Average Booking Lead Time by Month
Booking Lead Time Insights for Santa Ana
- The overall average booking lead time for vacation rentals in Santa Ana is 28 days.
- Guests book furthest in advance for stays during July (average 40 days), likely coinciding with peak travel demand or local events.
- The shortest booking windows occur for stays in February (average 23 days), indicating more last-minute travel plans during this time.
- Seasonally, Summer (34 days avg.) sees the longest lead times, while Spring (27 days avg.) has the shortest, reflecting typical travel planning cycles.
Recommendations for Hosts
- Use the overall average lead time (28 days) as a baseline for your pricing and availability strategy in Santa Ana.
- For July stays, consider implementing length-of-stay discounts or slightly higher rates for bookings made less than 40 days out to capitalize on advance planning.
- Target marketing efforts for the Summer season well in advance (at least 34 days) to capture early planners.
- Monitor your own booking lead times against these Santa Ana averages to identify opportunities for dynamic pricing adjustments.
Popular & Essential Airbnb Amenities in Santa Ana (2026)
Amenity Prevalence
Amenity Insights for Santa Ana
- Essential amenities in Santa Ana that guests expect include: Wifi, Air conditioning, TV, Smoke alarm. Lacking these (any) could significantly impact bookings.
- Popular amenities like Hot water, Free parking on premises, Heating are common but not universal. Offering these can provide a competitive edge.
Recommendations for Hosts
- Ensure your listing includes all essential amenities for Santa Ana: Wifi, Air conditioning, TV, Smoke alarm.
- Prioritize adding missing essentials: Wifi, Air conditioning, TV, Smoke alarm.
- Consider adding popular differentiators like Hot water or Free parking on premises to increase appeal.
- Highlight unique or less common amenities you offer (e.g., hot tub, dedicated workspace, EV charger) in your listing description and photos.
- Regularly check competitor amenities in Santa Ana to stay competitive.
Santa Ana Airbnb Guest Demographics & Profile Analysis (2026)
Guest Profile Summary for Santa Ana
- The typical guest profile for Airbnb in Santa Ana consists of primarily domestic travelers (89%), often arriving from nearby Las Vegas, typically belonging to the Post-2000s (Gen Z/Alpha) group (50%), primarily speaking English or Spanish.
- Domestic travelers account for 89.0% of guests.
- Key international markets include United States (89%) and Canada (2.3%).
- Top languages spoken are English (60.9%) followed by Spanish (20.8%).
- A significant demographic segment is the Post-2000s (Gen Z/Alpha) group, representing 50% of guests.
Recommendations for Hosts
- Target domestic marketing efforts towards travelers from Las Vegas and Los Angeles.
- Tailor amenities and listing descriptions to appeal to the dominant Post-2000s (Gen Z/Alpha) demographic (e.g., highlight fast WiFi, smart home features, local guides).
- Highlight unique local experiences or amenities relevant to the primary guest profile.
- Consider seasonal promotions aligned with peak travel times for key origin markets.
Nearby Short-Term Rental Market Comparison
How does the Santa Ana Airbnb market stack up against its neighbors? Compare key performance metrics like average monthly revenue, ADR, and occupancy rates in surrounding areas to understand the broader regional STR landscape.
| Market | Active Properties | Monthly Revenue | Daily Rate | Avg. Occupancy |
|---|---|---|---|---|
| Newport Beach | 1,273 | $8,950 | $744.06 | 47% |
| Rancho San Diego | 25 | $8,649 | $568.72 | 48% |
| Malibu | 251 | $8,293 | $1263.89 | 35% |
| Thousand Palms | 33 | $8,119 | $725.48 | 36% |
| Manhattan Beach | 267 | $7,875 | $585.30 | 53% |
| Lakeside | 33 | $7,537 | $604.33 | 44% |
| GlenOak Hills | 41 | $7,394 | $648.65 | 41% |
| Bermuda Dunes | 143 | $7,324 | $664.90 | 39% |
| Mount Helix | 33 | $7,163 | $594.94 | 50% |
| Del Mar | 128 | $7,011 | $671.56 | 45% |