Santa Margarita Airbnb Market Analysis 2026: Short Term Rental Data & Vacation Rental Statistics in California, United States
Is Airbnb profitable in Santa Margarita in 2026? Explore comprehensive Airbnb analytics for Santa Margarita, California, United States to uncover income potential. This 2026 STR market report for Santa Margarita, based on AirROI data from February 2025 to January 2026, reveals key trends in the niche market of 27 active listings.
Whether you're considering an Airbnb investment in Santa Margarita, optimizing your existing vacation rental, or exploring rental arbitrage opportunities, understanding the Santa Margarita Airbnb data is crucial. Understanding the local regulations is key to maximizing your short term rental income potential. Let's dive into the specifics.
Key Santa Margarita Airbnb Performance Metrics Overview
Monthly Airbnb Revenue Variations & Income Potential in Santa Margarita (2026)
Understanding the monthly revenue variations for Airbnb listings in Santa Margarita is key to maximizing your short term rental income potential. Seasonality significantly impacts earnings. Our analysis, based on data from the past 12 months, shows that the peak revenue month for STRs in Santa Margarita is typically July, while January often presents the lowest earnings, highlighting opportunities for strategic pricing adjustments during shoulder and low seasons. Explore the typical Airbnb income in Santa Margarita across different performance tiers:
- Best-in-class properties (Top 10%) achieve $8,978+ monthly, often utilizing dynamic pricing and superior guest experiences.
- Strong performing properties (Top 25%) earn $5,293 or more, indicating effective management and desirable locations/amenities.
- Typical properties (Median) generate around $3,411 per month, representing the average market performance.
- Entry-level properties (Bottom 25%) see earnings around $1,756, often with potential for optimization.
Average Monthly Airbnb Earnings Trend in Santa Margarita
Santa Margarita Airbnb Occupancy Rate Trends (2026)
Maximize your bookings by understanding the Santa Margarita STR occupancy trends. Seasonal demand shifts significantly influence how often properties are booked. Typically, Julysees the highest demand (peak season occupancy), while January experiences the lowest (low season). Effective strategies, like adjusting minimum stays or offering promotions, can boost occupancy during slower periods. Here's how different property tiers perform in Santa Margarita:
- Best-in-class properties (Top 10%) achieve 66%+ occupancy, indicating high desirability and potentially optimized availability.
- Strong performing properties (Top 25%) maintain 49% or higher occupancy, suggesting good market fit and guest satisfaction.
- Typical properties (Median) have an occupancy rate around 32%.
- Entry-level properties (Bottom 25%) average 20% occupancy, potentially facing higher vacancy.
Average Monthly Occupancy Rate Trend in Santa Margarita
Average Daily Rate (ADR) Airbnb Trends in Santa Margarita (2026)
Effective short term rental pricing strategy in Santa Margarita involves understanding monthly ADR fluctuations. The Average Daily Rate (ADR) for Airbnb in Santa Margarita typically peaks in September and dips lowest during February. Leveraging Airbnb dynamic pricing tools or strategies based on this seasonality can significantly boost revenue. Here's a look at the typical nightly rates achieved:
- Best-in-class properties (Top 10%) command rates of $626+ per night, often due to premium features or locations.
- Strong performing properties (Top 25%) achieve nightly rates of $412 or more.
- Typical properties (Median) charge around $277 per night.
- Entry-level properties (Bottom 25%) earn around $178 per night.
Average Daily Rate (ADR) Trend by Month in Santa Margarita
Get Live Santa Margarita Market Intelligence 👇

Explore Real-time Analytics
Airbnb Seasonality Analysis & Trends in Santa Margarita (2026)
Peak Season (July, August, November)
- Revenue averages $5,447 per month
- Occupancy rates average 44.6%
- Daily rates average $361
Shoulder Season
- Revenue averages $4,174 per month
- Occupancy maintains around 35.6%
- Daily rates hold near $348
Low Season (January, April, May)
- Revenue drops to average $3,360 per month
- Occupancy decreases to average 30.5%
- Daily rates adjust to average $356
Seasonality Insights for Santa Margarita
- The Airbnb seasonality in Santa Margarita shows highly seasonal trends requiring careful strategy. While the sections above show seasonal averages, it's also insightful to look at the extremes:
- During the high season, the absolute peak month showcases Santa Margarita's highest earning potential, with monthly revenues capable of climbing to $6,775, occupancy reaching a high of 58.4%, and ADRs peaking at $375.
- Conversely, the slowest single month of the year, typically falling within the low season, marks the market's lowest point. In this month, revenue might dip to $2,710, occupancy could drop to 24.6%, and ADRs may adjust down to $300.
- Understanding both the seasonal averages and these monthly peaks and troughs in revenue, occupancy, and ADR is crucial for maximizing your Airbnb profit potential in Santa Margarita.
Seasonal Strategies for Maximizing Profit
- Peak Season: Maximize revenue through premium pricing and potentially longer minimum stays. Ensure high availability.
- Low Season: Offer competitive pricing, special promotions (e.g., extended stay discounts), and flexible cancellation policies. Target off-season travelers like remote workers or budget-conscious guests.
- Shoulder Seasons: Implement dynamic pricing that balances peak and low rates. Target weekend travelers or specific events. Offer slightly more flexible terms than peak season.
- Regularly analyze your own performance against these Santa Margarita seasonality benchmarks and adjust your pricing and availability strategy accordingly.
Best Areas for Airbnb Investment in Santa Margarita (2026)
Exploring the top neighborhoods for short-term rentals in Santa Margarita? This section highlights key areas, outlining why they are attractive for hosts and guests, along with notable local attractions. Consider these locations based on your target guest profile and investment strategy.
| Neighborhood / Area | Why Host Here? (Target Guests & Appeal) | Key Attractions & Landmarks |
|---|---|---|
| Santa Margarita Lake | Scenic lake area perfect for outdoor activities like fishing, kayaking, and hiking. Attracts nature lovers and families looking for relaxing getaways. | Santa Margarita Lake, Hiking Trails, Fishing Spots |
| Santa Margarita Downtown | Quaint small-town vibe with local shops, cafes, and a friendly community atmosphere. Ideal for visitors wanting a laid-back experience after touring wine country. | Local Cafes, Santa Margarita's Historic Buildings, Wine Tasting Rooms |
| Paso Robles Wine Country | Renowned wine region with vineyards and wineries, attracting wine enthusiasts and tourists for tasting events and scenic tours. | Paso Robles Wineries, Wine Tasting Tours, Vineyard Views |
| Elephant Seal Vista Point | Unique wildlife viewing area where visitors can observe elephant seals in their natural habitat, drawing animal lovers and photographers. | Elephant Seal Viewing, Coastal Views, Nature Trails |
| San Luis Obispo | Nearby college town with a vibrant downtown filled with shops, restaurants, and cultural attractions, appealing to a younger crowd and families alike. | SLO Farmers Market, California Polytechnic State University, Downtown Shops and Dining |
| Atascadero | Family-friendly town with parks, a zoo, and community events. Great for families looking for a safe and engaging environment. | Atascadero Zoo, Sunken Gardens, Parks for Kids |
| Nacimiento-Fergusson Road | Scenic drive and outdoor adventure area with stunning views, popular with hikers and nature photographers seeking breathtaking landscapes. | Nacimiento-Fergusson Road, Hiking Trails, Scenic Overlooks |
| Coastal Highway 1 | Iconic scenic highway that offers breathtaking coastal views. Attracts travelers looking for beautiful drives and access to nearby beaches and vistas. | Big Sur Views, Beaches along Highway 1, Photogenic Lookout Points |
Understanding Airbnb License Requirements & STR Laws in Santa Margarita (2026)
With 11% of listings showing registration in 2026, understanding potential Airbnb license requirements is crucial in Santa Margarita. Always verify the latest short term rental regulations and Airbnb license requirements directly with local government authorities for Santa Margarita to ensure full compliance before hosting.
(Source: AirROI data, 2026, based on 11% licensed listings)
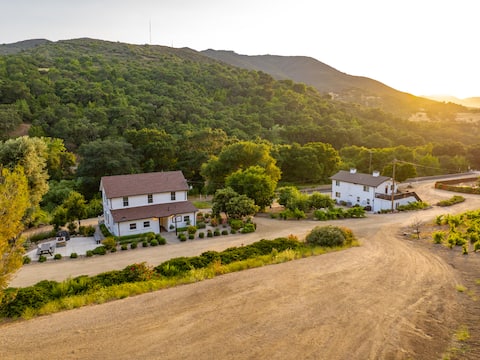
Top Performing Airbnb Properties in Santa Margarita (2026)
Benchmark your potential! Explore examples of top-performing Airbnb properties in Santa Margaritabased on Trailing Twelve Month (TTM) revenue. Analyze their characteristics, revenue, occupancy rate, and ADR to understand what drives success in this market.
8 Mile House Deluxe
Entire Place • 9 bedrooms

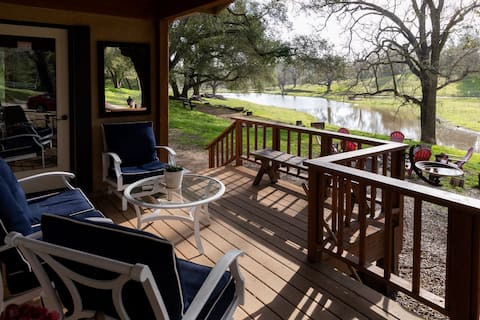
The Cabin at Whisper Valley Ranch
Entire Place • 5 bedrooms

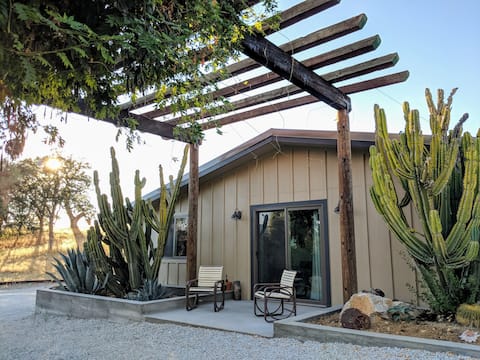
LaMargarita | Stunning Lake Views & Access |
Entire Place • 1 bedroom
Seven Oaks Ranch Oak House
Entire Place • 5 bedrooms
Mountain Sanctuary, Saltwater Pool
Entire Place • 3 bedrooms
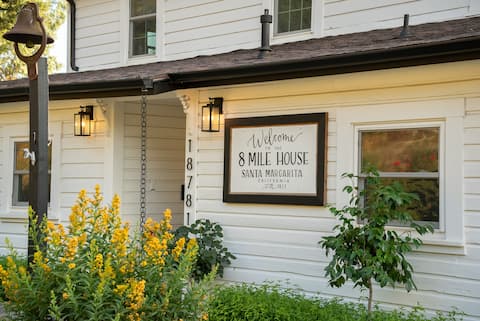
8 Mile House
Entire Place • 4 bedrooms
Note: Performance varies based on location, size, amenities, seasonality, and management quality. Data reflects the past 12 months.
Top Performing Airbnb Hosts in Santa Margarita (2026)
Learn from the best! This table showcases top-performing Airbnb hosts in Santa Margarita based on the number of properties managed and estimated total revenue over the past year. Analyze their scale and performance metrics.
| Host Name | Properties | Grossing Revenue | Stay Reviews | Avg Rating |
|---|---|---|---|---|
| Paso Robles Vacation Rentals | 4 | $291,894 | 73 | 4.83/5.0 |
| Karlie | 3 | $151,312 | 110 | 4.93/5.0 |
| Michael | 1 | $127,014 | 181 | 4.97/5.0 |
| Scott | 2 | $106,215 | 130 | 4.98/5.0 |
| Patricia | 1 | $105,334 | 59 | 4.97/5.0 |
| Kristin | 2 | $100,741 | 201 | 4.96/5.0 |
| Patty | 4 | $78,424 | 403 | 4.91/5.0 |
| Diann | 1 | $56,195 | 142 | 4.96/5.0 |
| Tim | 1 | $53,371 | 13 | 5.00/5.0 |
| Ali | 1 | $34,806 | 67 | 4.79/5.0 |
Analyzing the strategies of top hosts, such as their property selection, pricing, and guest communication, can offer valuable lessons for optimizing your own Airbnb operations in Santa Margarita.
Dive Deeper: Advanced Santa Margarita STR Market Data (2026)
Ready to unlock more insights? AirROI provides access to advanced metrics and comprehensive Airbnb data for Santa Margarita. Explore detailed analytics beyond this report to refine your investment strategy, optimize pricing, and maximize your vacation rental profits.
Explore Advanced MetricsSanta Margarita Short-Term Rental Market Composition (2026): Property & Room Types
Room Type Distribution
Property Type Distribution
Market Composition Insights for Santa Margarita
- The Santa Margarita Airbnb market composition is heavily skewed towards Entire Home/Apt listings, which make up 100% of the 27 active rentals. This indicates strong guest preference for privacy and space.
- Looking at the property type distribution in Santa Margarita, House properties are the most common (48.1%), reflecting the local real estate landscape.
- Houses represent a significant 48.1% portion, catering likely to families or larger groups.
- Smaller segments like others (combined 3.7%) offer potential for unique stay experiences.
Santa Margarita Airbnb Room Capacity Analysis (2026): Bedroom Distribution
Distribution of Listings by Number of Bedrooms
Room Capacity Insights for Santa Margarita
- The dominant room capacity in Santa Margarita is 3 bedrooms listings, making up 29.6% of the market. This suggests a strong demand for properties suitable for families or small groups.
- Together, 3 bedrooms and 1 bedroom properties represent 59.2% of the active Airbnb listings in Santa Margarita, indicating a high concentration in these sizes.
- A significant 44.4% of listings offer 3+ bedrooms, catering to larger groups and families seeking more space in Santa Margarita.
Santa Margarita Vacation Rental Guest Capacity Trends (2026)
Distribution of Listings by Guest Capacity
Guest Capacity Insights for Santa Margarita
- The most common guest capacity trend in Santa Margarita vacation rentals is listings accommodating 8+ guests (33.3%). This suggests the primary traveler segment is likely larger groups.
- Properties designed for 8+ guests and 2 guests dominate the Santa Margarita STR market, accounting for 59.2% of listings.
- 59.2% of properties accommodate 6+ guests, serving the market segment for larger families or group travel in Santa Margarita.
- On average, properties in Santa Margarita are equipped to host 5.4 guests.
Santa Margarita Airbnb Booking Patterns (2026): Available vs. Booked Days
Available Days Distribution
Booked Days Distribution
Booking Pattern Insights for Santa Margarita
- The most common availability pattern in Santa Margarita falls within the 181-270 days range, representing 55.6% of listings. This suggests many properties have significant open periods on their calendars.
- Approximately 85.2% of listings show high availability (181+ days open annually), indicating potential for increased bookings or specific owner usage patterns.
- For booked days, the 91-180 days range is most frequent in Santa Margarita (59.3%), reflecting common guest stay durations or potential owner blocking patterns.
- A notable 14.8% of properties secure long booking periods (181+ days booked per year), highlighting successful long-term rental strategies or significant owner usage.
Santa Margarita Airbnb Minimum Stay Requirements Analysis
Distribution of Listings by Minimum Night Requirement
1 Night
10 listings
37% of total
2 Nights
13 listings
48.1% of total
3 Nights
1 listings
3.7% of total
30+ Nights
3 listings
11.1% of total
Key Insights
- The most prevalent minimum stay requirement in Santa Margarita is 2 Nights, adopted by 48.1% of listings. This highlights the market's preference for shorter, flexible bookings.
- A strong majority (85.1%) of the Santa Margarita Airbnb data shows acceptance of very short stays (1-2 nights), indicating a dynamic, high-turnover market.
- A significant segment (11.1%) caters to monthly stays (30+ nights) in Santa Margarita, pointing to opportunities in the extended-stay market.
Recommendations
- Align with the market by considering a 2 Nights minimum stay, as 48.1% of Santa Margarita hosts use this setting.
- Explore offering discounts for stays of 30+ nights to attract the 11.1% of the market seeking extended stays.
- Adjust minimum nights based on seasonality – potentially shorter during low season and longer during peak demand periods in Santa Margarita.
Santa Margarita Airbnb Cancellation Policy Trends Analysis (2026)
Flexible
9 listings
33.3% of total
Moderate
7 listings
25.9% of total
Firm
10 listings
37% of total
Strict
1 listings
3.7% of total
Cancellation Policy Insights for Santa Margarita
- The prevailing Airbnb cancellation policy trend in Santa Margarita is Firm, used by 37% of listings.
- There's a relatively balanced mix between guest-friendly (59.2%) and stricter (40.7%) policies, offering choices for different guest needs.
- Strict cancellation policies are quite rare (3.7%), potentially making listings with this policy less competitive unless justified by high demand or property type.
Recommendations for Hosts
- Consider adopting a Firm policy to align with the 37% market standard in Santa Margarita.
- Using a Strict policy might deter some guests, as only 3.7% of listings use it. Evaluate if potential revenue protection outweighs possible lower booking rates.
- Regularly review your cancellation policy against competitors and market demand shifts in Santa Margarita.
Santa Margarita STR Booking Lead Time Analysis (2026)
Average Booking Lead Time by Month
Booking Lead Time Insights for Santa Margarita
- The overall average booking lead time for vacation rentals in Santa Margarita is 64 days.
- Guests book furthest in advance for stays during May (average 88 days), likely coinciding with peak travel demand or local events.
- The shortest booking windows occur for stays in December (average 42 days), indicating more last-minute travel plans during this time.
- Seasonally, Fall (73 days avg.) sees the longest lead times, while Winter (48 days avg.) has the shortest, reflecting typical travel planning cycles.
Recommendations for Hosts
- Use the overall average lead time (64 days) as a baseline for your pricing and availability strategy in Santa Margarita.
- For May stays, consider implementing length-of-stay discounts or slightly higher rates for bookings made less than 88 days out to capitalize on advance planning.
- Target marketing efforts for the Fall season well in advance (at least 73 days) to capture early planners.
- Monitor your own booking lead times against these Santa Margarita averages to identify opportunities for dynamic pricing adjustments.
Popular & Essential Airbnb Amenities in Santa Margarita (2026)
Amenity Prevalence
Amenity Insights for Santa Margarita
- Essential amenities in Santa Margarita that guests expect include: Kitchen, Essentials, Free parking on premises, Fire extinguisher. Lacking these (any) could significantly impact bookings.
- Popular amenities like Dishes and silverware, Cooking basics, Refrigerator are common but not universal. Offering these can provide a competitive edge.
Recommendations for Hosts
- Ensure your listing includes all essential amenities for Santa Margarita: Kitchen, Essentials, Free parking on premises, Fire extinguisher.
- Prioritize adding missing essentials: Fire extinguisher.
- Consider adding popular differentiators like Dishes and silverware or Cooking basics to increase appeal.
- Highlight unique or less common amenities you offer (e.g., hot tub, dedicated workspace, EV charger) in your listing description and photos.
- Regularly check competitor amenities in Santa Margarita to stay competitive.
Santa Margarita Airbnb Guest Demographics & Profile Analysis (2026)
Guest Profile Summary for Santa Margarita
- The typical guest profile for Airbnb in Santa Margarita consists of primarily domestic travelers (96%), often arriving from nearby Los Angeles, typically belonging to the Post-2000s (Gen Z/Alpha) group (50%), primarily speaking English or Spanish.
- Domestic travelers account for 95.5% of guests.
- Key international markets include United States (95.5%) and Canada (1.3%).
- Top languages spoken are English (68.1%) followed by Spanish (13.9%).
- A significant demographic segment is the Post-2000s (Gen Z/Alpha) group, representing 50% of guests.
Recommendations for Hosts
- Target domestic marketing efforts towards travelers from Los Angeles and San Francisco.
- Tailor amenities and listing descriptions to appeal to the dominant Post-2000s (Gen Z/Alpha) demographic (e.g., highlight fast WiFi, smart home features, local guides).
- Highlight unique local experiences or amenities relevant to the primary guest profile.
- Consider seasonal promotions aligned with peak travel times for key origin markets.
Nearby Short-Term Rental Market Comparison
How does the Santa Margarita Airbnb market stack up against its neighbors? Compare key performance metrics like average monthly revenue, ADR, and occupancy rates in surrounding areas to understand the broader regional STR landscape.
| Market | Active Properties | Monthly Revenue | Daily Rate | Avg. Occupancy |
|---|---|---|---|---|
| Carmel Point | 15 | $14,483 | $1046.17 | 54% |
| Montecito | 127 | $10,744 | $950.35 | 51% |
| Del Monte Forest | 105 | $10,280 | $964.89 | 47% |
| Carmel-by-the-Sea | 305 | $8,657 | $680.02 | 49% |
| Pleasure Point | 90 | $7,920 | $525.95 | 52% |
| Carmel | 29 | $7,901 | $597.00 | 49% |
| Castroville | 16 | $7,830 | $558.55 | 50% |
| Sand City | 10 | $7,391 | $497.43 | 60% |
| Del Rey Oaks | 33 | $7,281 | $474.67 | 54% |
| Los Olivos | 30 | $7,240 | $705.20 | 43% |