Santa Margarita Ranchos Airbnb Market Analysis 2025: Short Term Rental Data & Vacation Rental Statistics in California, United States
Is Airbnb profitable in Santa Margarita Ranchos in 2025? Explore comprehensive Airbnb analytics for Santa Margarita Ranchos, California, United States to uncover income potential. This 2025 STR market report for Santa Margarita Ranchos, based on AirROI data from November 2024 to October 2025, reveals key trends in the niche market of 18 active listings.
Whether you're considering an Airbnb investment in Santa Margarita Ranchos, optimizing your existing vacation rental, or exploring rental arbitrage opportunities, understanding the Santa Margarita Ranchos Airbnb data is crucial. Leveraging the low regulation environment is key to maximizing your short term rental income potential. Let's dive into the specifics.
Key Santa Margarita Ranchos Airbnb Performance Metrics Overview
Monthly Airbnb Revenue Variations & Income Potential in Santa Margarita Ranchos (2025)
Understanding the monthly revenue variations for Airbnb listings in Santa Margarita Ranchos is key to maximizing your short term rental income potential. Seasonality significantly impacts earnings. Our analysis, based on data from the past 12 months, shows that the peak revenue month for STRs in Santa Margarita Ranchos is typically May, while September often presents the lowest earnings, highlighting opportunities for strategic pricing adjustments during shoulder and low seasons. Explore the typical Airbnb income in Santa Margarita Ranchos across different performance tiers:
- Best-in-class properties (Top 10%) achieve $20,495+ monthly, often utilizing dynamic pricing and superior guest experiences.
- Strong performing properties (Top 25%) earn $11,504 or more, indicating effective management and desirable locations/amenities.
- Typical properties (Median) generate around $2,729 per month, representing the average market performance.
- Entry-level properties (Bottom 25%) see earnings around $1,114, often with potential for optimization.
Average Monthly Airbnb Earnings Trend in Santa Margarita Ranchos
Santa Margarita Ranchos Airbnb Occupancy Rate Trends (2025)
Maximize your bookings by understanding the Santa Margarita Ranchos STR occupancy trends. Seasonal demand shifts significantly influence how often properties are booked. Typically, Junesees the highest demand (peak season occupancy), while September experiences the lowest (low season). Effective strategies, like adjusting minimum stays or offering promotions, can boost occupancy during slower periods. Here's how different property tiers perform in Santa Margarita Ranchos:
- Best-in-class properties (Top 10%) achieve 64%+ occupancy, indicating high desirability and potentially optimized availability.
- Strong performing properties (Top 25%) maintain 46% or higher occupancy, suggesting good market fit and guest satisfaction.
- Typical properties (Median) have an occupancy rate around 32%.
- Entry-level properties (Bottom 25%) average 20% occupancy, potentially facing higher vacancy.
Average Monthly Occupancy Rate Trend in Santa Margarita Ranchos
Average Daily Rate (ADR) Airbnb Trends in Santa Margarita Ranchos (2025)
Effective short term rental pricing strategy in Santa Margarita Ranchos involves understanding monthly ADR fluctuations. The Average Daily Rate (ADR) for Airbnb in Santa Margarita Ranchos typically peaks in May and dips lowest during September. Leveraging Airbnb dynamic pricing tools or strategies based on this seasonality can significantly boost revenue. Here's a look at the typical nightly rates achieved:
- Best-in-class properties (Top 10%) command rates of $1,287+ per night, often due to premium features or locations.
- Strong performing properties (Top 25%) achieve nightly rates of $999 or more.
- Typical properties (Median) charge around $283 per night.
- Entry-level properties (Bottom 25%) earn around $164 per night.
Average Daily Rate (ADR) Trend by Month in Santa Margarita Ranchos
Get Live Santa Margarita Ranchos Market Intelligence 👇

Explore Real-time Analytics
Airbnb Seasonality Analysis & Trends in Santa Margarita Ranchos (2025)
Peak Season (May, December, June)
- Revenue averages $9,474 per month
- Occupancy rates average 40.4%
- Daily rates average $566
Shoulder Season
- Revenue averages $7,503 per month
- Occupancy maintains around 36.1%
- Daily rates hold near $529
Low Season (February, September, October)
- Revenue drops to average $5,284 per month
- Occupancy decreases to average 30.0%
- Daily rates adjust to average $503
Seasonality Insights for Santa Margarita Ranchos
- The Airbnb seasonality in Santa Margarita Ranchos shows moderate seasonality with distinct peak and low periods. While the sections above show seasonal averages, it's also insightful to look at the extremes:
- During the high season, the absolute peak month showcases Santa Margarita Ranchos's highest earning potential, with monthly revenues capable of climbing to $9,567, occupancy reaching a high of 42.2%, and ADRs peaking at $594.
- Conversely, the slowest single month of the year, typically falling within the low season, marks the market's lowest point. In this month, revenue might dip to $5,094, occupancy could drop to 26.7%, and ADRs may adjust down to $485.
- Understanding both the seasonal averages and these monthly peaks and troughs in revenue, occupancy, and ADR is crucial for maximizing your Airbnb profit potential in Santa Margarita Ranchos.
Seasonal Strategies for Maximizing Profit
- Peak Season: Maximize revenue through premium pricing and potentially longer minimum stays. Ensure high availability.
- Low Season: Offer competitive pricing, special promotions (e.g., extended stay discounts), and flexible cancellation policies. Target off-season travelers like remote workers or budget-conscious guests.
- Shoulder Seasons: Implement dynamic pricing that balances peak and low rates. Target weekend travelers or specific events. Offer slightly more flexible terms than peak season.
- Regularly analyze your own performance against these Santa Margarita Ranchos seasonality benchmarks and adjust your pricing and availability strategy accordingly.
Best Areas for Airbnb Investment in Santa Margarita Ranchos (2025)
Exploring the top neighborhoods for short-term rentals in Santa Margarita Ranchos? This section highlights key areas, outlining why they are attractive for hosts and guests, along with notable local attractions. Consider these locations based on your target guest profile and investment strategy.
| Neighborhood / Area | Why Host Here? (Target Guests & Appeal) | Key Attractions & Landmarks |
|---|---|---|
| Paso Robles | Famous for its wineries and growing culinary scene, Paso Robles attracts visitors looking for wine tasting experiences and beautiful landscapes. | Justin Winery, Eberle Winery, Paso Robles Downtown City Park, Sensorio Field of Light, Estrella Warbird Museum |
| San Luis Obispo | A lively college town known for its charming downtown and proximity to stunning beaches, perfect for those looking to explore central coast California. | San Luis Obispo Mission, Bubblegum Alley, San Luis Obispo Farmers Market, California Polytechnic State University, Montana de Oro State Park |
| Cambria | Quaint coastal village renowned for its natural beauty and artistic community, drawing visitors looking for relaxation and inspiration. | Moonstone Beach, Hearst Castle, Cambria's East Village, William Randolph Hearst State Park, Fiscalini Ranch Preserve |
| Morro Bay | A picturesque seaside town famous for its ocean views and outdoor activities, ideal for nature lovers and water sports enthusiasts. | Morro Rock, Morro Bay State Park, Kayaking in the Bay, Elfin Forest, Morro Bay Aquarium |
| Big Sur | Stunning coastline with dramatic cliffs and abundant natural beauty, attracting those seeking adventure and breathtaking views. | Pfeiffer Beach, McWay Falls, Big Sur River, Point Lobos State Natural Reserve, Julia Pfeiffer Burns State Park |
| Napa Valley | World-famous wine region with luxurious wineries and beautiful scenery, enticing visitors for vineyard tours and gourmet dining. | Napa Valley Wine Train, Castello di Amorosa, Bothe-Napa State Park, Napa Riverfront, Oxbow Public Market |
| Atascadero | A family-friendly town with parks and attractions, perfect for those interested in a laid-back atmosphere and outdoor activities. | Charles Paddock Zoo, Atascadero Lake Park, Colonel Butler Park, Sunken Gardens, Atascadero Historical Museum |
| Santa Barbara | Gorgeous coastal city known for its Mediterranean-style architecture, beaches, and cultural attractions, drawing a wide range of travelers. | Santa Barbara Mission, Stearns Wharf, Santa Barbara Zoo, State Street Shopping, East Beach |
Understanding Airbnb License Requirements & STR Laws in Santa Margarita Ranchos (2025)
While Santa Margarita Ranchos, California, United States currently shows low STR regulations, specific Airbnb license requirements might still exist or change. Always verify the latest short term rental regulations and Airbnb license requirements directly with local government authorities for Santa Margarita Ranchos to ensure full compliance before hosting.
(Source: AirROI data, 2025, based on 6% licensed listings)
Top Performing Airbnb Properties in Santa Margarita Ranchos (2025)
Benchmark your potential! Explore examples of top-performing Airbnb properties in Santa Margarita Ranchosbased on Trailing Twelve Month (TTM) revenue. Analyze their characteristics, revenue, occupancy rate, and ADR to understand what drives success in this market.
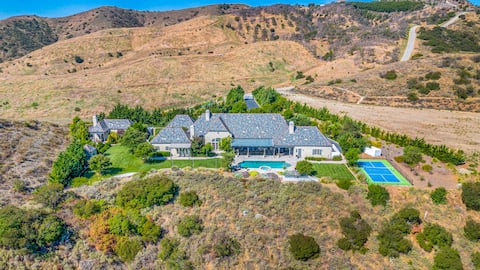
5,400 ft² Mansion Estate | Pickleball, Gym, Games
Entire Place • 7 bedrooms

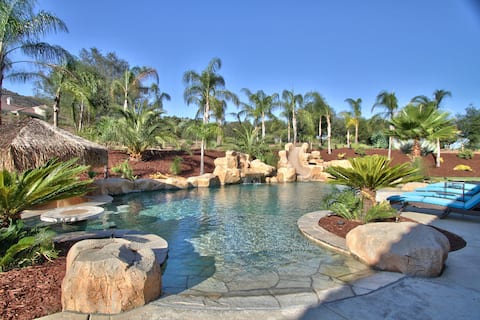
Luxury home w/ breathtaking views on Avocado Grove
Entire Place • 3 bedrooms

Grapevine by AvantStay | 4 AC of Vineyards/Groves
Entire Place • 5 bedrooms
Santa Rosa -Exclusive Resort style estate Temecula
Entire Place • 5 bedrooms
Luxury Home - Temecula Whole House
Entire Place • 6 bedrooms

HAYS Family Estate , Temecula Ca. 92590.
Entire Place • 6 bedrooms
Note: Performance varies based on location, size, amenities, seasonality, and management quality. Data reflects the past 12 months.
Top Performing Airbnb Hosts in Santa Margarita Ranchos (2025)
Learn from the best! This table showcases top-performing Airbnb hosts in Santa Margarita Ranchos based on the number of properties managed and estimated total revenue over the past year. Analyze their scale and performance metrics.
| Host Name | Properties | Grossing Revenue | Stay Reviews | Avg Rating |
|---|---|---|---|---|
| Casa Vinedo | 1 | $300,637 | 16 | 4.56/5.0 |
| Scott | 1 | $257,846 | 36 | 5.00/5.0 |
| AvantStay Temecula | 1 | $173,953 | 63 | 4.73/5.0 |
| Roci | 5 | $173,921 | 727 | 4.88/5.0 |
| Perfectgetaways | 1 | $154,074 | 35 | 4.94/5.0 |
| Larry | 1 | $110,110 | 145 | 4.70/5.0 |
| Catherine | 1 | $74,444 | 29 | 4.93/5.0 |
| Taniths | 2 | $41,876 | 104 | 4.80/5.0 |
| John | 1 | $28,143 | 96 | 4.65/5.0 |
| Lumta | 1 | $26,055 | 64 | 4.91/5.0 |
Analyzing the strategies of top hosts, such as their property selection, pricing, and guest communication, can offer valuable lessons for optimizing your own Airbnb operations in Santa Margarita Ranchos.
Dive Deeper: Advanced Santa Margarita Ranchos STR Market Data (2025)
Ready to unlock more insights? AirROI provides access to advanced metrics and comprehensive Airbnb data for Santa Margarita Ranchos. Explore detailed analytics beyond this report to refine your investment strategy, optimize pricing, and maximize your vacation rental profits.
Explore Advanced MetricsSanta Margarita Ranchos Short-Term Rental Market Composition (2025): Property & Room Types
Room Type Distribution
Property Type Distribution
Market Composition Insights for Santa Margarita Ranchos
- The Santa Margarita Ranchos Airbnb market composition is heavily skewed towards Entire Home/Apt listings, which make up 77.8% of the 18 active rentals. This indicates strong guest preference for privacy and space.
- Looking at the property type distribution in Santa Margarita Ranchos, House properties are the most common (72.2%), reflecting the local real estate landscape.
- Houses represent a significant 72.2% portion, catering likely to families or larger groups.
- The presence of 11.1% Hotel/Boutique listings indicates integration with traditional hospitality.
Santa Margarita Ranchos Airbnb Room Capacity Analysis (2025): Bedroom Distribution
Distribution of Listings by Number of Bedrooms
Room Capacity Insights for Santa Margarita Ranchos
- The dominant room capacity in Santa Margarita Ranchos is 5+ bedrooms listings, making up 27.8% of the market. This suggests a strong demand for properties suitable for families or small groups.
- Together, 5+ bedrooms and 1 bedroom properties represent 50.0% of the active Airbnb listings in Santa Margarita Ranchos, indicating a high concentration in these sizes.
- A significant 44.5% of listings offer 3+ bedrooms, catering to larger groups and families seeking more space in Santa Margarita Ranchos.
Santa Margarita Ranchos Vacation Rental Guest Capacity Trends (2025)
Distribution of Listings by Guest Capacity
Guest Capacity Insights for Santa Margarita Ranchos
- The most common guest capacity trend in Santa Margarita Ranchos vacation rentals is listings accommodating 8+ guests (33.3%). This suggests the primary traveler segment is likely larger groups.
- Properties designed for 8+ guests and 6 guests dominate the Santa Margarita Ranchos STR market, accounting for 50.0% of listings.
- 50.0% of properties accommodate 6+ guests, serving the market segment for larger families or group travel in Santa Margarita Ranchos.
- On average, properties in Santa Margarita Ranchos are equipped to host 4.4 guests.
Santa Margarita Ranchos Airbnb Booking Patterns (2025): Available vs. Booked Days
Available Days Distribution
Booked Days Distribution
Booking Pattern Insights for Santa Margarita Ranchos
- The most common availability pattern in Santa Margarita Ranchos falls within the 271-366 days range, representing 50% of listings. This suggests many properties have significant open periods on their calendars.
- Approximately 83.3% of listings show high availability (181+ days open annually), indicating potential for increased bookings or specific owner usage patterns.
- For booked days, the 91-180 days range is most frequent in Santa Margarita Ranchos (44.4%), reflecting common guest stay durations or potential owner blocking patterns.
- A notable 16.7% of properties secure long booking periods (181+ days booked per year), highlighting successful long-term rental strategies or significant owner usage.
Santa Margarita Ranchos Airbnb Minimum Stay Requirements Analysis
Distribution of Listings by Minimum Night Requirement
1 Night
6 listings
33.3% of total
2 Nights
4 listings
22.2% of total
4-6 Nights
1 listings
5.6% of total
7-29 Nights
1 listings
5.6% of total
30+ Nights
6 listings
33.3% of total
Key Insights
- The most prevalent minimum stay requirement in Santa Margarita Ranchos is 1 Night, adopted by 33.3% of listings. This highlights the market's preference for shorter, flexible bookings.
- A significant segment (33.3%) caters to monthly stays (30+ nights) in Santa Margarita Ranchos, pointing to opportunities in the extended-stay market.
Recommendations
- Align with the market by considering a 1 Night minimum stay, as 33.3% of Santa Margarita Ranchos hosts use this setting.
- Explore offering discounts for stays of 30+ nights to attract the 33.3% of the market seeking extended stays.
- Adjust minimum nights based on seasonality – potentially shorter during low season and longer during peak demand periods in Santa Margarita Ranchos.
Santa Margarita Ranchos Airbnb Cancellation Policy Trends Analysis (2025)
Flexible
7 listings
38.9% of total
Moderate
2 listings
11.1% of total
Firm
6 listings
33.3% of total
Strict
3 listings
16.7% of total
Cancellation Policy Insights for Santa Margarita Ranchos
- The prevailing Airbnb cancellation policy trend in Santa Margarita Ranchos is Flexible, used by 38.9% of listings.
- There's a relatively balanced mix between guest-friendly (50.0%) and stricter (50.0%) policies, offering choices for different guest needs.
Recommendations for Hosts
- Consider adopting a Flexible policy to align with the 38.9% market standard in Santa Margarita Ranchos.
- Regularly review your cancellation policy against competitors and market demand shifts in Santa Margarita Ranchos.
Santa Margarita Ranchos STR Booking Lead Time Analysis (2025)
Average Booking Lead Time by Month
Booking Lead Time Insights for Santa Margarita Ranchos
- The overall average booking lead time for vacation rentals in Santa Margarita Ranchos is 44 days.
- Guests book furthest in advance for stays during October (average 90 days), likely coinciding with peak travel demand or local events.
- The shortest booking windows occur for stays in January (average 20 days), indicating more last-minute travel plans during this time.
- Seasonally, Fall (66 days avg.) sees the longest lead times, while Winter (32 days avg.) has the shortest, reflecting typical travel planning cycles.
Recommendations for Hosts
- Use the overall average lead time (44 days) as a baseline for your pricing and availability strategy in Santa Margarita Ranchos.
- For October stays, consider implementing length-of-stay discounts or slightly higher rates for bookings made less than 90 days out to capitalize on advance planning.
- Target marketing efforts for the Fall season well in advance (at least 66 days) to capture early planners.
- Monitor your own booking lead times against these Santa Margarita Ranchos averages to identify opportunities for dynamic pricing adjustments.
Popular & Essential Airbnb Amenities in Santa Margarita Ranchos (2025)
Amenity Prevalence
Amenity Insights for Santa Margarita Ranchos
- Essential amenities in Santa Margarita Ranchos that guests expect include: Heating, Kitchen, Carbon monoxide alarm, Smoke alarm, Wifi, Air conditioning. Lacking these (any) could significantly impact bookings.
- Popular amenities like Essentials, Free parking on premises, TV are common but not universal. Offering these can provide a competitive edge.
Recommendations for Hosts
- Ensure your listing includes all essential amenities for Santa Margarita Ranchos: Heating, Kitchen, Carbon monoxide alarm, Smoke alarm, Wifi, Air conditioning.
- Consider adding popular differentiators like Essentials or Free parking on premises to increase appeal.
- Highlight unique or less common amenities you offer (e.g., hot tub, dedicated workspace, EV charger) in your listing description and photos.
- Regularly check competitor amenities in Santa Margarita Ranchos to stay competitive.
Santa Margarita Ranchos Airbnb Guest Demographics & Profile Analysis (2025)
Guest Profile Summary for Santa Margarita Ranchos
- The typical guest profile for Airbnb in Santa Margarita Ranchos consists of primarily domestic travelers (94%), often arriving from nearby Los Angeles, typically belonging to the Post-2000s (Gen Z/Alpha) group (50%), primarily speaking English or Spanish.
- Domestic travelers account for 94.3% of guests.
- Key international markets include United States (94.3%) and United Kingdom (2.5%).
- Top languages spoken are English (64%) followed by Spanish (22%).
- A significant demographic segment is the Post-2000s (Gen Z/Alpha) group, representing 50% of guests.
Recommendations for Hosts
- Target domestic marketing efforts towards travelers from Los Angeles and San Diego.
- Tailor amenities and listing descriptions to appeal to the dominant Post-2000s (Gen Z/Alpha) demographic (e.g., highlight fast WiFi, smart home features, local guides).
- Highlight unique local experiences or amenities relevant to the primary guest profile.
- Consider seasonal promotions aligned with peak travel times for key origin markets.
Nearby Short-Term Rental Market Comparison
How does the Santa Margarita Ranchos Airbnb market stack up against its neighbors? Compare key performance metrics like average monthly revenue, ADR, and occupancy rates in surrounding areas to understand the broader regional STR landscape.
| Market | Active Properties | Monthly Revenue | Daily Rate | Avg. Occupancy |
|---|---|---|---|---|
| Rancho San Diego | 26 | $9,412 | $606.80 | 50% |
| Thousand Palms | 32 | $9,261 | $807.36 | 39% |
| Newport Beach | 1,204 | $9,007 | $746.06 | 46% |
| Manhattan Beach | 253 | $8,130 | $594.48 | 52% |
| Malibu | 271 | $7,824 | $1271.47 | 35% |
| GlenOak Hills | 40 | $7,676 | $677.36 | 40% |
| Bermuda Dunes | 138 | $7,652 | $675.77 | 40% |
| La Palma | 10 | $7,624 | $357.85 | 55% |
| Del Mar | 113 | $7,530 | $642.40 | 46% |
| Lakeside | 33 | $7,280 | $617.49 | 41% |