Santa Maria Airbnb Market Analysis 2026: Short Term Rental Data & Vacation Rental Statistics in California, United States
Is Airbnb profitable in Santa Maria in 2026? Explore comprehensive Airbnb analytics for Santa Maria, California, United States to uncover income potential. This 2026 STR market report for Santa Maria, based on AirROI data from February 2025 to January 2026, reveals key trends in the niche market of 48 active listings.
Whether you're considering an Airbnb investment in Santa Maria, optimizing your existing vacation rental, or exploring rental arbitrage opportunities, understanding the Santa Maria Airbnb data is crucial. Leveraging the low regulation environment is key to maximizing your short term rental income potential. Let's dive into the specifics.
Key Santa Maria Airbnb Performance Metrics Overview
Monthly Airbnb Revenue Variations & Income Potential in Santa Maria (2026)
Understanding the monthly revenue variations for Airbnb listings in Santa Maria is key to maximizing your short term rental income potential. Seasonality significantly impacts earnings. Our analysis, based on data from the past 12 months, shows that the peak revenue month for STRs in Santa Maria is typically April, while January often presents the lowest earnings, highlighting opportunities for strategic pricing adjustments during shoulder and low seasons. Explore the typical Airbnb income in Santa Maria across different performance tiers:
- Best-in-class properties (Top 10%) achieve $5,747+ monthly, often utilizing dynamic pricing and superior guest experiences.
- Strong performing properties (Top 25%) earn $3,619 or more, indicating effective management and desirable locations/amenities.
- Typical properties (Median) generate around $1,820 per month, representing the average market performance.
- Entry-level properties (Bottom 25%) see earnings around $884, often with potential for optimization.
Average Monthly Airbnb Earnings Trend in Santa Maria
Santa Maria Airbnb Occupancy Rate Trends (2026)
Maximize your bookings by understanding the Santa Maria STR occupancy trends. Seasonal demand shifts significantly influence how often properties are booked. Typically, Augustsees the highest demand (peak season occupancy), while January experiences the lowest (low season). Effective strategies, like adjusting minimum stays or offering promotions, can boost occupancy during slower periods. Here's how different property tiers perform in Santa Maria:
- Best-in-class properties (Top 10%) achieve 77%+ occupancy, indicating high desirability and potentially optimized availability.
- Strong performing properties (Top 25%) maintain 64% or higher occupancy, suggesting good market fit and guest satisfaction.
- Typical properties (Median) have an occupancy rate around 44%.
- Entry-level properties (Bottom 25%) average 25% occupancy, potentially facing higher vacancy.
Average Monthly Occupancy Rate Trend in Santa Maria
Average Daily Rate (ADR) Airbnb Trends in Santa Maria (2026)
Effective short term rental pricing strategy in Santa Maria involves understanding monthly ADR fluctuations. The Average Daily Rate (ADR) for Airbnb in Santa Maria typically peaks in June and dips lowest during January. Leveraging Airbnb dynamic pricing tools or strategies based on this seasonality can significantly boost revenue. Here's a look at the typical nightly rates achieved:
- Best-in-class properties (Top 10%) command rates of $364+ per night, often due to premium features or locations.
- Strong performing properties (Top 25%) achieve nightly rates of $260 or more.
- Typical properties (Median) charge around $123 per night.
- Entry-level properties (Bottom 25%) earn around $73 per night.
Average Daily Rate (ADR) Trend by Month in Santa Maria
Get Live Santa Maria Market Intelligence 👇

Explore Real-time Analytics
Airbnb Seasonality Analysis & Trends in Santa Maria (2026)
Peak Season (April, August, June)
- Revenue averages $3,164 per month
- Occupancy rates average 49.8%
- Daily rates average $183
Shoulder Season
- Revenue averages $2,700 per month
- Occupancy maintains around 46.0%
- Daily rates hold near $174
Low Season (January, February, November)
- Revenue drops to average $1,980 per month
- Occupancy decreases to average 38.5%
- Daily rates adjust to average $162
Seasonality Insights for Santa Maria
- The Airbnb seasonality in Santa Maria shows moderate seasonality with distinct peak and low periods. While the sections above show seasonal averages, it's also insightful to look at the extremes:
- During the high season, the absolute peak month showcases Santa Maria's highest earning potential, with monthly revenues capable of climbing to $3,230, occupancy reaching a high of 51.8%, and ADRs peaking at $189.
- Conversely, the slowest single month of the year, typically falling within the low season, marks the market's lowest point. In this month, revenue might dip to $1,429, occupancy could drop to 31.7%, and ADRs may adjust down to $159.
- Understanding both the seasonal averages and these monthly peaks and troughs in revenue, occupancy, and ADR is crucial for maximizing your Airbnb profit potential in Santa Maria.
Seasonal Strategies for Maximizing Profit
- Peak Season: Maximize revenue through premium pricing and potentially longer minimum stays. Ensure high availability.
- Low Season: Offer competitive pricing, special promotions (e.g., extended stay discounts), and flexible cancellation policies. Target off-season travelers like remote workers or budget-conscious guests.
- Shoulder Seasons: Implement dynamic pricing that balances peak and low rates. Target weekend travelers or specific events. Offer slightly more flexible terms than peak season.
- Regularly analyze your own performance against these Santa Maria seasonality benchmarks and adjust your pricing and availability strategy accordingly.
Best Areas for Airbnb Investment in Santa Maria (2026)
Exploring the top neighborhoods for short-term rentals in Santa Maria? This section highlights key areas, outlining why they are attractive for hosts and guests, along with notable local attractions. Consider these locations based on your target guest profile and investment strategy.
| Neighborhood / Area | Why Host Here? (Target Guests & Appeal) | Key Attractions & Landmarks |
|---|---|---|
| Downtown Santa Maria | The vibrant heart of Santa Maria, known for its dining, shopping, and entertainment options. Ideal for travelers seeking convenience and access to local attractions. | Santa Maria Valley Discovery Museum, Santa Maria Civic Theatre, Elwin Mussell Center, Santa Maria Town Center, Dallidet Adobe and Gardens |
| Orcutt | A charming suburban area that offers a quieter, family-friendly atmosphere while still being close to Santa Maria's amenities. Popular among families and those looking for a tranquil stay. | Historic Orcutt Depot, Catedrales del Vino, Orcutt Community Park, Skyway Drive-in Theatre, Rancho Maria Golf Club |
| Nipomo | A picturesque community located just south of Santa Maria, known for its beautiful landscapes and proximity to hiking trails. Appeals to nature lovers and outdoor enthusiasts. | Nipomo Community Park, Blacklake Golf Resort, Oso Flaco Lake, Nipomo Regional Park, Nipomo Dog Park |
| Old Town | Rich in history and character, this area showcases antique shops, local eateries, and cultural landmarks, attracting visitors interested in Santa Maria's heritage. | Old Town Market, Mural District, Historic Downtown Santa Maria, Local Art Galleries |
| Santa Maria Valley | Famous for its vineyards and agriculture, this area draws wine enthusiasts and those looking to experience local wine tasting and farm-to-table dining. | Santa Maria Valley Wine Trail, Cambria Winery, Domaine de Sabine, Santa Barbara County Fair, Local Vineyards |
| Guadalupe | A small town with a strong cultural influence, notably Chicano culture, known for its unique art and local festivals. Offers visitors an authentic experience. | Guadalupe-Nipomo Dunes National Wildlife Refuge, Historic Guadalupe Cemetery, Cultural Festivals |
| Skyway | A newly developed area with modern amenities and easy access to major highways, making it a preferred spot for business travelers and tourists alike. | Santa Maria Regional Airport, Local Shopping Centers, Access to Highways |
| Betteravia | A residential area with great access to nearby attractions and a community feel, appealing to families and longer-term visitors looking for comfort and convenience. | Santa Maria Bonita School District, Nearby Parks and Recreational Areas |
Understanding Airbnb License Requirements & STR Laws in Santa Maria (2026)
While Santa Maria, California, United States currently shows low STR regulations, specific Airbnb license requirements might still exist or change. Always verify the latest short term rental regulations and Airbnb license requirements directly with local government authorities for Santa Maria to ensure full compliance before hosting.
(Source: AirROI data, 2026, finding no licensed listings among those analyzed)
Top Performing Airbnb Properties in Santa Maria (2026)
Benchmark your potential! Explore examples of top-performing Airbnb properties in Santa Mariabased on Trailing Twelve Month (TTM) revenue. Analyze their characteristics, revenue, occupancy rate, and ADR to understand what drives success in this market.

Pet-Friendly, Stylish Home w/ Backyard Oasis
Entire Place • 2 bedrooms

Updated 3 Bd Home | Pet Friendly | Backyard Oasis
Entire Place • 3 bedrooms
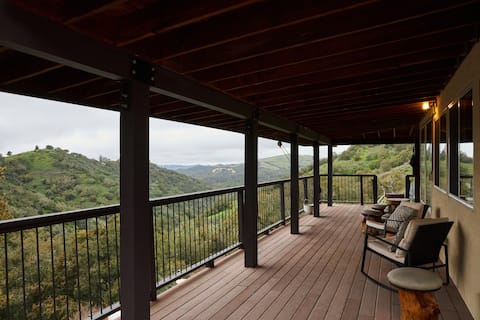
The Canyon Retreat
Entire Place • 3 bedrooms
La Hacienda Grande
Entire Place • 4 bedrooms

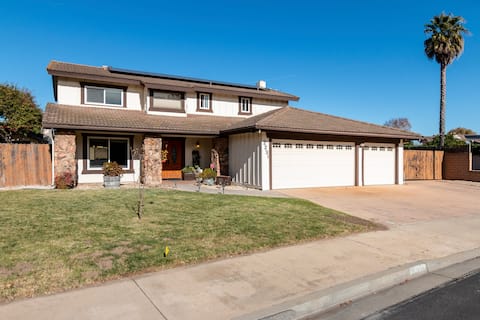
Beautiful Home, Central Coast
Entire Place • 4 bedrooms

Cozy home near hospital & 101 Remodeled Bathrooms!
Entire Place • 3 bedrooms
Note: Performance varies based on location, size, amenities, seasonality, and management quality. Data reflects the past 12 months.
Top Performing Airbnb Hosts in Santa Maria (2026)
Learn from the best! This table showcases top-performing Airbnb hosts in Santa Maria based on the number of properties managed and estimated total revenue over the past year. Analyze their scale and performance metrics.
| Host Name | Properties | Grossing Revenue | Stay Reviews | Avg Rating |
|---|---|---|---|---|
| Eryka | 3 | $225,269 | 196 | 4.88/5.0 |
| Genie | 2 | $90,912 | 119 | 4.83/5.0 |
| Melissa And Toby | 1 | $79,882 | 69 | 4.74/5.0 |
| Melissa | 2 | $75,443 | 310 | 4.91/5.0 |
| Travis | 1 | $67,651 | 51 | 4.86/5.0 |
| Ricardo | 1 | $65,357 | 375 | 4.93/5.0 |
| Jesus | 2 | $42,773 | 37 | 4.80/5.0 |
| Donna | 1 | $40,128 | 274 | 4.88/5.0 |
| Donnelle And Jeff | 1 | $38,551 | 60 | 4.77/5.0 |
| Mari | 2 | $37,805 | 758 | 4.78/5.0 |
Analyzing the strategies of top hosts, such as their property selection, pricing, and guest communication, can offer valuable lessons for optimizing your own Airbnb operations in Santa Maria.
Dive Deeper: Advanced Santa Maria STR Market Data (2026)
Ready to unlock more insights? AirROI provides access to advanced metrics and comprehensive Airbnb data for Santa Maria. Explore detailed analytics beyond this report to refine your investment strategy, optimize pricing, and maximize your vacation rental profits.
Explore Advanced MetricsSanta Maria Short-Term Rental Market Composition (2026): Property & Room Types
Room Type Distribution
Property Type Distribution
Market Composition Insights for Santa Maria
- The Santa Maria Airbnb market composition is heavily skewed towards Entire Home/Apt listings, which make up 60.4% of the 48 active rentals. This indicates strong guest preference for privacy and space.
- However, a notable 37.5% share for Private Rooms suggests opportunities for budget-conscious travelers or hosts renting out spare rooms.
- Looking at the property type distribution in Santa Maria, House properties are the most common (64.6%), reflecting the local real estate landscape.
- Houses represent a significant 64.6% portion, catering likely to families or larger groups.
- The presence of 20.8% Hotel/Boutique listings indicates integration with traditional hospitality.
Santa Maria Airbnb Room Capacity Analysis (2026): Bedroom Distribution
Distribution of Listings by Number of Bedrooms
Room Capacity Insights for Santa Maria
- The dominant room capacity in Santa Maria is 1 bedroom listings, making up 29.2% of the market. This suggests a strong demand for properties suitable for couples or solo travelers.
- Together, 1 bedroom and 2 bedrooms properties represent 43.8% of the active Airbnb listings in Santa Maria, indicating a high concentration in these sizes.
Santa Maria Vacation Rental Guest Capacity Trends (2026)
Distribution of Listings by Guest Capacity
Guest Capacity Insights for Santa Maria
- The most common guest capacity trend in Santa Maria vacation rentals is listings accommodating 2 guests (14.6%). This suggests the primary traveler segment is likely couples or solo travelers.
- Properties designed for 2 guests and 4 guests dominate the Santa Maria STR market, accounting for 29.2% of listings.
- 22.9% of properties accommodate 6+ guests, serving the market segment for larger families or group travel in Santa Maria.
- On average, properties in Santa Maria are equipped to host 2.9 guests.
Santa Maria Airbnb Booking Patterns (2026): Available vs. Booked Days
Available Days Distribution
Booked Days Distribution
Booking Pattern Insights for Santa Maria
- The most common availability pattern in Santa Maria falls within the 271-366 days range, representing 39.6% of listings. This suggests many properties have significant open periods on their calendars.
- Approximately 70.9% of listings show high availability (181+ days open annually), indicating potential for increased bookings or specific owner usage patterns.
- For booked days, the 91-180 days range is most frequent in Santa Maria (35.4%), reflecting common guest stay durations or potential owner blocking patterns.
- A notable 29.2% of properties secure long booking periods (181+ days booked per year), highlighting successful long-term rental strategies or significant owner usage.
Santa Maria Airbnb Minimum Stay Requirements Analysis
Distribution of Listings by Minimum Night Requirement
1 Night
24 listings
50% of total
2 Nights
10 listings
20.8% of total
3 Nights
1 listings
2.1% of total
4-6 Nights
1 listings
2.1% of total
7-29 Nights
4 listings
8.3% of total
30+ Nights
8 listings
16.7% of total
Key Insights
- The most prevalent minimum stay requirement in Santa Maria is 1 Night, adopted by 50% of listings. This highlights the market's preference for shorter, flexible bookings.
- A strong majority (70.8%) of the Santa Maria Airbnb data shows acceptance of very short stays (1-2 nights), indicating a dynamic, high-turnover market.
- A significant segment (16.7%) caters to monthly stays (30+ nights) in Santa Maria, pointing to opportunities in the extended-stay market.
Recommendations
- Align with the market by considering a 1 Night minimum stay, as 50% of Santa Maria hosts use this setting.
- Explore offering discounts for stays of 30+ nights to attract the 16.7% of the market seeking extended stays.
- Adjust minimum nights based on seasonality – potentially shorter during low season and longer during peak demand periods in Santa Maria.
Santa Maria Airbnb Cancellation Policy Trends Analysis (2026)
Limited
3 listings
6.3% of total
Flexible
16 listings
33.3% of total
Moderate
9 listings
18.8% of total
Firm
16 listings
33.3% of total
Strict
4 listings
8.3% of total
Cancellation Policy Insights for Santa Maria
- The prevailing Airbnb cancellation policy trend in Santa Maria is Flexible, used by 33.3% of listings.
- There's a relatively balanced mix between guest-friendly (52.1%) and stricter (41.6%) policies, offering choices for different guest needs.
- Strict cancellation policies are quite rare (8.3%), potentially making listings with this policy less competitive unless justified by high demand or property type.
Recommendations for Hosts
- Consider adopting a Flexible policy to align with the 33.3% market standard in Santa Maria.
- Using a Strict policy might deter some guests, as only 8.3% of listings use it. Evaluate if potential revenue protection outweighs possible lower booking rates.
- Regularly review your cancellation policy against competitors and market demand shifts in Santa Maria.
Santa Maria STR Booking Lead Time Analysis (2026)
Average Booking Lead Time by Month
Booking Lead Time Insights for Santa Maria
- The overall average booking lead time for vacation rentals in Santa Maria is 32 days.
- Guests book furthest in advance for stays during May (average 49 days), likely coinciding with peak travel demand or local events.
- The shortest booking windows occur for stays in December (average 22 days), indicating more last-minute travel plans during this time.
- Seasonally, Summer (37 days avg.) sees the longest lead times, while Winter (23 days avg.) has the shortest, reflecting typical travel planning cycles.
Recommendations for Hosts
- Use the overall average lead time (32 days) as a baseline for your pricing and availability strategy in Santa Maria.
- For May stays, consider implementing length-of-stay discounts or slightly higher rates for bookings made less than 49 days out to capitalize on advance planning.
- Target marketing efforts for the Summer season well in advance (at least 37 days) to capture early planners.
- Monitor your own booking lead times against these Santa Maria averages to identify opportunities for dynamic pricing adjustments.
Popular & Essential Airbnb Amenities in Santa Maria (2026)
Amenity Prevalence
Amenity Insights for Santa Maria
- Essential amenities in Santa Maria that guests expect include: Wifi, Smoke alarm. Lacking these (any) could significantly impact bookings.
- Popular amenities like Hot water, Heating, Fire extinguisher are common but not universal. Offering these can provide a competitive edge.
Recommendations for Hosts
- Ensure your listing includes all essential amenities for Santa Maria: Wifi, Smoke alarm.
- Consider adding popular differentiators like Hot water or Heating to increase appeal.
- Highlight unique or less common amenities you offer (e.g., hot tub, dedicated workspace, EV charger) in your listing description and photos.
- Regularly check competitor amenities in Santa Maria to stay competitive.
Santa Maria Airbnb Guest Demographics & Profile Analysis (2026)
Guest Profile Summary for Santa Maria
- The typical guest profile for Airbnb in Santa Maria consists of primarily domestic travelers (87%), often arriving from nearby Los Angeles, typically belonging to the Post-2000s (Gen Z/Alpha) group (50%), primarily speaking English or Spanish.
- Domestic travelers account for 86.8% of guests.
- Key international markets include United States (86.8%) and Germany (2.9%).
- Top languages spoken are English (55.8%) followed by Spanish (16.7%).
- A significant demographic segment is the Post-2000s (Gen Z/Alpha) group, representing 50% of guests.
Recommendations for Hosts
- Target domestic marketing efforts towards travelers from Los Angeles and San Diego.
- Tailor amenities and listing descriptions to appeal to the dominant Post-2000s (Gen Z/Alpha) demographic (e.g., highlight fast WiFi, smart home features, local guides).
- Highlight unique local experiences or amenities relevant to the primary guest profile.
- Consider seasonal promotions aligned with peak travel times for key origin markets.
Nearby Short-Term Rental Market Comparison
How does the Santa Maria Airbnb market stack up against its neighbors? Compare key performance metrics like average monthly revenue, ADR, and occupancy rates in surrounding areas to understand the broader regional STR landscape.
| Market | Active Properties | Monthly Revenue | Daily Rate | Avg. Occupancy |
|---|---|---|---|---|
| Montecito | 127 | $10,744 | $950.35 | 51% |
| Los Olivos | 30 | $7,240 | $705.20 | 43% |
| Santa Ynez | 119 | $6,967 | $589.34 | 42% |
| Toro Canyon | 33 | $6,935 | $717.58 | 42% |
| Avila Beach | 94 | $6,770 | $582.34 | 41% |
| Summerland | 88 | $6,323 | $494.72 | 49% |
| Santa Paula | 17 | $5,685 | $502.58 | 47% |
| Buellton | 24 | $5,667 | $476.40 | 40% |
| Santa Barbara | 1,001 | $5,642 | $447.90 | 49% |
| Mission Canyon | 34 | $5,270 | $385.19 | 57% |