Santa Ynez Airbnb Market Analysis 2026: Short Term Rental Data & Vacation Rental Statistics in California, United States
Is Airbnb profitable in Santa Ynez in 2026? Explore comprehensive Airbnb analytics for Santa Ynez, California, United States to uncover income potential. This 2026 STR market report for Santa Ynez, based on AirROI data from February 2025 to January 2026, reveals key trends in the niche market of 119 active listings.
Whether you're considering an Airbnb investment in Santa Ynez, optimizing your existing vacation rental, or exploring rental arbitrage opportunities, understanding the Santa Ynez Airbnb data is crucial. Leveraging the low regulation environment is key to maximizing your short term rental income potential. Let's dive into the specifics.
Key Santa Ynez Airbnb Performance Metrics Overview
Monthly Airbnb Revenue Variations & Income Potential in Santa Ynez (2026)
Understanding the monthly revenue variations for Airbnb listings in Santa Ynez is key to maximizing your short term rental income potential. Seasonality significantly impacts earnings. Our analysis, based on data from the past 12 months, shows that the peak revenue month for STRs in Santa Ynez is typically June, while February often presents the lowest earnings, highlighting opportunities for strategic pricing adjustments during shoulder and low seasons. Explore the typical Airbnb income in Santa Ynez across different performance tiers:
- Best-in-class properties (Top 10%) achieve $16,835+ monthly, often utilizing dynamic pricing and superior guest experiences.
- Strong performing properties (Top 25%) earn $9,326 or more, indicating effective management and desirable locations/amenities.
- Typical properties (Median) generate around $5,273 per month, representing the average market performance.
- Entry-level properties (Bottom 25%) see earnings around $3,123, often with potential for optimization.
Average Monthly Airbnb Earnings Trend in Santa Ynez
Santa Ynez Airbnb Occupancy Rate Trends (2026)
Maximize your bookings by understanding the Santa Ynez STR occupancy trends. Seasonal demand shifts significantly influence how often properties are booked. Typically, Junesees the highest demand (peak season occupancy), while January experiences the lowest (low season). Effective strategies, like adjusting minimum stays or offering promotions, can boost occupancy during slower periods. Here's how different property tiers perform in Santa Ynez:
- Best-in-class properties (Top 10%) achieve 74%+ occupancy, indicating high desirability and potentially optimized availability.
- Strong performing properties (Top 25%) maintain 58% or higher occupancy, suggesting good market fit and guest satisfaction.
- Typical properties (Median) have an occupancy rate around 42%.
- Entry-level properties (Bottom 25%) average 27% occupancy, potentially facing higher vacancy.
Average Monthly Occupancy Rate Trend in Santa Ynez
Average Daily Rate (ADR) Airbnb Trends in Santa Ynez (2026)
Effective short term rental pricing strategy in Santa Ynez involves understanding monthly ADR fluctuations. The Average Daily Rate (ADR) for Airbnb in Santa Ynez typically peaks in May and dips lowest during February. Leveraging Airbnb dynamic pricing tools or strategies based on this seasonality can significantly boost revenue. Here's a look at the typical nightly rates achieved:
- Best-in-class properties (Top 10%) command rates of $1,249+ per night, often due to premium features or locations.
- Strong performing properties (Top 25%) achieve nightly rates of $664 or more.
- Typical properties (Median) charge around $420 per night.
- Entry-level properties (Bottom 25%) earn around $276 per night.
Average Daily Rate (ADR) Trend by Month in Santa Ynez
Get Live Santa Ynez Market Intelligence 👇

Explore Real-time Analytics
Airbnb Seasonality Analysis & Trends in Santa Ynez (2026)
Peak Season (June, May, July)
- Revenue averages $9,557 per month
- Occupancy rates average 48.6%
- Daily rates average $624
Shoulder Season
- Revenue averages $7,978 per month
- Occupancy maintains around 44.2%
- Daily rates hold near $593
Low Season (January, February, March)
- Revenue drops to average $6,143 per month
- Occupancy decreases to average 38.2%
- Daily rates adjust to average $577
Seasonality Insights for Santa Ynez
- The Airbnb seasonality in Santa Ynez shows moderate seasonality with distinct peak and low periods. While the sections above show seasonal averages, it's also insightful to look at the extremes:
- During the high season, the absolute peak month showcases Santa Ynez's highest earning potential, with monthly revenues capable of climbing to $9,656, occupancy reaching a high of 51.7%, and ADRs peaking at $637.
- Conversely, the slowest single month of the year, typically falling within the low season, marks the market's lowest point. In this month, revenue might dip to $5,655, occupancy could drop to 32.1%, and ADRs may adjust down to $563.
- Understanding both the seasonal averages and these monthly peaks and troughs in revenue, occupancy, and ADR is crucial for maximizing your Airbnb profit potential in Santa Ynez.
Seasonal Strategies for Maximizing Profit
- Peak Season: Maximize revenue through premium pricing and potentially longer minimum stays. Ensure high availability.
- Low Season: Offer competitive pricing, special promotions (e.g., extended stay discounts), and flexible cancellation policies. Target off-season travelers like remote workers or budget-conscious guests.
- Shoulder Seasons: Implement dynamic pricing that balances peak and low rates. Target weekend travelers or specific events. Offer slightly more flexible terms than peak season.
- Regularly analyze your own performance against these Santa Ynez seasonality benchmarks and adjust your pricing and availability strategy accordingly.
Best Areas for Airbnb Investment in Santa Ynez (2026)
Exploring the top neighborhoods for short-term rentals in Santa Ynez? This section highlights key areas, outlining why they are attractive for hosts and guests, along with notable local attractions. Consider these locations based on your target guest profile and investment strategy.
| Neighborhood / Area | Why Host Here? (Target Guests & Appeal) | Key Attractions & Landmarks |
|---|---|---|
| Downtown Santa Ynez | The historic heart of Santa Ynez, offering charming shops, local dining, and a vibrant community atmosphere. Attracts visitors looking for a small-town experience with local culture. | Santa Ynez Valley Historical Museum, Santa Ynez Winery, Zaca Mesa Winery, Local shops and boutiques, Santa Ynez's unique restaurants |
| Solvang | A Danish-style village famous for its architecture, bakeries, and wine tasting. Perfect for tourists seeking a unique cultural experience close to Santa Ynez. | Solvang Village, Old Mission Santa Ines, Solvang Windmill, Tasting rooms and wineries, Hans Christian Andersen Museum |
| Ballard | A quiet, picturesque town known for its rural charm and proximity to wineries. Great for guests looking for a peaceful retreat. | Ballard Canyon Wine Trail, Scenic countryside views, Local farms, Boutique wineries, Ballard's historic buildings |
| Buena Vista | A residential area known for its wineries and beautiful landscapes. Attractive for those visiting for wine-related tourism. | Wineries and vineyards, Scenic hiking trails, Art galleries, Stunning views of the Santa Ynez mountains, Local farm-to-table restaurants |
| Los Olivos | A quaint town in the heart of wine country, famous for its art galleries and wine tasting rooms. Popular with culinary and wine enthusiasts. | Los Olivos Wine Merchant & Cafe, Cynara Wine Tasting, Art galleries, Santa Barbara Olive Company, Beautiful countryside |
| Sante Fe | A newer development offering luxury accommodations and stunning views. Appeals to travelers looking for modern amenities amidst nature. | Luxury rentals, Open space and hiking trails, Proximity to wine country, Golf courses, Scenic panoramas |
| Santa Barbara | While a bit farther, Santa Barbara attracts millions of visitors with its beaches, cultural sites, and luxury hospitality. Ideal for those wanting urban experiences with coastal charm. | Stearns Wharf, Santa Barbara Mission, State Street shops, Beaches and waterfront, Cultural festivals |
| Flying Flags RV Resort | A family-friendly destination offering unique accommodations in a vintage-style RV park. Excellent for families and larger groups looking for a fun experience. | RV park with unique rentals, Local entertainment, Nearby wine tasting, Outdoor activities, Community events |
Understanding Airbnb License Requirements & STR Laws in Santa Ynez (2026)
While Santa Ynez, California, United States currently shows low STR regulations, specific Airbnb license requirements might still exist or change. Always verify the latest short term rental regulations and Airbnb license requirements directly with local government authorities for Santa Ynez to ensure full compliance before hosting.
(Source: AirROI data, 2026, finding no licensed listings among those analyzed)
Top Performing Airbnb Properties in Santa Ynez (2026)
Benchmark your potential! Explore examples of top-performing Airbnb properties in Santa Ynezbased on Trailing Twelve Month (TTM) revenue. Analyze their characteristics, revenue, occupancy rate, and ADR to understand what drives success in this market.

5BR/Sleeps 16 -Retreat in Santa Ynez Wine Country!
Entire Place • 5 bedrooms
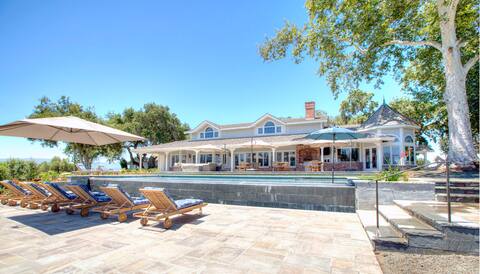
Coyote Hills Ranch & Vineyard with pool & spa!
Entire Place • 5 bedrooms
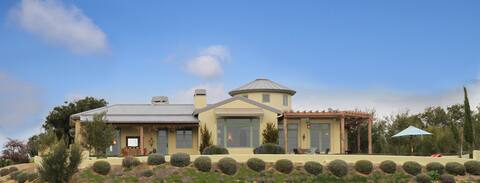
Mediterranean Masterpiece
Entire Place • 5 bedrooms

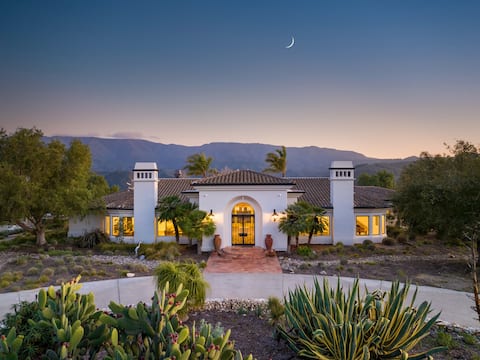
Stunning Spanish Oasis
Entire Place • 6 bedrooms
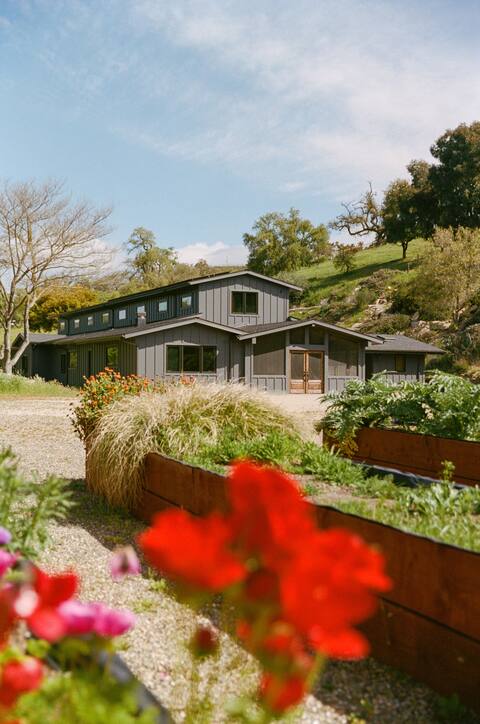
Roblar Farmhouse
Entire Place • 5 bedrooms
Rancho Clancy - SYV Luxury Farm Getaway
Entire Place • 4 bedrooms
Note: Performance varies based on location, size, amenities, seasonality, and management quality. Data reflects the past 12 months.
Top Performing Airbnb Hosts in Santa Ynez (2026)
Learn from the best! This table showcases top-performing Airbnb hosts in Santa Ynez based on the number of properties managed and estimated total revenue over the past year. Analyze their scale and performance metrics.
| Host Name | Properties | Grossing Revenue | Stay Reviews | Avg Rating |
|---|---|---|---|---|
| Wendy | 3 | $1,028,803 | 98 | 4.96/5.0 |
| Michelle | 3 | $1,015,355 | 60 | 4.96/5.0 |
| Polo House And Bungalows | 14 | $557,712 | 197 | 4.97/5.0 |
| Matthew | 1 | $356,985 | 62 | 4.87/5.0 |
| Erin | 2 | $271,305 | 200 | 4.98/5.0 |
| Jodi | 4 | $271,072 | 66 | 5.00/5.0 |
| Maggie | 1 | $267,402 | 13 | 5.00/5.0 |
| Pamela | 4 | $261,716 | 188 | 4.92/5.0 |
| Michele | 2 | $224,253 | 249 | 4.96/5.0 |
| Sarah | 2 | $220,853 | 71 | 4.96/5.0 |
Analyzing the strategies of top hosts, such as their property selection, pricing, and guest communication, can offer valuable lessons for optimizing your own Airbnb operations in Santa Ynez.
Dive Deeper: Advanced Santa Ynez STR Market Data (2026)
Ready to unlock more insights? AirROI provides access to advanced metrics and comprehensive Airbnb data for Santa Ynez. Explore detailed analytics beyond this report to refine your investment strategy, optimize pricing, and maximize your vacation rental profits.
Explore Advanced MetricsSanta Ynez Short-Term Rental Market Composition (2026): Property & Room Types
Room Type Distribution
Property Type Distribution
Market Composition Insights for Santa Ynez
- The Santa Ynez Airbnb market composition is heavily skewed towards Entire Home/Apt listings, which make up 87.4% of the 119 active rentals. This indicates strong guest preference for privacy and space.
- Looking at the property type distribution in Santa Ynez, House properties are the most common (57.1%), reflecting the local real estate landscape.
- Houses represent a significant 57.1% portion, catering likely to families or larger groups.
- The presence of 19.3% Hotel/Boutique listings indicates integration with traditional hospitality.
- Smaller segments like unique stays (combined 1.7%) offer potential for unique stay experiences.
Santa Ynez Airbnb Room Capacity Analysis (2026): Bedroom Distribution
Distribution of Listings by Number of Bedrooms
Room Capacity Insights for Santa Ynez
- The dominant room capacity in Santa Ynez is 2 bedrooms listings, making up 24.4% of the market. This suggests a strong demand for properties suitable for couples or solo travelers.
- Together, 2 bedrooms and 1 bedroom properties represent 46.2% of the active Airbnb listings in Santa Ynez, indicating a high concentration in these sizes.
- A significant 35.3% of listings offer 3+ bedrooms, catering to larger groups and families seeking more space in Santa Ynez.
Santa Ynez Vacation Rental Guest Capacity Trends (2026)
Distribution of Listings by Guest Capacity
Guest Capacity Insights for Santa Ynez
- The most common guest capacity trend in Santa Ynez vacation rentals is listings accommodating 4 guests (28.6%). This suggests the primary traveler segment is likely small families or groups.
- Properties designed for 4 guests and 8+ guests dominate the Santa Ynez STR market, accounting for 48.8% of listings.
- 35.3% of properties accommodate 6+ guests, serving the market segment for larger families or group travel in Santa Ynez.
- On average, properties in Santa Ynez are equipped to host 4.2 guests.
Santa Ynez Airbnb Booking Patterns (2026): Available vs. Booked Days
Available Days Distribution
Booked Days Distribution
Booking Pattern Insights for Santa Ynez
- The most common availability pattern in Santa Ynez falls within the 181-270 days range, representing 44.5% of listings. This suggests many properties have significant open periods on their calendars.
- Approximately 70.6% of listings show high availability (181+ days open annually), indicating potential for increased bookings or specific owner usage patterns.
- For booked days, the 91-180 days range is most frequent in Santa Ynez (42.9%), reflecting common guest stay durations or potential owner blocking patterns.
- A notable 31.1% of properties secure long booking periods (181+ days booked per year), highlighting successful long-term rental strategies or significant owner usage.
Santa Ynez Airbnb Minimum Stay Requirements Analysis
Distribution of Listings by Minimum Night Requirement
1 Night
34 listings
28.6% of total
2 Nights
56 listings
47.1% of total
3 Nights
3 listings
2.5% of total
4-6 Nights
2 listings
1.7% of total
7-29 Nights
2 listings
1.7% of total
30+ Nights
22 listings
18.5% of total
Key Insights
- The most prevalent minimum stay requirement in Santa Ynez is 2 Nights, adopted by 47.1% of listings. This highlights the market's preference for shorter, flexible bookings.
- A strong majority (75.7%) of the Santa Ynez Airbnb data shows acceptance of very short stays (1-2 nights), indicating a dynamic, high-turnover market.
- A significant segment (18.5%) caters to monthly stays (30+ nights) in Santa Ynez, pointing to opportunities in the extended-stay market.
Recommendations
- Align with the market by considering a 2 Nights minimum stay, as 47.1% of Santa Ynez hosts use this setting.
- If feasible, allowing 1-night stays, especially midweek or during low season, could capture last-minute bookings, as only 28.6% currently do.
- Explore offering discounts for stays of 30+ nights to attract the 18.5% of the market seeking extended stays.
- Adjust minimum nights based on seasonality – potentially shorter during low season and longer during peak demand periods in Santa Ynez.
Santa Ynez Airbnb Cancellation Policy Trends Analysis (2026)
Super Strict 30 Days
1 listings
0.8% of total
Limited
7 listings
5.9% of total
Super Strict 60 Days
3 listings
2.5% of total
Flexible
11 listings
9.2% of total
Moderate
39 listings
32.8% of total
Firm
46 listings
38.7% of total
Strict
12 listings
10.1% of total
Cancellation Policy Insights for Santa Ynez
- The prevailing Airbnb cancellation policy trend in Santa Ynez is Firm, used by 38.7% of listings.
- There's a relatively balanced mix between guest-friendly (42.0%) and stricter (48.8%) policies, offering choices for different guest needs.
Recommendations for Hosts
- Consider adopting a Firm policy to align with the 38.7% market standard in Santa Ynez.
- Using a Strict policy might deter some guests, as only 10.1% of listings use it. Evaluate if potential revenue protection outweighs possible lower booking rates.
- Regularly review your cancellation policy against competitors and market demand shifts in Santa Ynez.
Santa Ynez STR Booking Lead Time Analysis (2026)
Average Booking Lead Time by Month
Booking Lead Time Insights for Santa Ynez
- The overall average booking lead time for vacation rentals in Santa Ynez is 51 days.
- Guests book furthest in advance for stays during October (average 71 days), likely coinciding with peak travel demand or local events.
- The shortest booking windows occur for stays in February (average 27 days), indicating more last-minute travel plans during this time.
- Seasonally, Fall (64 days avg.) sees the longest lead times, while Winter (40 days avg.) has the shortest, reflecting typical travel planning cycles.
Recommendations for Hosts
- Use the overall average lead time (51 days) as a baseline for your pricing and availability strategy in Santa Ynez.
- For October stays, consider implementing length-of-stay discounts or slightly higher rates for bookings made less than 71 days out to capitalize on advance planning.
- Target marketing efforts for the Fall season well in advance (at least 64 days) to capture early planners.
- Monitor your own booking lead times against these Santa Ynez averages to identify opportunities for dynamic pricing adjustments.
Popular & Essential Airbnb Amenities in Santa Ynez (2026)
Amenity Prevalence
Amenity Insights for Santa Ynez
- Essential amenities in Santa Ynez that guests expect include: Smoke alarm, Wifi, Carbon monoxide alarm, Heating, Hot water, Free parking on premises, Air conditioning, Fire extinguisher. Lacking these (any) could significantly impact bookings.
- Popular amenities like Bed linens, Essentials are common but not universal. Offering these can provide a competitive edge.
Recommendations for Hosts
- Ensure your listing includes all essential amenities for Santa Ynez: Smoke alarm, Wifi, Carbon monoxide alarm, Heating, Hot water, Free parking on premises, Air conditioning, Fire extinguisher.
- Prioritize adding missing essentials: Smoke alarm, Wifi, Carbon monoxide alarm, Heating, Hot water, Free parking on premises, Air conditioning, Fire extinguisher.
- Consider adding popular differentiators like Bed linens or Essentials to increase appeal.
- Highlight unique or less common amenities you offer (e.g., hot tub, dedicated workspace, EV charger) in your listing description and photos.
- Regularly check competitor amenities in Santa Ynez to stay competitive.
Santa Ynez Airbnb Guest Demographics & Profile Analysis (2026)
Guest Profile Summary for Santa Ynez
- The typical guest profile for Airbnb in Santa Ynez consists of primarily domestic travelers (96%), often arriving from nearby Los Angeles, typically belonging to the Post-2000s (Gen Z/Alpha) group (50%), primarily speaking English or Spanish.
- Domestic travelers account for 95.6% of guests.
- Key international markets include United States (95.6%) and DC (0.9%).
- Top languages spoken are English (63.5%) followed by Spanish (16.6%).
- A significant demographic segment is the Post-2000s (Gen Z/Alpha) group, representing 50% of guests.
Recommendations for Hosts
- Target domestic marketing efforts towards travelers from Los Angeles and San Diego.
- Tailor amenities and listing descriptions to appeal to the dominant Post-2000s (Gen Z/Alpha) demographic (e.g., highlight fast WiFi, smart home features, local guides).
- Highlight unique local experiences or amenities relevant to the primary guest profile.
- Consider seasonal promotions aligned with peak travel times for key origin markets.
Nearby Short-Term Rental Market Comparison
How does the Santa Ynez Airbnb market stack up against its neighbors? Compare key performance metrics like average monthly revenue, ADR, and occupancy rates in surrounding areas to understand the broader regional STR landscape.
| Market | Active Properties | Monthly Revenue | Daily Rate | Avg. Occupancy |
|---|---|---|---|---|
| Montecito | 127 | $10,744 | $950.35 | 51% |
| Los Olivos | 30 | $7,240 | $705.20 | 43% |
| Toro Canyon | 33 | $6,935 | $717.58 | 42% |
| Avila Beach | 94 | $6,770 | $582.34 | 41% |
| Summerland | 88 | $6,323 | $494.72 | 49% |
| Santa Paula | 17 | $5,685 | $502.58 | 47% |
| Buellton | 24 | $5,667 | $476.40 | 40% |
| Santa Barbara | 1,001 | $5,642 | $447.90 | 49% |
| Mission Canyon | 34 | $5,270 | $385.19 | 57% |
| Carpinteria | 159 | $5,223 | $471.03 | 43% |