Santa Ysabel Airbnb Market Analysis 2025: Short Term Rental Data & Vacation Rental Statistics in California, United States
Is Airbnb profitable in Santa Ysabel in 2025? Explore comprehensive Airbnb analytics for Santa Ysabel, California, United States to uncover income potential. This 2025 STR market report for Santa Ysabel, based on AirROI data from October 2024 to September 2025, reveals key trends in the niche market of 20 active listings.
Whether you're considering an Airbnb investment in Santa Ysabel, optimizing your existing vacation rental, or exploring rental arbitrage opportunities, understanding the Santa Ysabel Airbnb data is crucial. Leveraging the low regulation environment is key to maximizing your short term rental income potential. Let's dive into the specifics.
Key Santa Ysabel Airbnb Performance Metrics Overview
Monthly Airbnb Revenue Variations & Income Potential in Santa Ysabel (2025)
Understanding the monthly revenue variations for Airbnb listings in Santa Ysabel is key to maximizing your short term rental income potential. Seasonality significantly impacts earnings. Our analysis, based on data from the past 12 months, shows that the peak revenue month for STRs in Santa Ysabel is typically August, while January often presents the lowest earnings, highlighting opportunities for strategic pricing adjustments during shoulder and low seasons. Explore the typical Airbnb income in Santa Ysabel across different performance tiers:
- Best-in-class properties (Top 10%) achieve $8,397+ monthly, often utilizing dynamic pricing and superior guest experiences.
- Strong performing properties (Top 25%) earn $2,165 or more, indicating effective management and desirable locations/amenities.
- Typical properties (Median) generate around $1,023 per month, representing the average market performance.
- Entry-level properties (Bottom 25%) see earnings around $501, often with potential for optimization.
Average Monthly Airbnb Earnings Trend in Santa Ysabel
Santa Ysabel Airbnb Occupancy Rate Trends (2025)
Maximize your bookings by understanding the Santa Ysabel STR occupancy trends. Seasonal demand shifts significantly influence how often properties are booked. Typically, Novembersees the highest demand (peak season occupancy), while April experiences the lowest (low season). Effective strategies, like adjusting minimum stays or offering promotions, can boost occupancy during slower periods. Here's how different property tiers perform in Santa Ysabel:
- Best-in-class properties (Top 10%) achieve 50%+ occupancy, indicating high desirability and potentially optimized availability.
- Strong performing properties (Top 25%) maintain 28% or higher occupancy, suggesting good market fit and guest satisfaction.
- Typical properties (Median) have an occupancy rate around 16%.
- Entry-level properties (Bottom 25%) average 9% occupancy, potentially facing higher vacancy.
Average Monthly Occupancy Rate Trend in Santa Ysabel
Average Daily Rate (ADR) Airbnb Trends in Santa Ysabel (2025)
Effective short term rental pricing strategy in Santa Ysabel involves understanding monthly ADR fluctuations. The Average Daily Rate (ADR) for Airbnb in Santa Ysabel typically peaks in May and dips lowest during October. Leveraging Airbnb dynamic pricing tools or strategies based on this seasonality can significantly boost revenue. Here's a look at the typical nightly rates achieved:
- Best-in-class properties (Top 10%) command rates of $591+ per night, often due to premium features or locations.
- Strong performing properties (Top 25%) achieve nightly rates of $318 or more.
- Typical properties (Median) charge around $167 per night.
- Entry-level properties (Bottom 25%) earn around $143 per night.
Average Daily Rate (ADR) Trend by Month in Santa Ysabel
Get Live Santa Ysabel Market Intelligence 👇

Explore Real-time Analytics
Airbnb Seasonality Analysis & Trends in Santa Ysabel (2025)
Peak Season (August, October, July)
- Revenue averages $3,105 per month
- Occupancy rates average 25.7%
- Daily rates average $254
Shoulder Season
- Revenue averages $2,565 per month
- Occupancy maintains around 23.8%
- Daily rates hold near $263
Low Season (January, February, April)
- Revenue drops to average $1,469 per month
- Occupancy decreases to average 15.4%
- Daily rates adjust to average $248
Seasonality Insights for Santa Ysabel
- The Airbnb seasonality in Santa Ysabel shows highly seasonal trends requiring careful strategy. While the sections above show seasonal averages, it's also insightful to look at the extremes:
- During the high season, the absolute peak month showcases Santa Ysabel's highest earning potential, with monthly revenues capable of climbing to $3,509, occupancy reaching a high of 34.3%, and ADRs peaking at $288.
- Conversely, the slowest single month of the year, typically falling within the low season, marks the market's lowest point. In this month, revenue might dip to $1,394, occupancy could drop to 14.9%, and ADRs may adjust down to $239.
- Understanding both the seasonal averages and these monthly peaks and troughs in revenue, occupancy, and ADR is crucial for maximizing your Airbnb profit potential in Santa Ysabel.
Seasonal Strategies for Maximizing Profit
- Peak Season: Maximize revenue through premium pricing and potentially longer minimum stays. Ensure high availability.
- Low Season: Offer competitive pricing, special promotions (e.g., extended stay discounts), and flexible cancellation policies. Target off-season travelers like remote workers or budget-conscious guests.
- Shoulder Seasons: Implement dynamic pricing that balances peak and low rates. Target weekend travelers or specific events. Offer slightly more flexible terms than peak season.
- Regularly analyze your own performance against these Santa Ysabel seasonality benchmarks and adjust your pricing and availability strategy accordingly.
Best Areas for Airbnb Investment in Santa Ysabel (2025)
Exploring the top neighborhoods for short-term rentals in Santa Ysabel? This section highlights key areas, outlining why they are attractive for hosts and guests, along with notable local attractions. Consider these locations based on your target guest profile and investment strategy.
| Neighborhood / Area | Why Host Here? (Target Guests & Appeal) | Key Attractions & Landmarks |
|---|---|---|
| Santa Ysabel Village | A charming small town ambiance that provides peaceful retreats for visitors who want to enjoy nature, away from urban settings. | Santa Ysabel Mission, Cuyamaca Rancho State Park, Lake Cuyamaca, Cuyamaca Mountain, Cuyamaca State Park |
| Lake Cuyamaca | Ideal for outdoor enthusiasts, this area offers fishing, hiking, and stunning natural beauty, making it a great choice for Airbnb hosts targeting nature lovers. | Fishing and boating at Lake Cuyamaca, Hiking trails, Picnic areas, Wildlife viewing, Stunning lake views |
| Borrego Springs | Known for its unique desert landscape and artistic community, it attracts visitors from around California for its warm weather and outdoor activities. | Anza-Borrego Desert State Park, Borrego Springs Spa, Borrego Art Institute, Wildflower viewing, Stargazing sites |
| Julian | Famous for its apple pie and historic gold mining town, Julian attracts a lot of tourists looking for a quaint getaway with a bit of history and charm. | Julian Pioneer Museum, California Wolf Center, Cuyamaca State Park, Apple orchards, Julian Historic District |
| Cuyamaca Rancho State Park | A scenic area rich in biodiversity and outdoor activities, perfect for hosts looking to attract hikers and nature lovers. | Extensive trail systems, Camping facilities, Wildlife spotting, Picnic areas, Scenic views from the mountains |
| Palomar Mountain | Famous for its observatory and amazing hiking trails, Palomar Mountain appeals to visitors interested in astronomy and natural splendor. | Palomar Observatory, Palomar Mountain State Park, Hiking trails, Scenic viewpoints, Winter sports (snow) |
| San Diego County | The greater region offers plenty of attractions, making it appealing for wider audiences from families to singles seeking vacation rentals. | Centrally located to San Diego attractions, Perfect for day trips, Beaches and parks nearby, Dining and shopping options, Cultural experiences |
| Temecula | Famous for its wineries and vibrant hot air balloon rides, Temecula is a great destination for wine lovers and tourists seeking an upscale experience. | Temecula Valley Wine Country, Old Town Temecula, Hot Air Balloon Rides, Lake Skinner, Temecula Creek Inn |
Understanding Airbnb License Requirements & STR Laws in Santa Ysabel (2025)
While Santa Ysabel, California, United States currently shows low STR regulations, specific Airbnb license requirements might still exist or change. Always verify the latest short term rental regulations and Airbnb license requirements directly with local government authorities for Santa Ysabel to ensure full compliance before hosting.
(Source: AirROI data, 2025, finding no licensed listings among those analyzed)
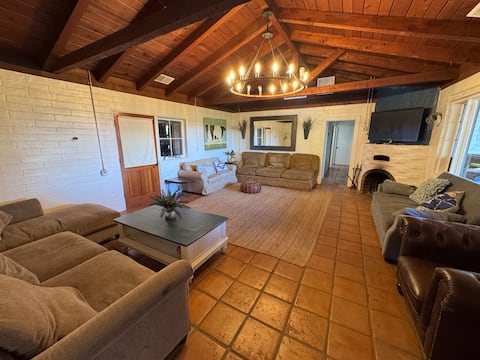
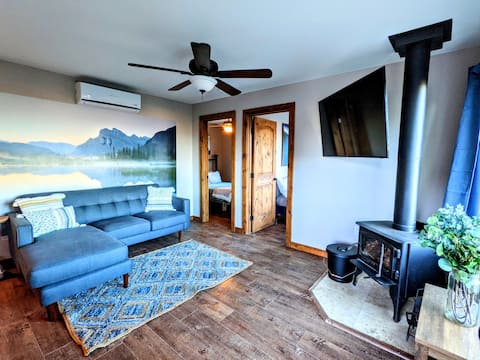
Top Performing Airbnb Properties in Santa Ysabel (2025)
Benchmark your potential! Explore examples of top-performing Airbnb properties in Santa Ysabelbased on Trailing Twelve Month (TTM) revenue. Analyze their characteristics, revenue, occupancy rate, and ADR to understand what drives success in this market.

Adobe Acres Ranch House
Entire Place • 4 bedrooms

Partridge Ranch
Entire Place • 3 bedrooms

Private Mountain Home | Pool | Fire Pit | AC
Entire Place • 3 bedrooms
The Lake View Retreat- Entire House near Julian CA
Entire Place • 5 bedrooms

#7Josie's Mountain Top Hideout-Cabin in the Woods
Entire Place • 1 bedroom
#12 Hillside Harvest Moon - Cabin near Julian
Entire Place • 2 bedrooms
Note: Performance varies based on location, size, amenities, seasonality, and management quality. Data reflects the past 12 months.
Top Performing Airbnb Hosts in Santa Ysabel (2025)
Learn from the best! This table showcases top-performing Airbnb hosts in Santa Ysabel based on the number of properties managed and estimated total revenue over the past year. Analyze their scale and performance metrics.
| Host Name | Properties | Grossing Revenue | Stay Reviews | Avg Rating |
|---|---|---|---|---|
| Hideout Mountain Lodge | 14 | $154,036 | 685 | 4.74/5.0 |
| Katie | 1 | $122,155 | 133 | 5.00/5.0 |
| Zoe | 1 | $105,880 | 47 | 4.83/5.0 |
| Drift Vacation Homes | 1 | $49,950 | 3 | 5.00/5.0 |
| Jim | 1 | $7,680 | 2 | Not Rated |
| Memo | 1 | $848 | 113 | 4.78/5.0 |
| Host #55995102 | 1 | $466 | 39 | 4.97/5.0 |
Analyzing the strategies of top hosts, such as their property selection, pricing, and guest communication, can offer valuable lessons for optimizing your own Airbnb operations in Santa Ysabel.
Dive Deeper: Advanced Santa Ysabel STR Market Data (2025)
Ready to unlock more insights? AirROI provides access to advanced metrics and comprehensive Airbnb data for Santa Ysabel. Explore detailed analytics beyond this report to refine your investment strategy, optimize pricing, and maximize your vacation rental profits.
Explore Advanced MetricsSanta Ysabel Short-Term Rental Market Composition (2025): Property & Room Types
Room Type Distribution
Property Type Distribution
Market Composition Insights for Santa Ysabel
- The Santa Ysabel Airbnb market composition is heavily skewed towards Entire Home/Apt listings, which make up 100% of the 20 active rentals. This indicates strong guest preference for privacy and space.
- Looking at the property type distribution in Santa Ysabel, Outdoor/Unique properties are the most common (75%), reflecting the local real estate landscape.
- The presence of 10% Hotel/Boutique listings indicates integration with traditional hospitality.
Santa Ysabel Airbnb Room Capacity Analysis (2025): Bedroom Distribution
Distribution of Listings by Number of Bedrooms
Room Capacity Insights for Santa Ysabel
- The dominant room capacity in Santa Ysabel is 1 bedroom listings, making up 65% of the market. This suggests a strong demand for properties suitable for couples or solo travelers.
- Together, 1 bedroom and 2 bedrooms properties represent 75.0% of the active Airbnb listings in Santa Ysabel, indicating a high concentration in these sizes.
- With over half the market (65%) consisting of studios or 1-bedroom units, Santa Ysabel is particularly well-suited for individuals or couples.
Santa Ysabel Vacation Rental Guest Capacity Trends (2025)
Distribution of Listings by Guest Capacity
Guest Capacity Insights for Santa Ysabel
- The most common guest capacity trend in Santa Ysabel vacation rentals is listings accommodating 2 guests (55%). This suggests the primary traveler segment is likely couples or solo travelers.
- Properties designed for 2 guests and 8+ guests dominate the Santa Ysabel STR market, accounting for 70.0% of listings.
- A significant 55.0% of listings cater specifically to 1-2 guests, highlighting strong demand from couples and solo travelers in Santa Ysabel.
- 25.0% of properties accommodate 6+ guests, serving the market segment for larger families or group travel in Santa Ysabel.
- On average, properties in Santa Ysabel are equipped to host 3.8 guests.
Santa Ysabel Airbnb Booking Patterns (2025): Available vs. Booked Days
Available Days Distribution
Booked Days Distribution
Booking Pattern Insights for Santa Ysabel
- The most common availability pattern in Santa Ysabel falls within the 271-366 days range, representing 90% of listings. This suggests many properties have significant open periods on their calendars.
- Approximately 100.0% of listings show high availability (181+ days open annually), indicating potential for increased bookings or specific owner usage patterns.
- For booked days, the 31-90 days range is most frequent in Santa Ysabel (65%), reflecting common guest stay durations or potential owner blocking patterns.
Santa Ysabel Airbnb Minimum Stay Requirements Analysis
Distribution of Listings by Minimum Night Requirement
1 Night
13 listings
68.4% of total
2 Nights
1 listings
5.3% of total
30+ Nights
5 listings
26.3% of total
Key Insights
- The most prevalent minimum stay requirement in Santa Ysabel is 1 Night, adopted by 68.4% of listings. This highlights the market's preference for shorter, flexible bookings.
- A strong majority (73.7%) of the Santa Ysabel Airbnb data shows acceptance of very short stays (1-2 nights), indicating a dynamic, high-turnover market.
- A significant segment (26.3%) caters to monthly stays (30+ nights) in Santa Ysabel, pointing to opportunities in the extended-stay market.
Recommendations
- Align with the market by considering a 1 Night minimum stay, as 68.4% of Santa Ysabel hosts use this setting.
- Explore offering discounts for stays of 30+ nights to attract the 26.3% of the market seeking extended stays.
- Adjust minimum nights based on seasonality – potentially shorter during low season and longer during peak demand periods in Santa Ysabel.
Santa Ysabel Airbnb Cancellation Policy Trends Analysis (2025)
Moderate
2 listings
10.5% of total
Firm
16 listings
84.2% of total
Strict
1 listings
5.3% of total
Cancellation Policy Insights for Santa Ysabel
- The prevailing Airbnb cancellation policy trend in Santa Ysabel is Firm, used by 84.2% of listings.
- A majority (89.5%) of hosts in Santa Ysabel utilize Firm or Strict policies, indicating a market where hosts prioritize booking security.
- Strict cancellation policies are quite rare (5.3%), potentially making listings with this policy less competitive unless justified by high demand or property type.
Recommendations for Hosts
- Consider adopting a Firm policy to align with the 84.2% market standard in Santa Ysabel.
- Using a Strict policy might deter some guests, as only 5.3% of listings use it. Evaluate if potential revenue protection outweighs possible lower booking rates.
- Regularly review your cancellation policy against competitors and market demand shifts in Santa Ysabel.
Santa Ysabel STR Booking Lead Time Analysis (2025)
Average Booking Lead Time by Month
Booking Lead Time Insights for Santa Ysabel
- The overall average booking lead time for vacation rentals in Santa Ysabel is 47 days.
- Guests book furthest in advance for stays during January (average 86 days), likely coinciding with peak travel demand or local events.
- The shortest booking windows occur for stays in August (average 20 days), indicating more last-minute travel plans during this time.
- Seasonally, Winter (47 days avg.) sees the longest lead times, while Summer (32 days avg.) has the shortest, reflecting typical travel planning cycles.
Recommendations for Hosts
- Use the overall average lead time (47 days) as a baseline for your pricing and availability strategy in Santa Ysabel.
- For January stays, consider implementing length-of-stay discounts or slightly higher rates for bookings made less than 86 days out to capitalize on advance planning.
- Target marketing efforts for the Winter season well in advance (at least 47 days) to capture early planners.
- Monitor your own booking lead times against these Santa Ysabel averages to identify opportunities for dynamic pricing adjustments.
Popular & Essential Airbnb Amenities in Santa Ysabel (2025)
Amenity Prevalence
Amenity Insights for Santa Ysabel
- Essential amenities in Santa Ysabel that guests expect include: Smoke alarm, Carbon monoxide alarm, Wifi, TV, First aid kit, Free parking on premises, Fire extinguisher. Lacking these (any) could significantly impact bookings.
- Popular amenities like Air conditioning, Heating, Essentials are common but not universal. Offering these can provide a competitive edge.
Recommendations for Hosts
- Ensure your listing includes all essential amenities for Santa Ysabel: Smoke alarm, Carbon monoxide alarm, Wifi, TV, First aid kit, Free parking on premises, Fire extinguisher.
- Prioritize adding missing essentials: TV, First aid kit, Free parking on premises, Fire extinguisher.
- Consider adding popular differentiators like Air conditioning or Heating to increase appeal.
- Highlight unique or less common amenities you offer (e.g., hot tub, dedicated workspace, EV charger) in your listing description and photos.
- Regularly check competitor amenities in Santa Ysabel to stay competitive.
Santa Ysabel Airbnb Guest Demographics & Profile Analysis (2025)
Guest Profile Summary for Santa Ysabel
- The typical guest profile for Airbnb in Santa Ysabel consists of primarily domestic travelers (98%), often arriving from nearby San Diego, typically belonging to the Post-2000s (Gen Z/Alpha) group (50%), primarily speaking English or Spanish.
- Domestic travelers account for 98.4% of guests.
- Key international markets include United States (98.4%) and Mexico (1.6%).
- Top languages spoken are English (53.8%) followed by Spanish (28.8%).
- A significant demographic segment is the Post-2000s (Gen Z/Alpha) group, representing 50% of guests.
Recommendations for Hosts
- Target domestic marketing efforts towards travelers from San Diego and Los Angeles.
- Tailor amenities and listing descriptions to appeal to the dominant Post-2000s (Gen Z/Alpha) demographic (e.g., highlight fast WiFi, smart home features, local guides).
- Highlight unique local experiences or amenities relevant to the primary guest profile.
- Consider seasonal promotions aligned with peak travel times for key origin markets.
Nearby Short-Term Rental Market Comparison
How does the Santa Ysabel Airbnb market stack up against its neighbors? Compare key performance metrics like average monthly revenue, ADR, and occupancy rates in surrounding areas to understand the broader regional STR landscape.
| Market | Active Properties | Monthly Revenue | Daily Rate | Avg. Occupancy |
|---|---|---|---|---|
| Rancho San Diego | 26 | $9,147 | $582.97 | 51% |
| Thousand Palms | 33 | $8,709 | $768.44 | 39% |
| Newport Beach | 1,223 | $8,523 | $724.03 | 46% |
| Del Mar | 116 | $7,256 | $626.63 | 46% |
| Bermuda Dunes | 146 | $7,134 | $666.70 | 40% |
| GlenOak Hills | 41 | $7,079 | $638.72 | 39% |
| Mount Helix | 35 | $6,757 | $505.21 | 51% |
| Lakeside | 35 | $6,629 | $579.70 | 45% |
| Rancho Santa Fe | 33 | $6,232 | $877.55 | 33% |
| Encinitas | 565 | $5,962 | $539.46 | 50% |