Shingletown Airbnb Market Analysis 2026: Short Term Rental Data & Vacation Rental Statistics in California, United States
Is Airbnb profitable in Shingletown in 2026? Explore comprehensive Airbnb analytics for Shingletown, California, United States to uncover income potential. This 2026 STR market report for Shingletown, based on AirROI data from February 2025 to January 2026, reveals key trends in the niche market of 82 active listings.
Whether you're considering an Airbnb investment in Shingletown, optimizing your existing vacation rental, or exploring rental arbitrage opportunities, understanding the Shingletown Airbnb data is crucial. Leveraging the low regulation environment is key to maximizing your short term rental income potential. Let's dive into the specifics.
Key Shingletown Airbnb Performance Metrics Overview
Monthly Airbnb Revenue Variations & Income Potential in Shingletown (2026)
Understanding the monthly revenue variations for Airbnb listings in Shingletown is key to maximizing your short term rental income potential. Seasonality significantly impacts earnings. Our analysis, based on data from the past 12 months, shows that the peak revenue month for STRs in Shingletown is typically August, while February often presents the lowest earnings, highlighting opportunities for strategic pricing adjustments during shoulder and low seasons. Explore the typical Airbnb income in Shingletown across different performance tiers:
- Best-in-class properties (Top 10%) achieve $5,745+ monthly, often utilizing dynamic pricing and superior guest experiences.
- Strong performing properties (Top 25%) earn $4,404 or more, indicating effective management and desirable locations/amenities.
- Typical properties (Median) generate around $2,369 per month, representing the average market performance.
- Entry-level properties (Bottom 25%) see earnings around $959, often with potential for optimization.
Average Monthly Airbnb Earnings Trend in Shingletown
Shingletown Airbnb Occupancy Rate Trends (2026)
Maximize your bookings by understanding the Shingletown STR occupancy trends. Seasonal demand shifts significantly influence how often properties are booked. Typically, Julysees the highest demand (peak season occupancy), while January experiences the lowest (low season). Effective strategies, like adjusting minimum stays or offering promotions, can boost occupancy during slower periods. Here's how different property tiers perform in Shingletown:
- Best-in-class properties (Top 10%) achieve 73%+ occupancy, indicating high desirability and potentially optimized availability.
- Strong performing properties (Top 25%) maintain 59% or higher occupancy, suggesting good market fit and guest satisfaction.
- Typical properties (Median) have an occupancy rate around 34%.
- Entry-level properties (Bottom 25%) average 16% occupancy, potentially facing higher vacancy.
Average Monthly Occupancy Rate Trend in Shingletown
Average Daily Rate (ADR) Airbnb Trends in Shingletown (2026)
Effective short term rental pricing strategy in Shingletown involves understanding monthly ADR fluctuations. The Average Daily Rate (ADR) for Airbnb in Shingletown typically peaks in June and dips lowest during February. Leveraging Airbnb dynamic pricing tools or strategies based on this seasonality can significantly boost revenue. Here's a look at the typical nightly rates achieved:
- Best-in-class properties (Top 10%) command rates of $370+ per night, often due to premium features or locations.
- Strong performing properties (Top 25%) achieve nightly rates of $273 or more.
- Typical properties (Median) charge around $202 per night.
- Entry-level properties (Bottom 25%) earn around $165 per night.
Average Daily Rate (ADR) Trend by Month in Shingletown
Get Live Shingletown Market Intelligence 👇

Explore Real-time Analytics
Airbnb Seasonality Analysis & Trends in Shingletown (2026)
Peak Season (August, July, June)
- Revenue averages $3,826 per month
- Occupancy rates average 47.0%
- Daily rates average $252
Shoulder Season
- Revenue averages $2,717 per month
- Occupancy maintains around 37.8%
- Daily rates hold near $241
Low Season (January, February, March)
- Revenue drops to average $2,091 per month
- Occupancy decreases to average 30.2%
- Daily rates adjust to average $233
Seasonality Insights for Shingletown
- The Airbnb seasonality in Shingletown shows highly seasonal trends requiring careful strategy. While the sections above show seasonal averages, it's also insightful to look at the extremes:
- During the high season, the absolute peak month showcases Shingletown's highest earning potential, with monthly revenues capable of climbing to $4,029, occupancy reaching a high of 50.6%, and ADRs peaking at $258.
- Conversely, the slowest single month of the year, typically falling within the low season, marks the market's lowest point. In this month, revenue might dip to $1,917, occupancy could drop to 28.9%, and ADRs may adjust down to $225.
- Understanding both the seasonal averages and these monthly peaks and troughs in revenue, occupancy, and ADR is crucial for maximizing your Airbnb profit potential in Shingletown.
Seasonal Strategies for Maximizing Profit
- Peak Season: Maximize revenue through premium pricing and potentially longer minimum stays. Ensure high availability.
- Low Season: Offer competitive pricing, special promotions (e.g., extended stay discounts), and flexible cancellation policies. Target off-season travelers like remote workers or budget-conscious guests.
- Shoulder Seasons: Implement dynamic pricing that balances peak and low rates. Target weekend travelers or specific events. Offer slightly more flexible terms than peak season.
- Regularly analyze your own performance against these Shingletown seasonality benchmarks and adjust your pricing and availability strategy accordingly.
Best Areas for Airbnb Investment in Shingletown (2026)
Exploring the top neighborhoods for short-term rentals in Shingletown? This section highlights key areas, outlining why they are attractive for hosts and guests, along with notable local attractions. Consider these locations based on your target guest profile and investment strategy.
| Neighborhood / Area | Why Host Here? (Target Guests & Appeal) | Key Attractions & Landmarks |
|---|---|---|
| Shasta Lake | Ideal for those seeking outdoor adventures such as fishing, boating, and hiking with stunning views of Mount Shasta. Popular among families and nature enthusiasts. | Shasta Dam, Shasta Lake, Mount Shasta, Lake Shasta Caverns, McCloud Falls |
| Burney Falls | Home to the stunning Burney Falls which is a must-see for nature lovers. Attracts visitors looking for a peaceful and picturesque retreat. | Burney Falls State Park, Lake Britton, Mt. Lassen, McArthur-Burney Falls |
| Lassen Volcanic National Park | A gem for ecotourism with unique volcanic landscapes, offering hiking trails and photographic opportunities. Great for adventurous travelers. | Lassen Peak, Bumpass Hell, Manzanita Lake, Sulphur Works |
| Redding | A larger town nearby with a variety of dining and shopping options, catering to visitors who need more amenities while exploring the natural beauty of Northern California. | Sundial Bridge, Turtle Bay Exploration Park, Whiskeytown Lake, Redding Botanical Gardens |
| Lake Almanor | A beautiful mountain lake destination for vacationers looking for relaxation and aquatic activities, especially popular in summer. | Lake Almanor, Plumas National Forest, Red Bluff, Chester |
| Mount Shasta | A well-known destination for winter sports enthusiasts and hikers, attracting tourists year-round for outdoor activities. | Mount Shasta Ski Park, Lava Beds National Monument, Siskiyou County Trails, Shastice Park |
| Cottonwood | A small town that serves as a good base for exploring the larger Shasta area. It's quaint and offers a quieter pace for visitors. | Siskiyou County Historical Society, Local Parks, Cattle Ranches |
| Anderson | Close to Redding, it offers a small-town feel with wine country nearby. Ideal for visitors looking to explore the vineyards and enjoy local wine tastings. | Anderson River Park, Local Wineries, Shasta College Culinary Arts |
Understanding Airbnb License Requirements & STR Laws in Shingletown (2026)
While Shingletown, California, United States currently shows low STR regulations, specific Airbnb license requirements might still exist or change. Always verify the latest short term rental regulations and Airbnb license requirements directly with local government authorities for Shingletown to ensure full compliance before hosting.
(Source: AirROI data, 2026, finding no licensed listings among those analyzed)
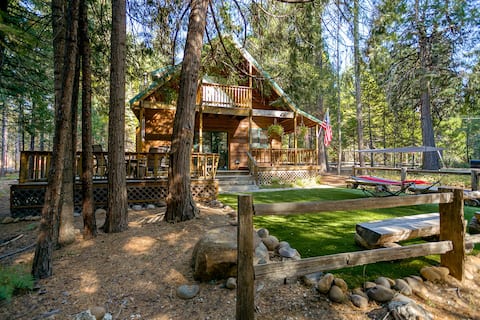
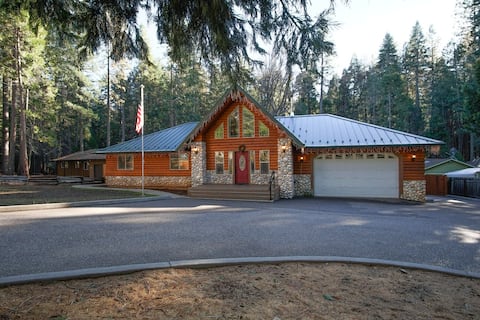
Top Performing Airbnb Properties in Shingletown (2026)
Benchmark your potential! Explore examples of top-performing Airbnb properties in Shingletownbased on Trailing Twelve Month (TTM) revenue. Analyze their characteristics, revenue, occupancy rate, and ADR to understand what drives success in this market.

Quiet/Cozy A-Frame Near Mount Lassen w/Hot Tub
Entire Place • 3 bedrooms
Rustic Mountain Cabin - 9 Miles to Lassen park
Entire Place • 3 bedrooms
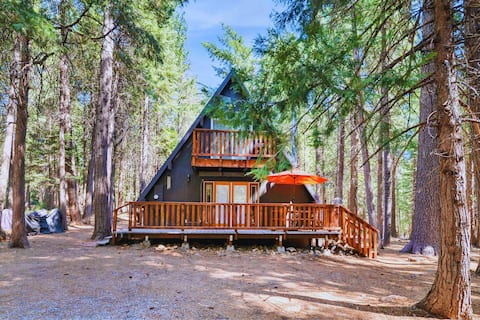
A-Frame Cabin w/ Hot Tub near Mount Lassen Park
Entire Place • 1 bedroom

Lassen Tree Cabin with Hot Tub, Movie Projector
Entire Place • 1 bedroom
Shasta Forest Village House
Entire Place • 3 bedrooms

The Haven, quiet and spacious home with fireplace
Entire Place • 3 bedrooms
Note: Performance varies based on location, size, amenities, seasonality, and management quality. Data reflects the past 12 months.
Top Performing Airbnb Hosts in Shingletown (2026)
Learn from the best! This table showcases top-performing Airbnb hosts in Shingletown based on the number of properties managed and estimated total revenue over the past year. Analyze their scale and performance metrics.
| Host Name | Properties | Grossing Revenue | Stay Reviews | Avg Rating |
|---|---|---|---|---|
| Bigfoot Lodging | 32 | $359,941 | 2745 | 4.78/5.0 |
| Anna Marie | 4 | $256,132 | 480 | 4.93/5.0 |
| Wendy & Alan | 3 | $177,172 | 237 | 4.92/5.0 |
| Teresa | 9 | $77,784 | 436 | 4.75/5.0 |
| Erica | 1 | $67,302 | 91 | 4.96/5.0 |
| Martha | 3 | $65,990 | 348 | 4.97/5.0 |
| Scott | 1 | $65,781 | 23 | 5.00/5.0 |
| David | 1 | $63,754 | 93 | 4.98/5.0 |
| Ven | 1 | $59,836 | 89 | 4.98/5.0 |
| Isabel | 1 | $58,184 | 77 | 4.96/5.0 |
Analyzing the strategies of top hosts, such as their property selection, pricing, and guest communication, can offer valuable lessons for optimizing your own Airbnb operations in Shingletown.
Dive Deeper: Advanced Shingletown STR Market Data (2026)
Ready to unlock more insights? AirROI provides access to advanced metrics and comprehensive Airbnb data for Shingletown. Explore detailed analytics beyond this report to refine your investment strategy, optimize pricing, and maximize your vacation rental profits.
Explore Advanced MetricsShingletown Short-Term Rental Market Composition (2026): Property & Room Types
Room Type Distribution
Property Type Distribution
Market Composition Insights for Shingletown
- The Shingletown Airbnb market composition is heavily skewed towards Entire Home/Apt listings, which make up 92.7% of the 82 active rentals. This indicates strong guest preference for privacy and space.
- Looking at the property type distribution in Shingletown, Outdoor/Unique properties are the most common (68.3%), reflecting the local real estate landscape.
- Houses represent a significant 26.8% portion, catering likely to families or larger groups.
- Smaller segments like hotel/boutique, others (combined 4.8%) offer potential for unique stay experiences.
Shingletown Airbnb Room Capacity Analysis (2026): Bedroom Distribution
Distribution of Listings by Number of Bedrooms
Room Capacity Insights for Shingletown
- The dominant room capacity in Shingletown is 1 bedroom listings, making up 29.3% of the market. This suggests a strong demand for properties suitable for couples or solo travelers.
- Together, 1 bedroom and 2 bedrooms properties represent 54.9% of the active Airbnb listings in Shingletown, indicating a high concentration in these sizes.
- A significant 23.1% of listings offer 3+ bedrooms, catering to larger groups and families seeking more space in Shingletown.
Shingletown Vacation Rental Guest Capacity Trends (2026)
Distribution of Listings by Guest Capacity
Guest Capacity Insights for Shingletown
- The most common guest capacity trend in Shingletown vacation rentals is listings accommodating 4 guests (31.7%). This suggests the primary traveler segment is likely small families or groups.
- Properties designed for 4 guests and 6 guests dominate the Shingletown STR market, accounting for 59.7% of listings.
- 43.8% of properties accommodate 6+ guests, serving the market segment for larger families or group travel in Shingletown.
- On average, properties in Shingletown are equipped to host 4.7 guests.
Shingletown Airbnb Booking Patterns (2026): Available vs. Booked Days
Available Days Distribution
Booked Days Distribution
Booking Pattern Insights for Shingletown
- The most common availability pattern in Shingletown falls within the 271-366 days range, representing 58.5% of listings. This suggests many properties have significant open periods on their calendars.
- Approximately 79.2% of listings show high availability (181+ days open annually), indicating potential for increased bookings or specific owner usage patterns.
- For booked days, the 31-90 days range is most frequent in Shingletown (43.9%), reflecting common guest stay durations or potential owner blocking patterns.
- A notable 20.8% of properties secure long booking periods (181+ days booked per year), highlighting successful long-term rental strategies or significant owner usage.
Shingletown Airbnb Minimum Stay Requirements Analysis
Distribution of Listings by Minimum Night Requirement
1 Night
41 listings
50% of total
2 Nights
21 listings
25.6% of total
3 Nights
2 listings
2.4% of total
30+ Nights
18 listings
22% of total
Key Insights
- The most prevalent minimum stay requirement in Shingletown is 1 Night, adopted by 50% of listings. This highlights the market's preference for shorter, flexible bookings.
- A strong majority (75.6%) of the Shingletown Airbnb data shows acceptance of very short stays (1-2 nights), indicating a dynamic, high-turnover market.
- A significant segment (22%) caters to monthly stays (30+ nights) in Shingletown, pointing to opportunities in the extended-stay market.
Recommendations
- Align with the market by considering a 1 Night minimum stay, as 50% of Shingletown hosts use this setting.
- Explore offering discounts for stays of 30+ nights to attract the 22% of the market seeking extended stays.
- Adjust minimum nights based on seasonality – potentially shorter during low season and longer during peak demand periods in Shingletown.
Shingletown Airbnb Cancellation Policy Trends Analysis (2026)
Limited
1 listings
1.2% of total
Flexible
6 listings
7.3% of total
Moderate
12 listings
14.6% of total
Firm
59 listings
72% of total
Strict
4 listings
4.9% of total
Cancellation Policy Insights for Shingletown
- The prevailing Airbnb cancellation policy trend in Shingletown is Firm, used by 72% of listings.
- A majority (76.9%) of hosts in Shingletown utilize Firm or Strict policies, indicating a market where hosts prioritize booking security.
- Strict cancellation policies are quite rare (4.9%), potentially making listings with this policy less competitive unless justified by high demand or property type.
Recommendations for Hosts
- Consider adopting a Firm policy to align with the 72% market standard in Shingletown.
- Using a Strict policy might deter some guests, as only 4.9% of listings use it. Evaluate if potential revenue protection outweighs possible lower booking rates.
- Regularly review your cancellation policy against competitors and market demand shifts in Shingletown.
Shingletown STR Booking Lead Time Analysis (2026)
Average Booking Lead Time by Month
Booking Lead Time Insights for Shingletown
- The overall average booking lead time for vacation rentals in Shingletown is 48 days.
- Guests book furthest in advance for stays during November (average 64 days), likely coinciding with peak travel demand or local events.
- The shortest booking windows occur for stays in January (average 24 days), indicating more last-minute travel plans during this time.
- Seasonally, Summer (56 days avg.) sees the longest lead times, while Winter (26 days avg.) has the shortest, reflecting typical travel planning cycles.
Recommendations for Hosts
- Use the overall average lead time (48 days) as a baseline for your pricing and availability strategy in Shingletown.
- For November stays, consider implementing length-of-stay discounts or slightly higher rates for bookings made less than 64 days out to capitalize on advance planning.
- Target marketing efforts for the Summer season well in advance (at least 56 days) to capture early planners.
- Monitor your own booking lead times against these Shingletown averages to identify opportunities for dynamic pricing adjustments.
Popular & Essential Airbnb Amenities in Shingletown (2026)
Amenity Prevalence
Amenity Insights for Shingletown
- Essential amenities in Shingletown that guests expect include: Free parking on premises, Hot water. Lacking these (any) could significantly impact bookings.
- Popular amenities like Wifi, Shampoo, Heating are common but not universal. Offering these can provide a competitive edge.
- Warning: Wifi is not universally provided but is considered essential globally. Ensure reliable Wifi is offered.
Recommendations for Hosts
- Ensure your listing includes all essential amenities for Shingletown: Free parking on premises, Hot water.
- Prioritize adding missing essentials: Hot water.
- Consider adding popular differentiators like Wifi or Shampoo to increase appeal.
- Highlight unique or less common amenities you offer (e.g., hot tub, dedicated workspace, EV charger) in your listing description and photos.
- Regularly check competitor amenities in Shingletown to stay competitive.
Shingletown Airbnb Guest Demographics & Profile Analysis (2026)
Guest Profile Summary for Shingletown
- The typical guest profile for Airbnb in Shingletown consists of primarily domestic travelers (95%), often arriving from nearby San Francisco, typically belonging to the Post-2000s (Gen Z/Alpha) group (50%), primarily speaking English or Spanish.
- Domestic travelers account for 95.2% of guests.
- Key international markets include United States (95.2%) and United Kingdom (1.3%).
- Top languages spoken are English (62.6%) followed by Spanish (10.9%).
- A significant demographic segment is the Post-2000s (Gen Z/Alpha) group, representing 50% of guests.
Recommendations for Hosts
- Target domestic marketing efforts towards travelers from San Francisco and San Jose.
- Tailor amenities and listing descriptions to appeal to the dominant Post-2000s (Gen Z/Alpha) demographic (e.g., highlight fast WiFi, smart home features, local guides).
- Highlight unique local experiences or amenities relevant to the primary guest profile.
- Consider seasonal promotions aligned with peak travel times for key origin markets.
Nearby Short-Term Rental Market Comparison
How does the Shingletown Airbnb market stack up against its neighbors? Compare key performance metrics like average monthly revenue, ADR, and occupancy rates in surrounding areas to understand the broader regional STR landscape.
| Market | Active Properties | Monthly Revenue | Daily Rate | Avg. Occupancy |
|---|---|---|---|---|
| Homewood | 150 | $5,842 | $595.57 | 40% |
| Carnelian Bay | 349 | $5,362 | $561.69 | 39% |
| Tahoma | 199 | $5,011 | $605.47 | 36% |
| Lake Almanor Country Club | 18 | $4,873 | $556.22 | 44% |
| Tahoe Vista | 233 | $4,606 | $480.30 | 38% |
| Shasta Lake | 23 | $4,482 | $423.63 | 47% |
| Tahoe City | 792 | $4,449 | $539.47 | 36% |
| Kings Beach | 451 | $4,427 | $470.97 | 38% |
| Truckee | 1,576 | $4,243 | $574.96 | 33% |
| Olympic Valley | 441 | $4,232 | $548.11 | 34% |