Soquel Airbnb Market Analysis 2026: Short Term Rental Data & Vacation Rental Statistics in California, United States
Is Airbnb profitable in Soquel in 2026? Explore comprehensive Airbnb analytics for Soquel, California, United States to uncover income potential. This 2026 STR market report for Soquel, based on AirROI data from February 2025 to January 2026, reveals key trends in the niche market of 31 active listings.
Whether you're considering an Airbnb investment in Soquel, optimizing your existing vacation rental, or exploring rental arbitrage opportunities, understanding the Soquel Airbnb data is crucial. Leveraging the low regulation environment is key to maximizing your short term rental income potential. Let's dive into the specifics.
Key Soquel Airbnb Performance Metrics Overview
Monthly Airbnb Revenue Variations & Income Potential in Soquel (2026)
Understanding the monthly revenue variations for Airbnb listings in Soquel is key to maximizing your short term rental income potential. Seasonality significantly impacts earnings. Our analysis, based on data from the past 12 months, shows that the peak revenue month for STRs in Soquel is typically July, while February often presents the lowest earnings, highlighting opportunities for strategic pricing adjustments during shoulder and low seasons. Explore the typical Airbnb income in Soquel across different performance tiers:
- Best-in-class properties (Top 10%) achieve $14,274+ monthly, often utilizing dynamic pricing and superior guest experiences.
- Strong performing properties (Top 25%) earn $5,738 or more, indicating effective management and desirable locations/amenities.
- Typical properties (Median) generate around $3,045 per month, representing the average market performance.
- Entry-level properties (Bottom 25%) see earnings around $1,704, often with potential for optimization.
Average Monthly Airbnb Earnings Trend in Soquel
Soquel Airbnb Occupancy Rate Trends (2026)
Maximize your bookings by understanding the Soquel STR occupancy trends. Seasonal demand shifts significantly influence how often properties are booked. Typically, Julysees the highest demand (peak season occupancy), while January experiences the lowest (low season). Effective strategies, like adjusting minimum stays or offering promotions, can boost occupancy during slower periods. Here's how different property tiers perform in Soquel:
- Best-in-class properties (Top 10%) achieve 85%+ occupancy, indicating high desirability and potentially optimized availability.
- Strong performing properties (Top 25%) maintain 62% or higher occupancy, suggesting good market fit and guest satisfaction.
- Typical properties (Median) have an occupancy rate around 45%.
- Entry-level properties (Bottom 25%) average 26% occupancy, potentially facing higher vacancy.
Average Monthly Occupancy Rate Trend in Soquel
Average Daily Rate (ADR) Airbnb Trends in Soquel (2026)
Effective short term rental pricing strategy in Soquel involves understanding monthly ADR fluctuations. The Average Daily Rate (ADR) for Airbnb in Soquel typically peaks in December and dips lowest during February. Leveraging Airbnb dynamic pricing tools or strategies based on this seasonality can significantly boost revenue. Here's a look at the typical nightly rates achieved:
- Best-in-class properties (Top 10%) command rates of $831+ per night, often due to premium features or locations.
- Strong performing properties (Top 25%) achieve nightly rates of $361 or more.
- Typical properties (Median) charge around $195 per night.
- Entry-level properties (Bottom 25%) earn around $145 per night.
Average Daily Rate (ADR) Trend by Month in Soquel
Get Live Soquel Market Intelligence 👇

Explore Real-time Analytics
Airbnb Seasonality Analysis & Trends in Soquel (2026)
Peak Season (July, June, August)
- Revenue averages $8,036 per month
- Occupancy rates average 63.6%
- Daily rates average $342
Shoulder Season
- Revenue averages $5,291 per month
- Occupancy maintains around 40.0%
- Daily rates hold near $338
Low Season (February, March, April)
- Revenue drops to average $3,368 per month
- Occupancy decreases to average 43.9%
- Daily rates adjust to average $322
Seasonality Insights for Soquel
- The Airbnb seasonality in Soquel shows highly seasonal trends requiring careful strategy. While the sections above show seasonal averages, it's also insightful to look at the extremes:
- During the high season, the absolute peak month showcases Soquel's highest earning potential, with monthly revenues capable of climbing to $8,670, occupancy reaching a high of 67.7%, and ADRs peaking at $349.
- Conversely, the slowest single month of the year, typically falling within the low season, marks the market's lowest point. In this month, revenue might dip to $2,256, occupancy could drop to 32.9%, and ADRs may adjust down to $311.
- Understanding both the seasonal averages and these monthly peaks and troughs in revenue, occupancy, and ADR is crucial for maximizing your Airbnb profit potential in Soquel.
Seasonal Strategies for Maximizing Profit
- Peak Season: Maximize revenue through premium pricing and potentially longer minimum stays. Ensure high availability.
- Low Season: Offer competitive pricing, special promotions (e.g., extended stay discounts), and flexible cancellation policies. Target off-season travelers like remote workers or budget-conscious guests.
- Shoulder Seasons: Implement dynamic pricing that balances peak and low rates. Target weekend travelers or specific events. Offer slightly more flexible terms than peak season.
- Regularly analyze your own performance against these Soquel seasonality benchmarks and adjust your pricing and availability strategy accordingly.
Best Areas for Airbnb Investment in Soquel (2026)
Exploring the top neighborhoods for short-term rentals in Soquel? This section highlights key areas, outlining why they are attractive for hosts and guests, along with notable local attractions. Consider these locations based on your target guest profile and investment strategy.
| Neighborhood / Area | Why Host Here? (Target Guests & Appeal) | Key Attractions & Landmarks |
|---|---|---|
| Soquel Village | A charming small town atmosphere with historic buildings and local shops, perfect for visitors looking for a quaint, relaxed experience close to Santa Cruz beaches. | Soquel Creek, Soquel Village Park, Local wineries, Art galleries, Nearby beaches |
| Capitola Beach | A beautiful beach town known for its colorful beachfront homes and vibrant community activities. Great for beachgoers and families. | Capitola Beach, Capitola Wharf, Capitola Village, Surfing spots, Restaurants and cafes |
| Santa Cruz Downtown | The bustling core of Santa Cruz with diverse dining, shopping, and entertainment options, drawing visitors looking to explore the lively local culture. | Pacific Avenue, Santa Cruz Beach Boardwalk, Downtown shops and restaurants, Art and cultural venues, Live music events |
| Seabright | A picturesque beachfront neighborhood known for its scenic views and close proximity to the Santa Cruz Beach Boardwalk and other attractions. | Seabright Beach, Santa Cruz Harbor, Restaurants and bars, Beach volleyball courts, Coastal trails |
| Forest of Nisene Marks State Park | Ideal for nature lovers and hikers, offering a peaceful retreat just minutes away from urban amenities. | Hiking and biking trails, Redwood trees, Scenic viewpoints, Wildlife viewing, Picnic areas |
| La Selva Beach | A residential beach community that offers a more relaxed and private atmosphere, attracting families and couples. | La Selva Beach, Local parks, Community events, Access to nature trails, Quiet beachfront |
| Mount Hermon | A mountain retreat area that attracts visitors looking for outdoor activities such as camping, hiking, and zip-lining in a natural setting. | Mount Hermon Adventures, Redwood trees, Skyline-to-the-Sea Trail, Outdoor recreational activities, Family-friendly programs |
| Aptos | A growing area with beautiful beaches and access to various outdoor adventures, popular with families and beach enthusiasts. | Rio del Mar Beach, Seacliff State Beach, Aptos Village, Local farmers' market, Scenic coastal trails |
Understanding Airbnb License Requirements & STR Laws in Soquel (2026)
While Soquel, California, United States currently shows low STR regulations, specific Airbnb license requirements might still exist or change. Always verify the latest short term rental regulations and Airbnb license requirements directly with local government authorities for Soquel to ensure full compliance before hosting.
(Source: AirROI data, 2026, finding no licensed listings among those analyzed)
Top Performing Airbnb Properties in Soquel (2026)
Benchmark your potential! Explore examples of top-performing Airbnb properties in Soquelbased on Trailing Twelve Month (TTM) revenue. Analyze their characteristics, revenue, occupancy rate, and ADR to understand what drives success in this market.

Soquel Villa | infinity pool, spa & movie theater
Entire Place • 5 bedrooms
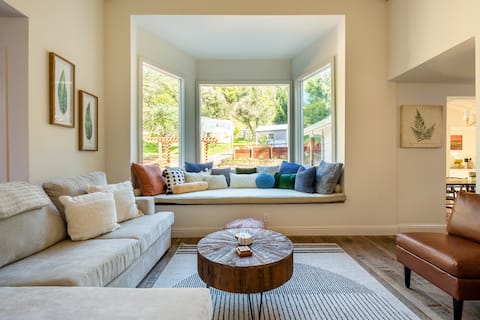
Spacious Family & Pet friendly home!
Entire Place • 4 bedrooms
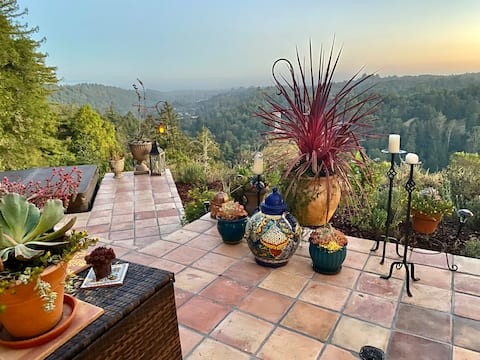
Serene Hacienda w/ Stunning Panoramic Ocean View
Entire Place • 3 bedrooms
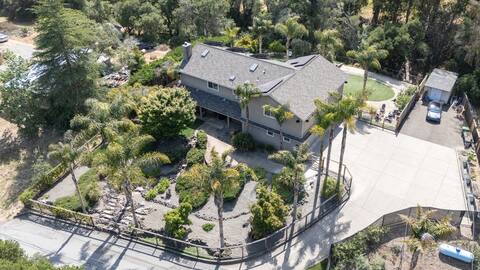
Private country estate - 10 minutes to the sand!
Entire Place • 5 bedrooms
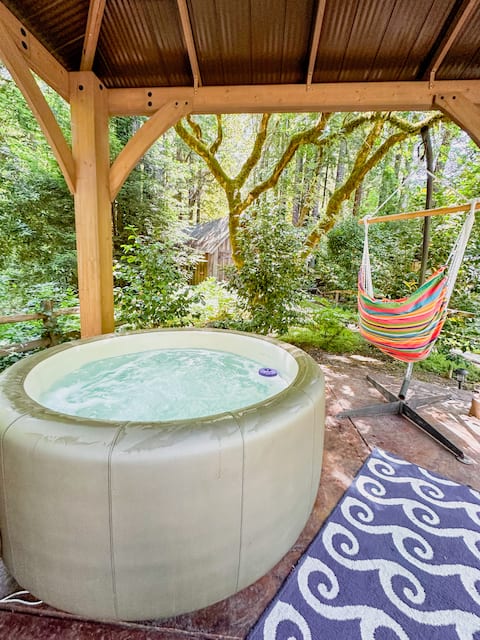
Coastal Redwood Cabin | Hot tub | Private Creek
Entire Place • 1 bedroom

Family Farmhouse
Entire Place • 4 bedrooms
Note: Performance varies based on location, size, amenities, seasonality, and management quality. Data reflects the past 12 months.
Top Performing Airbnb Hosts in Soquel (2026)
Learn from the best! This table showcases top-performing Airbnb hosts in Soquel based on the number of properties managed and estimated total revenue over the past year. Analyze their scale and performance metrics.
| Host Name | Properties | Grossing Revenue | Stay Reviews | Avg Rating |
|---|---|---|---|---|
| Matt | 1 | $317,349 | 32 | 5.00/5.0 |
| Crystal | 1 | $179,665 | 17 | 5.00/5.0 |
| Lisa | 1 | $172,621 | 18 | 5.00/5.0 |
| Emkay | 4 | $97,877 | 217 | 4.95/5.0 |
| Chris | 1 | $78,533 | 56 | 4.91/5.0 |
| Sarah | 1 | $74,268 | 187 | 4.99/5.0 |
| Allyson | 1 | $65,298 | 81 | 4.98/5.0 |
| Jerome | 1 | $59,963 | 226 | 4.79/5.0 |
| Lara | 1 | $56,130 | 81 | 4.94/5.0 |
| Robyn | 1 | $53,234 | 76 | 4.88/5.0 |
Analyzing the strategies of top hosts, such as their property selection, pricing, and guest communication, can offer valuable lessons for optimizing your own Airbnb operations in Soquel.
Dive Deeper: Advanced Soquel STR Market Data (2026)
Ready to unlock more insights? AirROI provides access to advanced metrics and comprehensive Airbnb data for Soquel. Explore detailed analytics beyond this report to refine your investment strategy, optimize pricing, and maximize your vacation rental profits.
Explore Advanced MetricsSoquel Short-Term Rental Market Composition (2026): Property & Room Types
Room Type Distribution
Property Type Distribution
Market Composition Insights for Soquel
- The Soquel Airbnb market composition is heavily skewed towards Entire Home/Apt listings, which make up 83.9% of the 31 active rentals. This indicates strong guest preference for privacy and space.
- Looking at the property type distribution in Soquel, House properties are the most common (48.4%), reflecting the local real estate landscape.
- Houses represent a significant 48.4% portion, catering likely to families or larger groups.
- The presence of 9.7% Hotel/Boutique listings indicates integration with traditional hospitality.
Soquel Airbnb Room Capacity Analysis (2026): Bedroom Distribution
Distribution of Listings by Number of Bedrooms
Room Capacity Insights for Soquel
- The dominant room capacity in Soquel is 1 bedroom listings, making up 45.2% of the market. This suggests a strong demand for properties suitable for couples or solo travelers.
- Together, 1 bedroom and 2 bedrooms properties represent 64.6% of the active Airbnb listings in Soquel, indicating a high concentration in these sizes.
- A significant 25.9% of listings offer 3+ bedrooms, catering to larger groups and families seeking more space in Soquel.
Soquel Vacation Rental Guest Capacity Trends (2026)
Distribution of Listings by Guest Capacity
Guest Capacity Insights for Soquel
- The most common guest capacity trend in Soquel vacation rentals is listings accommodating 2 guests (29%). This suggests the primary traveler segment is likely couples or solo travelers.
- Properties designed for 2 guests and 4 guests dominate the Soquel STR market, accounting for 51.6% of listings.
- 29.1% of properties accommodate 6+ guests, serving the market segment for larger families or group travel in Soquel.
- On average, properties in Soquel are equipped to host 3.9 guests.
Soquel Airbnb Booking Patterns (2026): Available vs. Booked Days
Available Days Distribution
Booked Days Distribution
Booking Pattern Insights for Soquel
- The most common availability pattern in Soquel falls within the 181-270 days range, representing 41.9% of listings. This suggests many properties have significant open periods on their calendars.
- Approximately 77.4% of listings show high availability (181+ days open annually), indicating potential for increased bookings or specific owner usage patterns.
- For booked days, the 91-180 days range is most frequent in Soquel (38.7%), reflecting common guest stay durations or potential owner blocking patterns.
- A notable 25.9% of properties secure long booking periods (181+ days booked per year), highlighting successful long-term rental strategies or significant owner usage.
Soquel Airbnb Minimum Stay Requirements Analysis
Distribution of Listings by Minimum Night Requirement
1 Night
4 listings
12.9% of total
2 Nights
14 listings
45.2% of total
3 Nights
1 listings
3.2% of total
4-6 Nights
2 listings
6.5% of total
7-29 Nights
1 listings
3.2% of total
30+ Nights
9 listings
29% of total
Key Insights
- The most prevalent minimum stay requirement in Soquel is 2 Nights, adopted by 45.2% of listings. This highlights the market's preference for shorter, flexible bookings.
- A significant segment (29%) caters to monthly stays (30+ nights) in Soquel, pointing to opportunities in the extended-stay market.
Recommendations
- Align with the market by considering a 2 Nights minimum stay, as 45.2% of Soquel hosts use this setting.
- If feasible, allowing 1-night stays, especially midweek or during low season, could capture last-minute bookings, as only 12.9% currently do.
- A 2-night minimum appears standard (45.2%). Consider this for weekends or peak periods.
- Explore offering discounts for stays of 30+ nights to attract the 29% of the market seeking extended stays.
- Adjust minimum nights based on seasonality – potentially shorter during low season and longer during peak demand periods in Soquel.
Soquel Airbnb Cancellation Policy Trends Analysis (2026)
Flexible
1 listings
3.2% of total
Moderate
10 listings
32.3% of total
Firm
19 listings
61.3% of total
Strict
1 listings
3.2% of total
Cancellation Policy Insights for Soquel
- The prevailing Airbnb cancellation policy trend in Soquel is Firm, used by 61.3% of listings.
- A majority (64.5%) of hosts in Soquel utilize Firm or Strict policies, indicating a market where hosts prioritize booking security.
- Strict cancellation policies are quite rare (3.2%), potentially making listings with this policy less competitive unless justified by high demand or property type.
Recommendations for Hosts
- Consider adopting a Firm policy to align with the 61.3% market standard in Soquel.
- Using a Strict policy might deter some guests, as only 3.2% of listings use it. Evaluate if potential revenue protection outweighs possible lower booking rates.
- Regularly review your cancellation policy against competitors and market demand shifts in Soquel.
Soquel STR Booking Lead Time Analysis (2026)
Average Booking Lead Time by Month
Booking Lead Time Insights for Soquel
- The overall average booking lead time for vacation rentals in Soquel is 46 days.
- Guests book furthest in advance for stays during December (average 64 days), likely coinciding with peak travel demand or local events.
- The shortest booking windows occur for stays in February (average 21 days), indicating more last-minute travel plans during this time.
- Seasonally, Fall (54 days avg.) sees the longest lead times, while Spring (29 days avg.) has the shortest, reflecting typical travel planning cycles.
Recommendations for Hosts
- Use the overall average lead time (46 days) as a baseline for your pricing and availability strategy in Soquel.
- For December stays, consider implementing length-of-stay discounts or slightly higher rates for bookings made less than 64 days out to capitalize on advance planning.
- Target marketing efforts for the Fall season well in advance (at least 54 days) to capture early planners.
- Monitor your own booking lead times against these Soquel averages to identify opportunities for dynamic pricing adjustments.
Popular & Essential Airbnb Amenities in Soquel (2026)
Amenity Prevalence
Amenity Insights for Soquel
- Popular amenities like Smoke alarm, Coffee maker, Hot water are common but not universal. Offering these can provide a competitive edge.
- Warning: Wifi is not universally provided but is considered essential globally. Ensure reliable Wifi is offered.
Recommendations for Hosts
- Consider adding popular differentiators like Smoke alarm or Coffee maker to increase appeal.
- Highlight unique or less common amenities you offer (e.g., hot tub, dedicated workspace, EV charger) in your listing description and photos.
- Regularly check competitor amenities in Soquel to stay competitive.
Soquel Airbnb Guest Demographics & Profile Analysis (2026)
Guest Profile Summary for Soquel
- The typical guest profile for Airbnb in Soquel consists of primarily domestic travelers (96%), often arriving from nearby San Francisco, typically belonging to the Post-2000s (Gen Z/Alpha) group (50%), primarily speaking English or Spanish.
- Domestic travelers account for 95.5% of guests.
- Key international markets include United States (95.5%) and United Kingdom (0.6%).
- Top languages spoken are English (59.5%) followed by Spanish (16.1%).
- A significant demographic segment is the Post-2000s (Gen Z/Alpha) group, representing 50% of guests.
Recommendations for Hosts
- Target domestic marketing efforts towards travelers from San Francisco and Los Angeles.
- Tailor amenities and listing descriptions to appeal to the dominant Post-2000s (Gen Z/Alpha) demographic (e.g., highlight fast WiFi, smart home features, local guides).
- Highlight unique local experiences or amenities relevant to the primary guest profile.
- Consider seasonal promotions aligned with peak travel times for key origin markets.
Nearby Short-Term Rental Market Comparison
How does the Soquel Airbnb market stack up against its neighbors? Compare key performance metrics like average monthly revenue, ADR, and occupancy rates in surrounding areas to understand the broader regional STR landscape.
| Market | Active Properties | Monthly Revenue | Daily Rate | Avg. Occupancy |
|---|---|---|---|---|
| Carmel Point | 15 | $14,483 | $1046.17 | 54% |
| Del Monte Forest | 105 | $10,280 | $964.89 | 47% |
| Moss Beach | 34 | $10,092 | $676.91 | 53% |
| Sonoma | 228 | $9,647 | $819.87 | 43% |
| Marshall | 18 | $8,897 | $607.75 | 50% |
| St. Helena | 50 | $8,684 | $924.70 | 38% |
| Carmel-by-the-Sea | 305 | $8,657 | $680.02 | 49% |
| Kenwood | 60 | $8,643 | $810.83 | 41% |
| Glen Ellen | 85 | $8,482 | $799.53 | 43% |
| Eldridge | 21 | $8,410 | $930.61 | 41% |