Tahoma Airbnb Market Analysis 2026: Short Term Rental Data & Vacation Rental Statistics in California, United States
Is Airbnb profitable in Tahoma in 2026? Explore comprehensive Airbnb analytics for Tahoma, California, United States to uncover income potential. This 2026 STR market report for Tahoma, based on AirROI data from February 2025 to January 2026, reveals key trends in the niche market of 199 active listings.
Whether you're considering an Airbnb investment in Tahoma, optimizing your existing vacation rental, or exploring rental arbitrage opportunities, understanding the Tahoma Airbnb data is crucial. Navigating the high regulation landscape is key to maximizing your short term rental income potential. Let's dive into the specifics.
Key Tahoma Airbnb Performance Metrics Overview
Monthly Airbnb Revenue Variations & Income Potential in Tahoma (2026)
Understanding the monthly revenue variations for Airbnb listings in Tahoma is key to maximizing your short term rental income potential. Seasonality significantly impacts earnings. Our analysis, based on data from the past 12 months, shows that the peak revenue month for STRs in Tahoma is typically July, while November often presents the lowest earnings, highlighting opportunities for strategic pricing adjustments during shoulder and low seasons. Explore the typical Airbnb income in Tahoma across different performance tiers:
- Best-in-class properties (Top 10%) achieve $12,742+ monthly, often utilizing dynamic pricing and superior guest experiences.
- Strong performing properties (Top 25%) earn $7,916 or more, indicating effective management and desirable locations/amenities.
- Typical properties (Median) generate around $4,954 per month, representing the average market performance.
- Entry-level properties (Bottom 25%) see earnings around $2,726, often with potential for optimization.
Average Monthly Airbnb Earnings Trend in Tahoma
Tahoma Airbnb Occupancy Rate Trends (2026)
Maximize your bookings by understanding the Tahoma STR occupancy trends. Seasonal demand shifts significantly influence how often properties are booked. Typically, Julysees the highest demand (peak season occupancy), while November experiences the lowest (low season). Effective strategies, like adjusting minimum stays or offering promotions, can boost occupancy during slower periods. Here's how different property tiers perform in Tahoma:
- Best-in-class properties (Top 10%) achieve 67%+ occupancy, indicating high desirability and potentially optimized availability.
- Strong performing properties (Top 25%) maintain 50% or higher occupancy, suggesting good market fit and guest satisfaction.
- Typical properties (Median) have an occupancy rate around 34%.
- Entry-level properties (Bottom 25%) average 20% occupancy, potentially facing higher vacancy.
Average Monthly Occupancy Rate Trend in Tahoma
Average Daily Rate (ADR) Airbnb Trends in Tahoma (2026)
Effective short term rental pricing strategy in Tahoma involves understanding monthly ADR fluctuations. The Average Daily Rate (ADR) for Airbnb in Tahoma typically peaks in July and dips lowest during March. Leveraging Airbnb dynamic pricing tools or strategies based on this seasonality can significantly boost revenue. Here's a look at the typical nightly rates achieved:
- Best-in-class properties (Top 10%) command rates of $912+ per night, often due to premium features or locations.
- Strong performing properties (Top 25%) achieve nightly rates of $614 or more.
- Typical properties (Median) charge around $451 per night.
- Entry-level properties (Bottom 25%) earn around $337 per night.
Average Daily Rate (ADR) Trend by Month in Tahoma
Get Live Tahoma Market Intelligence 👇

Explore Real-time Analytics
Airbnb Seasonality Analysis & Trends in Tahoma (2026)
Peak Season (July, August, June)
- Revenue averages $11,843 per month
- Occupancy rates average 55.0%
- Daily rates average $622
Shoulder Season
- Revenue averages $5,749 per month
- Occupancy maintains around 32.7%
- Daily rates hold near $578
Low Season (April, October, November)
- Revenue drops to average $4,442 per month
- Occupancy decreases to average 26.4%
- Daily rates adjust to average $549
Seasonality Insights for Tahoma
- The Airbnb seasonality in Tahoma shows highly seasonal trends requiring careful strategy. While the sections above show seasonal averages, it's also insightful to look at the extremes:
- During the high season, the absolute peak month showcases Tahoma's highest earning potential, with monthly revenues capable of climbing to $14,142, occupancy reaching a high of 62.8%, and ADRs peaking at $646.
- Conversely, the slowest single month of the year, typically falling within the low season, marks the market's lowest point. In this month, revenue might dip to $4,060, occupancy could drop to 23.6%, and ADRs may adjust down to $535.
- Understanding both the seasonal averages and these monthly peaks and troughs in revenue, occupancy, and ADR is crucial for maximizing your Airbnb profit potential in Tahoma.
Seasonal Strategies for Maximizing Profit
- Peak Season: Maximize revenue through premium pricing and potentially longer minimum stays. Ensure high availability.
- Low Season: Offer competitive pricing, special promotions (e.g., extended stay discounts), and flexible cancellation policies. Target off-season travelers like remote workers or budget-conscious guests.
- Shoulder Seasons: Implement dynamic pricing that balances peak and low rates. Target weekend travelers or specific events. Offer slightly more flexible terms than peak season.
- Regularly analyze your own performance against these Tahoma seasonality benchmarks and adjust your pricing and availability strategy accordingly.
Best Areas for Airbnb Investment in Tahoma (2026)
Exploring the top neighborhoods for short-term rentals in Tahoma? This section highlights key areas, outlining why they are attractive for hosts and guests, along with notable local attractions. Consider these locations based on your target guest profile and investment strategy.
| Neighborhood / Area | Why Host Here? (Target Guests & Appeal) | Key Attractions & Landmarks |
|---|---|---|
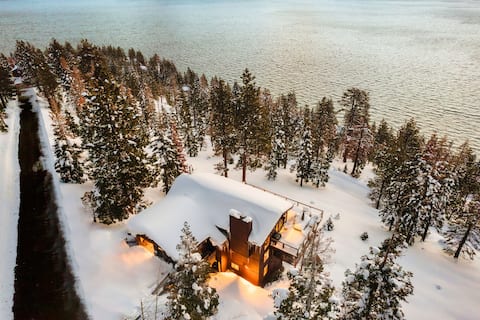
| Tahoma Beach | A peaceful lakeside community with beautiful views of Lake Tahoe, perfect for those seeking a tranquil getaway. Attracts families, nature lovers, and outdoor enthusiasts year-round. | Lake Tahoe, Tahoma Market, Meeks Bay, Emerald Bay State Park, Sugar Pine Point State Park, West Shore Cafe |
| Homewood | Known for its stunning views and proximity to ski areas, Homewood is ideal for winter sports enthusiasts and summer vacationers alike, making it a year-round rental market. | Homewood Mountain Resort, Lake Tahoe, Old Homewood Post Office, Eagle Lake Trail, West Shore Market |
| Carnelian Bay | A charming area with easy access to both the lake and mountains, popular for water sports in summer and skiing in winter, appealing to a diverse range of guests. | Carnelian Bay Beach, North Tahoe Marina, Speedboat Beach, Garwoods Grill & Pier, D.L. Bliss State Park |
| Kings Beach | One of the most popular beach spots on the north shore of Lake Tahoe, attracting a mix of tourists and locals looking for recreation and entertainment options. | Kings Beach State Recreation Area, Lake Tahoe Historical Society Museum, Golf Courses, Restaurants and Nightlife, Kings Beach Plaza |
| Incline Village | Located on the north shore of Lake Tahoe, this affluent area is attractive for those seeking golf, beaches, and upscale dining, making it popular for luxury short-term rentals. | Incline Village Beach, Diamond Peak Ski Resort, Lake Tahoe Nevada State Park, Championship Golf Course, Crystal Bay |
| Meeks Bay | A beautiful, serene beach area known for its stunning views and less crowded atmosphere, perfect for families looking for a relaxing retreat. | Meeks Bay Resort, Meeks Bay Campground, Desolation Wilderness, West Shore Trail, Paddling and kayaking opportunities |
| Truckee | Just a short drive from the lake, Truckee offers a charming historic downtown and access to both skiing and summer activities, making it a year-round tourist draw. | Old Truckee Jail Museum, Truckee River Regional Park, Donner Lake, Northstar California Resort, Truckee Thursdays |
| Tahoe City | A bustling little town with a vibrant lakeside atmosphere, perfect for tourists interested in outdoor activities, dining, and shopping. | Commons Beach, Tahoe City Marina, Donner Memorial State Park, Lake Tahoe Historical Society, Tahoe Rim Trail |
Understanding Airbnb License Requirements & STR Laws in Tahoma (2026)
Yes, Tahoma, California, United States enforces high STR regulations. Obtaining a license and ensuring compliance is almost certainly required according to current 2026 STR laws. Always verify the latest short term rental regulations and Airbnb license requirements directly with local government authorities for Tahoma to ensure full compliance before hosting.
(Source: AirROI data, 2026, based on 39% licensed listings)
Top Performing Airbnb Properties in Tahoma (2026)
Benchmark your potential! Explore examples of top-performing Airbnb properties in Tahomabased on Trailing Twelve Month (TTM) revenue. Analyze their characteristics, revenue, occupancy rate, and ADR to understand what drives success in this market.
StayLuxe Rubicon | Heller House
Entire Place • 5 bedrooms
Alpenglow Aerie | Luxe Lakeview Chalet | Hot Tub
Entire Place • 5 bedrooms
7 bedroom Lakefront Estate
Entire Place • 7 bedrooms
Peaceful Waters by Hauserman Rentals
Entire Place • 5 bedrooms
LAKEFRONT "Caesar's Alpine Palace" on Rubicon Bay
Entire Place • 5 bedrooms
Ref-Nest
Entire Place • 6 bedrooms
Note: Performance varies based on location, size, amenities, seasonality, and management quality. Data reflects the past 12 months.
Top Performing Airbnb Hosts in Tahoma (2026)
Learn from the best! This table showcases top-performing Airbnb hosts in Tahoma based on the number of properties managed and estimated total revenue over the past year. Analyze their scale and performance metrics.
| Host Name | Properties | Grossing Revenue | Stay Reviews | Avg Rating |
|---|---|---|---|---|
| Traci And Benjamin | 3 | $1,333,526 | 160 | 4.98/5.0 |
| Grand Welcome | 14 | $811,026 | 405 | 4.51/5.0 |
| AvantStay Lake Tahoe | 11 | $727,129 | 447 | 4.75/5.0 |
| Tahoe Getaways LLC | 10 | $613,963 | 204 | 4.70/5.0 |
| First Accommodations | 9 | $576,364 | 428 | 4.76/5.0 |
| Hauserman Rental Group | 7 | $538,117 | 155 | 4.92/5.0 |
| Tahoe Rental | 11 | $425,961 | 54 | 4.76/5.0 |
| Mark | 1 | $354,477 | 23 | 4.78/5.0 |
| Susan | 1 | $282,372 | 22 | 5.00/5.0 |
| LocalVR Tahoe | 3 | $237,283 | 79 | 4.82/5.0 |
Analyzing the strategies of top hosts, such as their property selection, pricing, and guest communication, can offer valuable lessons for optimizing your own Airbnb operations in Tahoma.
Dive Deeper: Advanced Tahoma STR Market Data (2026)
Ready to unlock more insights? AirROI provides access to advanced metrics and comprehensive Airbnb data for Tahoma. Explore detailed analytics beyond this report to refine your investment strategy, optimize pricing, and maximize your vacation rental profits.
Explore Advanced MetricsTahoma Short-Term Rental Market Composition (2026): Property & Room Types
Room Type Distribution
Property Type Distribution
Market Composition Insights for Tahoma
- The Tahoma Airbnb market composition is heavily skewed towards Entire Home/Apt listings, which make up 99% of the 199 active rentals. This indicates strong guest preference for privacy and space.
- Looking at the property type distribution in Tahoma, House properties are the most common (59.8%), reflecting the local real estate landscape.
- Houses represent a significant 59.8% portion, catering likely to families or larger groups.
- Smaller segments like apartment/condo, others, hotel/boutique (combined 5.0%) offer potential for unique stay experiences.
Tahoma Airbnb Room Capacity Analysis (2026): Bedroom Distribution
Distribution of Listings by Number of Bedrooms
Room Capacity Insights for Tahoma
- The dominant room capacity in Tahoma is 3 bedrooms listings, making up 40.2% of the market. This suggests a strong demand for properties suitable for families or small groups.
- Together, 3 bedrooms and 4 bedrooms properties represent 69.8% of the active Airbnb listings in Tahoma, indicating a high concentration in these sizes.
- A significant 78.8% of listings offer 3+ bedrooms, catering to larger groups and families seeking more space in Tahoma.
Tahoma Vacation Rental Guest Capacity Trends (2026)
Distribution of Listings by Guest Capacity
Guest Capacity Insights for Tahoma
- The most common guest capacity trend in Tahoma vacation rentals is listings accommodating 8+ guests (48.7%). This suggests the primary traveler segment is likely larger groups.
- Properties designed for 8+ guests and 6 guests dominate the Tahoma STR market, accounting for 80.4% of listings.
- 81.9% of properties accommodate 6+ guests, serving the market segment for larger families or group travel in Tahoma.
- On average, properties in Tahoma are equipped to host 6.5 guests.
Tahoma Airbnb Booking Patterns (2026): Available vs. Booked Days
Available Days Distribution
Booked Days Distribution
Booking Pattern Insights for Tahoma
- The most common availability pattern in Tahoma falls within the 271-366 days range, representing 52.3% of listings. This suggests many properties have significant open periods on their calendars.
- Approximately 89.5% of listings show high availability (181+ days open annually), indicating potential for increased bookings or specific owner usage patterns.
- For booked days, the 91-180 days range is most frequent in Tahoma (40.2%), reflecting common guest stay durations or potential owner blocking patterns.
- A notable 11.1% of properties secure long booking periods (181+ days booked per year), highlighting successful long-term rental strategies or significant owner usage.
Tahoma Airbnb Minimum Stay Requirements Analysis
Distribution of Listings by Minimum Night Requirement
1 Night
4 listings
2% of total
2 Nights
54 listings
27.1% of total
3 Nights
12 listings
6% of total
4-6 Nights
6 listings
3% of total
7-29 Nights
9 listings
4.5% of total
30+ Nights
114 listings
57.3% of total
Key Insights
- The most prevalent minimum stay requirement in Tahoma is 30+ Nights, adopted by 57.3% of listings. This highlights the market's preference for longer commitments.
- A significant segment (57.3%) caters to monthly stays (30+ nights) in Tahoma, pointing to opportunities in the extended-stay market.
Recommendations
- Align with the market by considering a 30+ Nights minimum stay, as 57.3% of Tahoma hosts use this setting.
- If feasible, allowing 1-night stays, especially midweek or during low season, could capture last-minute bookings, as only 2% currently do.
- Explore offering discounts for stays of 30+ nights to attract the 57.3% of the market seeking extended stays.
- Adjust minimum nights based on seasonality – potentially shorter during low season and longer during peak demand periods in Tahoma.
Tahoma Airbnb Cancellation Policy Trends Analysis (2026)
Super Strict 60 Days
5 listings
2.5% of total
Super Strict 30 Days
26 listings
13.1% of total
Limited
1 listings
0.5% of total
Flexible
9 listings
4.5% of total
Moderate
14 listings
7% of total
Firm
114 listings
57.3% of total
Strict
30 listings
15.1% of total
Cancellation Policy Insights for Tahoma
- The prevailing Airbnb cancellation policy trend in Tahoma is Firm, used by 57.3% of listings.
- A majority (72.4%) of hosts in Tahoma utilize Firm or Strict policies, indicating a market where hosts prioritize booking security.
Recommendations for Hosts
- Consider adopting a Firm policy to align with the 57.3% market standard in Tahoma.
- Regularly review your cancellation policy against competitors and market demand shifts in Tahoma.
Tahoma STR Booking Lead Time Analysis (2026)
Average Booking Lead Time by Month
Booking Lead Time Insights for Tahoma
- The overall average booking lead time for vacation rentals in Tahoma is 54 days.
- Guests book furthest in advance for stays during July (average 97 days), likely coinciding with peak travel demand or local events.
- The shortest booking windows occur for stays in March (average 30 days), indicating more last-minute travel plans during this time.
- Seasonally, Summer (83 days avg.) sees the longest lead times, while Spring (40 days avg.) has the shortest, reflecting typical travel planning cycles.
Recommendations for Hosts
- Use the overall average lead time (54 days) as a baseline for your pricing and availability strategy in Tahoma.
- For July stays, consider implementing length-of-stay discounts or slightly higher rates for bookings made less than 97 days out to capitalize on advance planning.
- Target marketing efforts for the Summer season well in advance (at least 83 days) to capture early planners.
- Monitor your own booking lead times against these Tahoma averages to identify opportunities for dynamic pricing adjustments.
Popular & Essential Airbnb Amenities in Tahoma (2026)
Amenity Prevalence
Amenity Insights for Tahoma
- Essential amenities in Tahoma that guests expect include: Free parking on premises, Smoke alarm, Carbon monoxide alarm, Wifi, TV, Refrigerator, Heating, Kitchen, Coffee maker, Dishes and silverware. Lacking these (any) could significantly impact bookings.
Recommendations for Hosts
- Ensure your listing includes all essential amenities for Tahoma: Free parking on premises, Smoke alarm, Carbon monoxide alarm, Wifi, TV, Refrigerator, Heating, Kitchen, Coffee maker, Dishes and silverware.
- Prioritize adding missing essentials: Wifi, TV, Refrigerator, Heating, Kitchen, Coffee maker, Dishes and silverware.
- Highlight unique or less common amenities you offer (e.g., hot tub, dedicated workspace, EV charger) in your listing description and photos.
- Regularly check competitor amenities in Tahoma to stay competitive.
Tahoma Airbnb Guest Demographics & Profile Analysis (2026)
Guest Profile Summary for Tahoma
- The typical guest profile for Airbnb in Tahoma consists of primarily domestic travelers (95%), often arriving from nearby San Francisco, typically belonging to the Post-2000s (Gen Z/Alpha) group (50%), primarily speaking English or Spanish.
- Domestic travelers account for 94.5% of guests.
- Key international markets include United States (94.5%) and United Kingdom (1.2%).
- Top languages spoken are English (61.7%) followed by Spanish (14.3%).
- A significant demographic segment is the Post-2000s (Gen Z/Alpha) group, representing 50% of guests.
Recommendations for Hosts
- Target domestic marketing efforts towards travelers from San Francisco and Los Angeles.
- Tailor amenities and listing descriptions to appeal to the dominant Post-2000s (Gen Z/Alpha) demographic (e.g., highlight fast WiFi, smart home features, local guides).
- Highlight unique local experiences or amenities relevant to the primary guest profile.
- Consider seasonal promotions aligned with peak travel times for key origin markets.
Nearby Short-Term Rental Market Comparison
How does the Tahoma Airbnb market stack up against its neighbors? Compare key performance metrics like average monthly revenue, ADR, and occupancy rates in surrounding areas to understand the broader regional STR landscape.
| Market | Active Properties | Monthly Revenue | Daily Rate | Avg. Occupancy |
|---|---|---|---|---|
| Zephyr Cove | 192 | $6,404 | $642.42 | 37% |
| Homewood | 150 | $5,842 | $595.57 | 40% |
| Meyers | 177 | $5,840 | $500.97 | 43% |
| Glenbrook | 32 | $5,788 | $841.74 | 35% |
| Carnelian Bay | 349 | $5,362 | $561.69 | 39% |
| Incline Village-Crystal Bay | 204 | $5,197 | $589.54 | 35% |
| Lake Almanor Country Club | 18 | $4,873 | $556.22 | 44% |
| Tahoe Vista | 233 | $4,606 | $480.30 | 38% |
| Tahoe City | 792 | $4,449 | $539.47 | 36% |
| Kings Beach | 451 | $4,427 | $470.97 | 38% |