Toro Canyon Airbnb Market Analysis 2026: Short Term Rental Data & Vacation Rental Statistics in California, United States
Is Airbnb profitable in Toro Canyon in 2026? Explore comprehensive Airbnb analytics for Toro Canyon, California, United States to uncover income potential. This 2026 STR market report for Toro Canyon, based on AirROI data from February 2025 to January 2026, reveals key trends in the niche market of 33 active listings.
Whether you're considering an Airbnb investment in Toro Canyon, optimizing your existing vacation rental, or exploring rental arbitrage opportunities, understanding the Toro Canyon Airbnb data is crucial. Leveraging the low regulation environment is key to maximizing your short term rental income potential. Let's dive into the specifics.
Key Toro Canyon Airbnb Performance Metrics Overview
Monthly Airbnb Revenue Variations & Income Potential in Toro Canyon (2026)
Understanding the monthly revenue variations for Airbnb listings in Toro Canyon is key to maximizing your short term rental income potential. Seasonality significantly impacts earnings. Our analysis, based on data from the past 12 months, shows that the peak revenue month for STRs in Toro Canyon is typically July, while December often presents the lowest earnings, highlighting opportunities for strategic pricing adjustments during shoulder and low seasons. Explore the typical Airbnb income in Toro Canyon across different performance tiers:
- Best-in-class properties (Top 10%) achieve $22,515+ monthly, often utilizing dynamic pricing and superior guest experiences.
- Strong performing properties (Top 25%) earn $9,309 or more, indicating effective management and desirable locations/amenities.
- Typical properties (Median) generate around $4,810 per month, representing the average market performance.
- Entry-level properties (Bottom 25%) see earnings around $2,588, often with potential for optimization.
Average Monthly Airbnb Earnings Trend in Toro Canyon
Toro Canyon Airbnb Occupancy Rate Trends (2026)
Maximize your bookings by understanding the Toro Canyon STR occupancy trends. Seasonal demand shifts significantly influence how often properties are booked. Typically, Julysees the highest demand (peak season occupancy), while December experiences the lowest (low season). Effective strategies, like adjusting minimum stays or offering promotions, can boost occupancy during slower periods. Here's how different property tiers perform in Toro Canyon:
- Best-in-class properties (Top 10%) achieve 81%+ occupancy, indicating high desirability and potentially optimized availability.
- Strong performing properties (Top 25%) maintain 66% or higher occupancy, suggesting good market fit and guest satisfaction.
- Typical properties (Median) have an occupancy rate around 42%.
- Entry-level properties (Bottom 25%) average 22% occupancy, potentially facing higher vacancy.
Average Monthly Occupancy Rate Trend in Toro Canyon
Average Daily Rate (ADR) Airbnb Trends in Toro Canyon (2026)
Effective short term rental pricing strategy in Toro Canyon involves understanding monthly ADR fluctuations. The Average Daily Rate (ADR) for Airbnb in Toro Canyon typically peaks in December and dips lowest during February. Leveraging Airbnb dynamic pricing tools or strategies based on this seasonality can significantly boost revenue. Here's a look at the typical nightly rates achieved:
- Best-in-class properties (Top 10%) command rates of $1,634+ per night, often due to premium features or locations.
- Strong performing properties (Top 25%) achieve nightly rates of $949 or more.
- Typical properties (Median) charge around $326 per night.
- Entry-level properties (Bottom 25%) earn around $201 per night.
Average Daily Rate (ADR) Trend by Month in Toro Canyon
Get Live Toro Canyon Market Intelligence 👇
Explore Real-time Analytics
Airbnb Seasonality Analysis & Trends in Toro Canyon (2026)
Peak Season (July, August, June)
- Revenue averages $11,376 per month
- Occupancy rates average 53.8%
- Daily rates average $640
Shoulder Season
- Revenue averages $8,474 per month
- Occupancy maintains around 42.7%
- Daily rates hold near $637
Low Season (January, September, December)
- Revenue drops to average $6,092 per month
- Occupancy decreases to average 37.1%
- Daily rates adjust to average $692
Seasonality Insights for Toro Canyon
- The Airbnb seasonality in Toro Canyon shows highly seasonal trends requiring careful strategy. While the sections above show seasonal averages, it's also insightful to look at the extremes:
- During the high season, the absolute peak month showcases Toro Canyon's highest earning potential, with monthly revenues capable of climbing to $12,228, occupancy reaching a high of 59.2%, and ADRs peaking at $706.
- Conversely, the slowest single month of the year, typically falling within the low season, marks the market's lowest point. In this month, revenue might dip to $5,744, occupancy could drop to 34.1%, and ADRs may adjust down to $588.
- Understanding both the seasonal averages and these monthly peaks and troughs in revenue, occupancy, and ADR is crucial for maximizing your Airbnb profit potential in Toro Canyon.
Seasonal Strategies for Maximizing Profit
- Peak Season: Maximize revenue through premium pricing and potentially longer minimum stays. Ensure high availability.
- Low Season: Offer competitive pricing, special promotions (e.g., extended stay discounts), and flexible cancellation policies. Target off-season travelers like remote workers or budget-conscious guests.
- Shoulder Seasons: Implement dynamic pricing that balances peak and low rates. Target weekend travelers or specific events. Offer slightly more flexible terms than peak season.
- Regularly analyze your own performance against these Toro Canyon seasonality benchmarks and adjust your pricing and availability strategy accordingly.
Best Areas for Airbnb Investment in Toro Canyon (2026)
Exploring the top neighborhoods for short-term rentals in Toro Canyon? This section highlights key areas, outlining why they are attractive for hosts and guests, along with notable local attractions. Consider these locations based on your target guest profile and investment strategy.
| Neighborhood / Area | Why Host Here? (Target Guests & Appeal) | Key Attractions & Landmarks |
|---|---|---|
| Toro Canyon Park | A beautiful park area known for its scenic views, hiking trails, and proximity to nature. It's perfect for guests seeking a peaceful retreat close to outdoor activities. | Toro Canyon Park Hiking Trails, Scenic Overlook, Wildlife Watching, Picnic Areas |
| Carpinteria Beach | A charming beach town close to Toro Canyon, known for its friendly atmosphere and wide sandy beaches. Ideal for families and vacationers looking for beach fun. | Carpinteria State Beach, Carpinteria Bluffs Nature Preserve, Seal Sanctuary, Downtown Carpinteria Shopping |
| Santa Barbara | A short drive from Toro Canyon, this city boasts stunning architecture, cultural attractions, and beautiful beaches. Attractive to travelers looking for a blend of coastal and urban experiences. | Santa Barbara Mission, Stearns Wharf, Santa Barbara County Courthouse, State Street, Santa Barbara Zoo |
| Montecito | An upscale community adjacent to Toro Canyon known for its luxury estates and tranquil environment. Draws visitors interested in high-end living and celebrity sightings. | Lotusland, Montecito Village, Butterfly Beach, Celebrities' Homes Tours |
| Ojai | A picturesque town known for its artsy vibe and stunning valley views. Popular among visitors looking for a retreat and cultural experiences. | Ojai Valley Inn, Ojai Farmers Market, Krishnamurti Foundation, Ventura River Trail |
| Los Padres National Forest | A vast forest area offering abundant outdoor activities like hiking, camping, and wildlife watching. Perfect for nature lovers and adventure seekers. | Hiking Trails, Camping Areas, Scenic Drives, Wildlife Viewing |
| Summerland | A quaint seaside community with charming shops and beach access. Great for tourists looking for a quieter beach experience and local dining options. | Summerland Beach, Local Art Galleries, Santa Barbara Wine Country Tours |
| Goleta | A coastal city near Toro Canyon, offering a blend of beaches and parks. Appeals to visitors seeking a relaxed coastal atmosphere and family-friendly activities. | Goleta Beach, Sandpiper Golf Club, Lake Los Carneros, University of California, Santa Barbara |
Understanding Airbnb License Requirements & STR Laws in Toro Canyon (2026)
While Toro Canyon, California, United States currently shows low STR regulations, specific Airbnb license requirements might still exist or change. Always verify the latest short term rental regulations and Airbnb license requirements directly with local government authorities for Toro Canyon to ensure full compliance before hosting.
(Source: AirROI data, 2026, finding no licensed listings among those analyzed)
Top Performing Airbnb Properties in Toro Canyon (2026)
Benchmark your potential! Explore examples of top-performing Airbnb properties in Toro Canyonbased on Trailing Twelve Month (TTM) revenue. Analyze their characteristics, revenue, occupancy rate, and ADR to understand what drives success in this market.
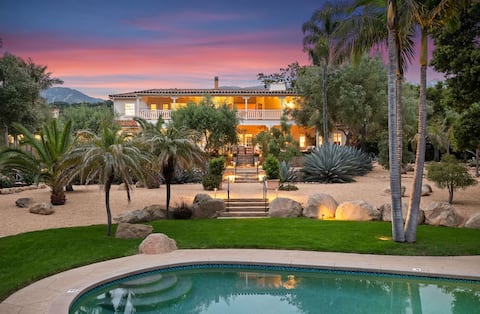
Valhalla 4 Acre Estate, Pool, 1 mi. to beach/shops
Entire Place • 6 bedrooms
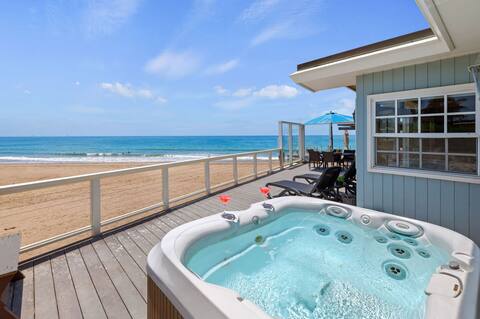
Alluring Oceanfront Home, Jacuzzi
Entire Place • 2 bedrooms
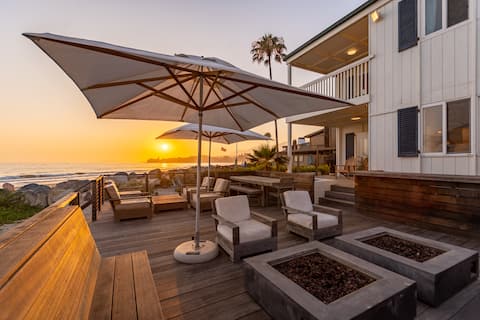
Padaro Retreat Dream Ocean Front Beach House
Entire Place • 4 bedrooms
Coastal Escape
Entire Place • 3 bedrooms

Midcentury modern meets avocados
Entire Place • 2 bedrooms

Hilltop Montecito with Ocean View, Pool & Hot Tub
Entire Place • 4 bedrooms
Note: Performance varies based on location, size, amenities, seasonality, and management quality. Data reflects the past 12 months.
Top Performing Airbnb Hosts in Toro Canyon (2026)
Learn from the best! This table showcases top-performing Airbnb hosts in Toro Canyon based on the number of properties managed and estimated total revenue over the past year. Analyze their scale and performance metrics.
| Host Name | Properties | Grossing Revenue | Stay Reviews | Avg Rating |
|---|---|---|---|---|
| Valhalla Ranch | 1 | $447,854 | 19 | 5.00/5.0 |
| Casago Santa Barbara | 2 | $411,272 | 110 | 4.92/5.0 |
| Alli At Stay SB | 1 | $287,634 | 18 | 4.94/5.0 |
| Tatyana | 1 | $273,085 | 109 | 5.00/5.0 |
| Laurie | 1 | $154,118 | 87 | 4.98/5.0 |
| Paul | 2 | $148,677 | 294 | 4.83/5.0 |
| Christopher | 3 | $144,736 | 546 | 4.93/5.0 |
| Jan | 1 | $104,165 | 196 | 4.93/5.0 |
| Wanderlust Luxury Rentals | 1 | $90,137 | 28 | 4.82/5.0 |
| Jeff | 2 | $90,006 | 204 | 4.96/5.0 |
Analyzing the strategies of top hosts, such as their property selection, pricing, and guest communication, can offer valuable lessons for optimizing your own Airbnb operations in Toro Canyon.
Dive Deeper: Advanced Toro Canyon STR Market Data (2026)
Ready to unlock more insights? AirROI provides access to advanced metrics and comprehensive Airbnb data for Toro Canyon. Explore detailed analytics beyond this report to refine your investment strategy, optimize pricing, and maximize your vacation rental profits.
Explore Advanced MetricsToro Canyon Short-Term Rental Market Composition (2026): Property & Room Types
Room Type Distribution
Property Type Distribution
Market Composition Insights for Toro Canyon
- The Toro Canyon Airbnb market composition is heavily skewed towards Entire Home/Apt listings, which make up 97% of the 33 active rentals. This indicates strong guest preference for privacy and space.
- Looking at the property type distribution in Toro Canyon, House properties are the most common (51.5%), reflecting the local real estate landscape.
- Houses represent a significant 51.5% portion, catering likely to families or larger groups.
- The presence of 9.1% Hotel/Boutique listings indicates integration with traditional hospitality.
Toro Canyon Airbnb Room Capacity Analysis (2026): Bedroom Distribution
Distribution of Listings by Number of Bedrooms
Room Capacity Insights for Toro Canyon
- The dominant room capacity in Toro Canyon is 1 bedroom listings, making up 33.3% of the market. This suggests a strong demand for properties suitable for couples or solo travelers.
- Together, 1 bedroom and 2 bedrooms properties represent 54.5% of the active Airbnb listings in Toro Canyon, indicating a high concentration in these sizes.
- A significant 36.4% of listings offer 3+ bedrooms, catering to larger groups and families seeking more space in Toro Canyon.
Toro Canyon Vacation Rental Guest Capacity Trends (2026)
Distribution of Listings by Guest Capacity
Guest Capacity Insights for Toro Canyon
- The most common guest capacity trend in Toro Canyon vacation rentals is listings accommodating 2 guests (36.4%). This suggests the primary traveler segment is likely couples or solo travelers.
- Properties designed for 2 guests and 8+ guests dominate the Toro Canyon STR market, accounting for 63.7% of listings.
- 42.5% of properties accommodate 6+ guests, serving the market segment for larger families or group travel in Toro Canyon.
- On average, properties in Toro Canyon are equipped to host 4.5 guests.
Toro Canyon Airbnb Booking Patterns (2026): Available vs. Booked Days
Available Days Distribution
Booked Days Distribution
Booking Pattern Insights for Toro Canyon
- The most common availability pattern in Toro Canyon falls within the 271-366 days range, representing 45.5% of listings. This suggests many properties have significant open periods on their calendars.
- Approximately 72.8% of listings show high availability (181+ days open annually), indicating potential for increased bookings or specific owner usage patterns.
- For booked days, the 31-90 days range is most frequent in Toro Canyon (30.3%), reflecting common guest stay durations or potential owner blocking patterns.
- A notable 27.3% of properties secure long booking periods (181+ days booked per year), highlighting successful long-term rental strategies or significant owner usage.
Toro Canyon Airbnb Minimum Stay Requirements Analysis
Distribution of Listings by Minimum Night Requirement
1 Night
4 listings
12.1% of total
2 Nights
11 listings
33.3% of total
3 Nights
2 listings
6.1% of total
4-6 Nights
3 listings
9.1% of total
7-29 Nights
1 listings
3% of total
30+ Nights
12 listings
36.4% of total
Key Insights
- The most prevalent minimum stay requirement in Toro Canyon is 30+ Nights, adopted by 36.4% of listings. This highlights the market's preference for longer commitments.
- A significant segment (36.4%) caters to monthly stays (30+ nights) in Toro Canyon, pointing to opportunities in the extended-stay market.
Recommendations
- Align with the market by considering a 30+ Nights minimum stay, as 36.4% of Toro Canyon hosts use this setting.
- If feasible, allowing 1-night stays, especially midweek or during low season, could capture last-minute bookings, as only 12.1% currently do.
- A 2-night minimum appears standard (33.3%). Consider this for weekends or peak periods.
- Explore offering discounts for stays of 30+ nights to attract the 36.4% of the market seeking extended stays.
- Adjust minimum nights based on seasonality – potentially shorter during low season and longer during peak demand periods in Toro Canyon.
Toro Canyon Airbnb Cancellation Policy Trends Analysis (2026)
Limited
2 listings
6.1% of total
Super Strict 60 Days
1 listings
3% of total
Flexible
6 listings
18.2% of total
Moderate
8 listings
24.2% of total
Firm
9 listings
27.3% of total
Strict
7 listings
21.2% of total
Cancellation Policy Insights for Toro Canyon
- The prevailing Airbnb cancellation policy trend in Toro Canyon is Firm, used by 27.3% of listings.
- There's a relatively balanced mix between guest-friendly (42.4%) and stricter (48.5%) policies, offering choices for different guest needs.
Recommendations for Hosts
- Consider adopting a Firm policy to align with the 27.3% market standard in Toro Canyon.
- Regularly review your cancellation policy against competitors and market demand shifts in Toro Canyon.
Toro Canyon STR Booking Lead Time Analysis (2026)
Average Booking Lead Time by Month
Booking Lead Time Insights for Toro Canyon
- The overall average booking lead time for vacation rentals in Toro Canyon is 54 days.
- Guests book furthest in advance for stays during June (average 84 days), likely coinciding with peak travel demand or local events.
- The shortest booking windows occur for stays in January (average 26 days), indicating more last-minute travel plans during this time.
- Seasonally, Summer (72 days avg.) sees the longest lead times, while Winter (32 days avg.) has the shortest, reflecting typical travel planning cycles.
Recommendations for Hosts
- Use the overall average lead time (54 days) as a baseline for your pricing and availability strategy in Toro Canyon.
- For June stays, consider implementing length-of-stay discounts or slightly higher rates for bookings made less than 84 days out to capitalize on advance planning.
- Target marketing efforts for the Summer season well in advance (at least 72 days) to capture early planners.
- Monitor your own booking lead times against these Toro Canyon averages to identify opportunities for dynamic pricing adjustments.
Popular & Essential Airbnb Amenities in Toro Canyon (2026)
Amenity Prevalence
Amenity Insights for Toro Canyon
- Essential amenities in Toro Canyon that guests expect include: Wifi, TV. Lacking these (any) could significantly impact bookings.
- Popular amenities like Hair dryer, Coffee maker, Dishes and silverware are common but not universal. Offering these can provide a competitive edge.
Recommendations for Hosts
- Ensure your listing includes all essential amenities for Toro Canyon: Wifi, TV.
- Prioritize adding missing essentials: TV.
- Consider adding popular differentiators like Hair dryer or Coffee maker to increase appeal.
- Highlight unique or less common amenities you offer (e.g., hot tub, dedicated workspace, EV charger) in your listing description and photos.
- Regularly check competitor amenities in Toro Canyon to stay competitive.
Toro Canyon Airbnb Guest Demographics & Profile Analysis (2026)
Guest Profile Summary for Toro Canyon
- The typical guest profile for Airbnb in Toro Canyon consists of primarily domestic travelers (93%), often arriving from nearby Los Angeles, typically belonging to the Post-2000s (Gen Z/Alpha) group (50%), primarily speaking English or Spanish.
- Domestic travelers account for 93.4% of guests.
- Key international markets include United States (93.4%) and Canada (1.1%).
- Top languages spoken are English (67.9%) followed by Spanish (17.9%).
- A significant demographic segment is the Post-2000s (Gen Z/Alpha) group, representing 50% of guests.
Recommendations for Hosts
- Target domestic marketing efforts towards travelers from Los Angeles and San Francisco.
- Tailor amenities and listing descriptions to appeal to the dominant Post-2000s (Gen Z/Alpha) demographic (e.g., highlight fast WiFi, smart home features, local guides).
- Highlight unique local experiences or amenities relevant to the primary guest profile.
- Consider seasonal promotions aligned with peak travel times for key origin markets.
Nearby Short-Term Rental Market Comparison
How does the Toro Canyon Airbnb market stack up against its neighbors? Compare key performance metrics like average monthly revenue, ADR, and occupancy rates in surrounding areas to understand the broader regional STR landscape.
| Market | Active Properties | Monthly Revenue | Daily Rate | Avg. Occupancy |
|---|---|---|---|---|
| Montecito | 127 | $10,744 | $950.35 | 51% |
| Malibu | 251 | $8,293 | $1263.89 | 35% |
| Manhattan Beach | 267 | $7,875 | $585.30 | 53% |
| Los Olivos | 30 | $7,240 | $705.20 | 43% |
| Santa Ynez | 119 | $6,967 | $589.34 | 42% |
| Avila Beach | 94 | $6,770 | $582.34 | 41% |
| Avalon | 249 | $6,705 | $696.60 | 38% |
| Summerland | 88 | $6,323 | $494.72 | 49% |
| Unincorporated Santa Monica Mountains | 119 | $6,008 | $699.60 | 38% |
| La Palma | 17 | $5,915 | $448.59 | 44% |