Warner Springs Airbnb Market Analysis 2026: Short Term Rental Data & Vacation Rental Statistics in California, United States
Is Airbnb profitable in Warner Springs in 2026? Explore comprehensive Airbnb analytics for Warner Springs, California, United States to uncover income potential. This 2026 STR market report for Warner Springs, based on AirROI data from February 2025 to January 2026, reveals key trends in the niche market of 19 active listings.
Whether you're considering an Airbnb investment in Warner Springs, optimizing your existing vacation rental, or exploring rental arbitrage opportunities, understanding the Warner Springs Airbnb data is crucial. Leveraging the low regulation environment is key to maximizing your short term rental income potential. Let's dive into the specifics.
Key Warner Springs Airbnb Performance Metrics Overview
Monthly Airbnb Revenue Variations & Income Potential in Warner Springs (2026)
Understanding the monthly revenue variations for Airbnb listings in Warner Springs is key to maximizing your short term rental income potential. Seasonality significantly impacts earnings. Our analysis, based on data from the past 12 months, shows that the peak revenue month for STRs in Warner Springs is typically December, while September often presents the lowest earnings, highlighting opportunities for strategic pricing adjustments during shoulder and low seasons. Explore the typical Airbnb income in Warner Springs across different performance tiers:
- Best-in-class properties (Top 10%) achieve $2,854+ monthly, often utilizing dynamic pricing and superior guest experiences.
- Strong performing properties (Top 25%) earn $1,950 or more, indicating effective management and desirable locations/amenities.
- Typical properties (Median) generate around $876 per month, representing the average market performance.
- Entry-level properties (Bottom 25%) see earnings around $485, often with potential for optimization.
Average Monthly Airbnb Earnings Trend in Warner Springs
Warner Springs Airbnb Occupancy Rate Trends (2026)
Maximize your bookings by understanding the Warner Springs STR occupancy trends. Seasonal demand shifts significantly influence how often properties are booked. Typically, Marchsees the highest demand (peak season occupancy), while September experiences the lowest (low season). Effective strategies, like adjusting minimum stays or offering promotions, can boost occupancy during slower periods. Here's how different property tiers perform in Warner Springs:
- Best-in-class properties (Top 10%) achieve 55%+ occupancy, indicating high desirability and potentially optimized availability.
- Strong performing properties (Top 25%) maintain 39% or higher occupancy, suggesting good market fit and guest satisfaction.
- Typical properties (Median) have an occupancy rate around 22%.
- Entry-level properties (Bottom 25%) average 12% occupancy, potentially facing higher vacancy.
Average Monthly Occupancy Rate Trend in Warner Springs
Average Daily Rate (ADR) Airbnb Trends in Warner Springs (2026)
Effective short term rental pricing strategy in Warner Springs involves understanding monthly ADR fluctuations. The Average Daily Rate (ADR) for Airbnb in Warner Springs typically peaks in October and dips lowest during February. Leveraging Airbnb dynamic pricing tools or strategies based on this seasonality can significantly boost revenue. Here's a look at the typical nightly rates achieved:
- Best-in-class properties (Top 10%) command rates of $241+ per night, often due to premium features or locations.
- Strong performing properties (Top 25%) achieve nightly rates of $161 or more.
- Typical properties (Median) charge around $127 per night.
- Entry-level properties (Bottom 25%) earn around $87 per night.
Average Daily Rate (ADR) Trend by Month in Warner Springs
Get Live Warner Springs Market Intelligence 👇

Explore Real-time Analytics
Airbnb Seasonality Analysis & Trends in Warner Springs (2026)
Peak Season (December, March, January)
- Revenue averages $1,827 per month
- Occupancy rates average 35.8%
- Daily rates average $164
Shoulder Season
- Revenue averages $1,305 per month
- Occupancy maintains around 27.9%
- Daily rates hold near $161
Low Season (July, August, September)
- Revenue drops to average $698 per month
- Occupancy decreases to average 18.9%
- Daily rates adjust to average $157
Seasonality Insights for Warner Springs
- The Airbnb seasonality in Warner Springs shows highly seasonal trends requiring careful strategy. While the sections above show seasonal averages, it's also insightful to look at the extremes:
- During the high season, the absolute peak month showcases Warner Springs's highest earning potential, with monthly revenues capable of climbing to $1,994, occupancy reaching a high of 36.9%, and ADRs peaking at $179.
- Conversely, the slowest single month of the year, typically falling within the low season, marks the market's lowest point. In this month, revenue might dip to $539, occupancy could drop to 14.6%, and ADRs may adjust down to $143.
- Understanding both the seasonal averages and these monthly peaks and troughs in revenue, occupancy, and ADR is crucial for maximizing your Airbnb profit potential in Warner Springs.
Seasonal Strategies for Maximizing Profit
- Peak Season: Maximize revenue through premium pricing and potentially longer minimum stays. Ensure high availability.
- Low Season: Offer competitive pricing, special promotions (e.g., extended stay discounts), and flexible cancellation policies. Target off-season travelers like remote workers or budget-conscious guests.
- Shoulder Seasons: Implement dynamic pricing that balances peak and low rates. Target weekend travelers or specific events. Offer slightly more flexible terms than peak season.
- Regularly analyze your own performance against these Warner Springs seasonality benchmarks and adjust your pricing and availability strategy accordingly.
Best Areas for Airbnb Investment in Warner Springs (2026)
Exploring the top neighborhoods for short-term rentals in Warner Springs? This section highlights key areas, outlining why they are attractive for hosts and guests, along with notable local attractions. Consider these locations based on your target guest profile and investment strategy.
| Neighborhood / Area | Why Host Here? (Target Guests & Appeal) | Key Attractions & Landmarks |
|---|---|---|
| Warner Springs Ranch | A historic resort and spa located in the beautiful hillside of Warner Springs, offering a relaxing getaway with access to natural beauty and outdoor activities. | Warner Springs Ranch, Eagle Rock, Cuyamaca Rancho State Park, Palomar Mountain State Park, Hot Springs, Hiking and horseback riding opportunities |
| Anza Borrego Desert State Park | The largest state park in California, offering stunning desert landscapes and unique geological formations, perfect for nature lovers and outdoor enthusiasts. | Font's Point, Borrego Palm Canyon, Anza-Borrego Desert Flora, Wildflower Blooms in Spring, Galleta Meadows Sculptures |
| Julian | A charming historic gold mining town nearby known for its apple pies and quaint shops, attracting visitors looking for a unique blend of history and nature. | Julian Pioneer Museum, Apple Orchard Tours, Volcan Mountain Wilderness Preserve, Cuyamaca Rancho State Park, Gold Mine Tours |
| Lake Henshaw | A serene lake surrounded by mountains and nature, perfect for fishing, hiking, and enjoying the peaceful outdoor environment. | Lake Henshaw, Hiking trails, Bird watching, Fishing, Picnic areas |
| Santa Ysabel | A small community known for its beautiful sceneries and proximity to the San Dieguito River Park, ideal for those seeking solitude and nature. | Santa Ysabel Mission, San Dieguito River Park, Hiking trails, Horseback riding |
| California Riding and Hiking Trail | A scenic trail that spans through various terrains of the Anza Borrego Desert and surrounding areas, perfect for adventurers and outdoor lovers. | California Riding and Hiking Trail, Hiking and biking opportunities, Stargazing |
| Warner Springs Wine Country | A lesser-known but emerging wine region in the hills, attracting wine enthusiasts looking for tastings and scenic vineyard views. | Local Wineries, Wine Tours, Vineyard views, Wine tastings events |
| Cuyamaca Mountains | Part of the larger Cuyamaca Rancho State Park, offering beautiful mountain vistas, hiking trails, and opportunities for wildlife observation. | Cuyamaca Peak, Paso Picacho Campground, Hiking trails, Wildlife watching, Biking trails |
Understanding Airbnb License Requirements & STR Laws in Warner Springs (2026)
While Warner Springs, California, United States currently shows low STR regulations, specific Airbnb license requirements might still exist or change. Always verify the latest short term rental regulations and Airbnb license requirements directly with local government authorities for Warner Springs to ensure full compliance before hosting.
(Source: AirROI data, 2026, finding no licensed listings among those analyzed)
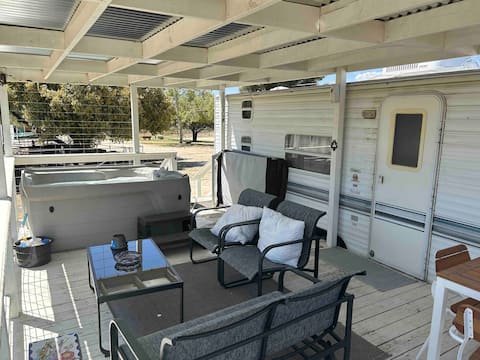
Top Performing Airbnb Properties in Warner Springs (2026)
Benchmark your potential! Explore examples of top-performing Airbnb properties in Warner Springsbased on Trailing Twelve Month (TTM) revenue. Analyze their characteristics, revenue, occupancy rate, and ADR to understand what drives success in this market.

Bluebird Tiny House Forest Retreat
Entire Place • 1 bedroom

Pinky's Nature Hideout and Retreat Hub
Entire Place • 1 bedroom

DESERT ROSE RANCH Mountain retreat - 360 ° views!
Entire Place • 2 bedrooms

Serendipity Ranch a delightful discoverer
Entire Place • 1 bedroom
Lazy Y Guest Ranch Jacuzzi, stars, peace and quiet
Entire Place • 1 bedroom

Barn Studio Under the Stars
Entire Place • 1 bedroom
Note: Performance varies based on location, size, amenities, seasonality, and management quality. Data reflects the past 12 months.
Top Performing Airbnb Hosts in Warner Springs (2026)
Learn from the best! This table showcases top-performing Airbnb hosts in Warner Springs based on the number of properties managed and estimated total revenue over the past year. Analyze their scale and performance metrics.
| Host Name | Properties | Grossing Revenue | Stay Reviews | Avg Rating |
|---|---|---|---|---|
| Laurie | 6 | $78,547 | 330 | 4.91/5.0 |
| Kimberley Kay | 3 | $24,255 | 954 | 4.81/5.0 |
| Ann Marie | 1 | $20,730 | 167 | 4.94/5.0 |
| Karen | 2 | $20,450 | 446 | 4.92/5.0 |
| Aaron | 1 | $8,885 | 11 | 4.82/5.0 |
| Dee | 1 | $7,323 | 8 | 5.00/5.0 |
| Stephen | 1 | $7,250 | 73 | 4.92/5.0 |
| Roger And Judith | 1 | $6,121 | 6 | 5.00/5.0 |
| Kamisha | 1 | $2,985 | 2 | Not Rated |
| Roberta | 1 | $1,116 | 1 | Not Rated |
Analyzing the strategies of top hosts, such as their property selection, pricing, and guest communication, can offer valuable lessons for optimizing your own Airbnb operations in Warner Springs.
Dive Deeper: Advanced Warner Springs STR Market Data (2026)
Ready to unlock more insights? AirROI provides access to advanced metrics and comprehensive Airbnb data for Warner Springs. Explore detailed analytics beyond this report to refine your investment strategy, optimize pricing, and maximize your vacation rental profits.
Explore Advanced MetricsWarner Springs Short-Term Rental Market Composition (2026): Property & Room Types
Room Type Distribution
Property Type Distribution
Market Composition Insights for Warner Springs
- The Warner Springs Airbnb market composition is heavily skewed towards Entire Home/Apt listings, which make up 100% of the 19 active rentals. This indicates strong guest preference for privacy and space.
- Looking at the property type distribution in Warner Springs, Outdoor/Unique properties are the most common (57.9%), reflecting the local real estate landscape.
- Houses represent a significant 26.3% portion, catering likely to families or larger groups.
- The presence of 5.3% Hotel/Boutique listings indicates integration with traditional hospitality.
Warner Springs Airbnb Room Capacity Analysis (2026): Bedroom Distribution
Distribution of Listings by Number of Bedrooms
Room Capacity Insights for Warner Springs
- The dominant room capacity in Warner Springs is 1 bedroom listings, making up 84.2% of the market. This suggests a strong demand for properties suitable for couples or solo travelers.
- Together, 1 bedroom and 2 bedrooms properties represent 89.5% of the active Airbnb listings in Warner Springs, indicating a high concentration in these sizes.
- With over half the market (84.2%) consisting of studios or 1-bedroom units, Warner Springs is particularly well-suited for individuals or couples.
Warner Springs Vacation Rental Guest Capacity Trends (2026)
Distribution of Listings by Guest Capacity
Guest Capacity Insights for Warner Springs
- The most common guest capacity trend in Warner Springs vacation rentals is listings accommodating 4 guests (31.6%). This suggests the primary traveler segment is likely small families or groups.
- Properties designed for 4 guests and 3 guests dominate the Warner Springs STR market, accounting for 57.9% of listings.
- 10.6% of properties accommodate 6+ guests, serving the market segment for larger families or group travel in Warner Springs.
- On average, properties in Warner Springs are equipped to host 3.9 guests.
Warner Springs Airbnb Booking Patterns (2026): Available vs. Booked Days
Available Days Distribution
Booked Days Distribution
Booking Pattern Insights for Warner Springs
- The most common availability pattern in Warner Springs falls within the 271-366 days range, representing 68.4% of listings. This suggests many properties have significant open periods on their calendars.
- Approximately 100.0% of listings show high availability (181+ days open annually), indicating potential for increased bookings or specific owner usage patterns.
- For booked days, the 1-30 days range is most frequent in Warner Springs (36.8%), reflecting common guest stay durations or potential owner blocking patterns.
Warner Springs Airbnb Minimum Stay Requirements Analysis
Distribution of Listings by Minimum Night Requirement
1 Night
9 listings
47.4% of total
2 Nights
8 listings
42.1% of total
3 Nights
1 listings
5.3% of total
30+ Nights
1 listings
5.3% of total
Key Insights
- The most prevalent minimum stay requirement in Warner Springs is 1 Night, adopted by 47.4% of listings. This highlights the market's preference for shorter, flexible bookings.
- A strong majority (89.5%) of the Warner Springs Airbnb data shows acceptance of very short stays (1-2 nights), indicating a dynamic, high-turnover market.
Recommendations
- Align with the market by considering a 1 Night minimum stay, as 47.4% of Warner Springs hosts use this setting.
- Explore offering discounts for stays of 30+ nights to attract the 5.3% of the market seeking extended stays.
- Adjust minimum nights based on seasonality – potentially shorter during low season and longer during peak demand periods in Warner Springs.
Warner Springs Airbnb Cancellation Policy Trends Analysis (2026)
Limited
1 listings
5.3% of total
Flexible
7 listings
36.8% of total
Moderate
9 listings
47.4% of total
Firm
2 listings
10.5% of total
Cancellation Policy Insights for Warner Springs
- The prevailing Airbnb cancellation policy trend in Warner Springs is Moderate, used by 47.4% of listings.
- The market strongly favors guest-friendly terms, with 84.2% of listings offering Flexible or Moderate policies. This suggests guests in Warner Springs may expect booking flexibility.
Recommendations for Hosts
- Consider adopting a Moderate policy to align with the 47.4% market standard in Warner Springs.
- Regularly review your cancellation policy against competitors and market demand shifts in Warner Springs.
Warner Springs STR Booking Lead Time Analysis (2026)
Average Booking Lead Time by Month
Booking Lead Time Insights for Warner Springs
- The overall average booking lead time for vacation rentals in Warner Springs is 16 days.
- Guests book furthest in advance for stays during July (average 28 days), likely coinciding with peak travel demand or local events.
- The shortest booking windows occur for stays in September (average 10 days), indicating more last-minute travel plans during this time.
- Seasonally, Spring (20 days avg.) sees the longest lead times, while Winter (17 days avg.) has the shortest, reflecting typical travel planning cycles.
Recommendations for Hosts
- Use the overall average lead time (16 days) as a baseline for your pricing and availability strategy in Warner Springs.
- For July stays, consider implementing length-of-stay discounts or slightly higher rates for bookings made less than 28 days out to capitalize on advance planning.
- Target marketing efforts for the Spring season well in advance (at least 20 days) to capture early planners.
- Monitor your own booking lead times against these Warner Springs averages to identify opportunities for dynamic pricing adjustments.
Popular & Essential Airbnb Amenities in Warner Springs (2026)
Amenity Prevalence
Amenity Insights for Warner Springs
- Essential amenities in Warner Springs that guests expect include: Free parking on premises, Hot water, Cooking basics, Heating. Lacking these (any) could significantly impact bookings.
- Popular amenities like Dishes and silverware, Kitchen, Coffee maker are common but not universal. Offering these can provide a competitive edge.
Recommendations for Hosts
- Ensure your listing includes all essential amenities for Warner Springs: Free parking on premises, Hot water, Cooking basics, Heating.
- Consider adding popular differentiators like Dishes and silverware or Kitchen to increase appeal.
- Highlight unique or less common amenities you offer (e.g., hot tub, dedicated workspace, EV charger) in your listing description and photos.
- Regularly check competitor amenities in Warner Springs to stay competitive.
Warner Springs Airbnb Guest Demographics & Profile Analysis (2026)
Guest Profile Summary for Warner Springs
- The typical guest profile for Airbnb in Warner Springs consists of primarily domestic travelers (96%), often arriving from nearby San Diego, typically belonging to the Post-2000s (Gen Z/Alpha) group (50%), primarily speaking English or Spanish.
- Domestic travelers account for 95.8% of guests.
- Key international markets include United States (95.8%) and United Kingdom (1.8%).
- Top languages spoken are English (62.1%) followed by Spanish (24.2%).
- A significant demographic segment is the Post-2000s (Gen Z/Alpha) group, representing 50% of guests.
Recommendations for Hosts
- Target domestic marketing efforts towards travelers from San Diego and Los Angeles.
- Tailor amenities and listing descriptions to appeal to the dominant Post-2000s (Gen Z/Alpha) demographic (e.g., highlight fast WiFi, smart home features, local guides).
- Highlight unique local experiences or amenities relevant to the primary guest profile.
- Consider seasonal promotions aligned with peak travel times for key origin markets.
Nearby Short-Term Rental Market Comparison
How does the Warner Springs Airbnb market stack up against its neighbors? Compare key performance metrics like average monthly revenue, ADR, and occupancy rates in surrounding areas to understand the broader regional STR landscape.
| Market | Active Properties | Monthly Revenue | Daily Rate | Avg. Occupancy |
|---|---|---|---|---|
| Newport Beach | 1,273 | $8,950 | $744.06 | 47% |
| Rancho San Diego | 25 | $8,649 | $568.72 | 48% |
| Thousand Palms | 33 | $8,119 | $725.48 | 36% |
| Lakeside | 33 | $7,537 | $604.33 | 44% |
| GlenOak Hills | 41 | $7,394 | $648.65 | 41% |
| Bermuda Dunes | 143 | $7,324 | $664.90 | 39% |
| Mount Helix | 33 | $7,163 | $594.94 | 50% |
| Del Mar | 128 | $7,011 | $671.56 | 45% |
| Rancho Santa Fe | 34 | $6,074 | $913.16 | 35% |
| Encinitas | 559 | $5,940 | $543.93 | 49% |