Watsonville Airbnb Market Analysis 2026: Short Term Rental Data & Vacation Rental Statistics in California, United States
Is Airbnb profitable in Watsonville in 2026? Explore comprehensive Airbnb analytics for Watsonville, California, United States to uncover income potential. This 2026 STR market report for Watsonville, based on AirROI data from February 2025 to January 2026, reveals key trends in the niche market of 42 active listings.
Whether you're considering an Airbnb investment in Watsonville, optimizing your existing vacation rental, or exploring rental arbitrage opportunities, understanding the Watsonville Airbnb data is crucial. Leveraging the low regulation environment is key to maximizing your short term rental income potential. Let's dive into the specifics.
Key Watsonville Airbnb Performance Metrics Overview
Monthly Airbnb Revenue Variations & Income Potential in Watsonville (2026)
Understanding the monthly revenue variations for Airbnb listings in Watsonville is key to maximizing your short term rental income potential. Seasonality significantly impacts earnings. Our analysis, based on data from the past 12 months, shows that the peak revenue month for STRs in Watsonville is typically July, while January often presents the lowest earnings, highlighting opportunities for strategic pricing adjustments during shoulder and low seasons. Explore the typical Airbnb income in Watsonville across different performance tiers:
- Best-in-class properties (Top 10%) achieve $12,295+ monthly, often utilizing dynamic pricing and superior guest experiences.
- Strong performing properties (Top 25%) earn $7,952 or more, indicating effective management and desirable locations/amenities.
- Typical properties (Median) generate around $4,560 per month, representing the average market performance.
- Entry-level properties (Bottom 25%) see earnings around $2,402, often with potential for optimization.
Average Monthly Airbnb Earnings Trend in Watsonville
Watsonville Airbnb Occupancy Rate Trends (2026)
Maximize your bookings by understanding the Watsonville STR occupancy trends. Seasonal demand shifts significantly influence how often properties are booked. Typically, Julysees the highest demand (peak season occupancy), while January experiences the lowest (low season). Effective strategies, like adjusting minimum stays or offering promotions, can boost occupancy during slower periods. Here's how different property tiers perform in Watsonville:
- Best-in-class properties (Top 10%) achieve 75%+ occupancy, indicating high desirability and potentially optimized availability.
- Strong performing properties (Top 25%) maintain 59% or higher occupancy, suggesting good market fit and guest satisfaction.
- Typical properties (Median) have an occupancy rate around 41%.
- Entry-level properties (Bottom 25%) average 24% occupancy, potentially facing higher vacancy.
Average Monthly Occupancy Rate Trend in Watsonville
Average Daily Rate (ADR) Airbnb Trends in Watsonville (2026)
Effective short term rental pricing strategy in Watsonville involves understanding monthly ADR fluctuations. The Average Daily Rate (ADR) for Airbnb in Watsonville typically peaks in December and dips lowest during February. Leveraging Airbnb dynamic pricing tools or strategies based on this seasonality can significantly boost revenue. Here's a look at the typical nightly rates achieved:
- Best-in-class properties (Top 10%) command rates of $695+ per night, often due to premium features or locations.
- Strong performing properties (Top 25%) achieve nightly rates of $530 or more.
- Typical properties (Median) charge around $410 per night.
- Entry-level properties (Bottom 25%) earn around $203 per night.
Average Daily Rate (ADR) Trend by Month in Watsonville
Get Live Watsonville Market Intelligence 👇

Explore Real-time Analytics
Airbnb Seasonality Analysis & Trends in Watsonville (2026)
Peak Season (July, June, August)
- Revenue averages $7,379 per month
- Occupancy rates average 52.9%
- Daily rates average $393
Shoulder Season
- Revenue averages $5,741 per month
- Occupancy maintains around 40.5%
- Daily rates hold near $434
Low Season (January, February, September)
- Revenue drops to average $4,268 per month
- Occupancy decreases to average 36.4%
- Daily rates adjust to average $411
Seasonality Insights for Watsonville
- The Airbnb seasonality in Watsonville shows highly seasonal trends requiring careful strategy. While the sections above show seasonal averages, it's also insightful to look at the extremes:
- During the high season, the absolute peak month showcases Watsonville's highest earning potential, with monthly revenues capable of climbing to $8,455, occupancy reaching a high of 60.0%, and ADRs peaking at $486.
- Conversely, the slowest single month of the year, typically falling within the low season, marks the market's lowest point. In this month, revenue might dip to $3,260, occupancy could drop to 27.1%, and ADRs may adjust down to $347.
- Understanding both the seasonal averages and these monthly peaks and troughs in revenue, occupancy, and ADR is crucial for maximizing your Airbnb profit potential in Watsonville.
Seasonal Strategies for Maximizing Profit
- Peak Season: Maximize revenue through premium pricing and potentially longer minimum stays. Ensure high availability.
- Low Season: Offer competitive pricing, special promotions (e.g., extended stay discounts), and flexible cancellation policies. Target off-season travelers like remote workers or budget-conscious guests.
- Shoulder Seasons: Implement dynamic pricing that balances peak and low rates. Target weekend travelers or specific events. Offer slightly more flexible terms than peak season.
- Regularly analyze your own performance against these Watsonville seasonality benchmarks and adjust your pricing and availability strategy accordingly.
Best Areas for Airbnb Investment in Watsonville (2026)
Exploring the top neighborhoods for short-term rentals in Watsonville? This section highlights key areas, outlining why they are attractive for hosts and guests, along with notable local attractions. Consider these locations based on your target guest profile and investment strategy.
| Neighborhood / Area | Why Host Here? (Target Guests & Appeal) | Key Attractions & Landmarks |
|---|---|---|
| Downtown Watsonville | The heart of Watsonville with easy access to shops, restaurants, and local attractions. Ideal for guests wanting to explore the city and experience local events. | Pajaro Valley Historical Association, Salsa Festival, Watsonville Civic Plaza, Local farmers market, City parks |
| Strawberry Fields | Known for its rich agricultural landscape, it's a charming area that attracts those interested in the local farm-to-table culture and outdoor activities. | Strawberry Farms, Farmers Markets, Nearby hiking trails, Picnic areas, Scenic views of fields |
| Pajaro Dunes | A stunning coastal area that offers beautiful beaches and vacation rentals, perfect for guests looking to relax by the ocean. | Pajaro Dunes Beach, Surfing, Kayaking, Nature trails, Wildlife viewing |
| Watsonville Slough | Ideal for eco-tourism with rich biodiversity, bird watching, and outdoor activities. Great for nature lovers looking for peaceful stays. | Watsonville Slough Ecological Reserve, Bird watching, Kayaking, Nature walks, Picnic spots |
| Lake Watsonville | A picturesque area offering fishing, boating, and hiking activities, attracting outdoor enthusiasts and those seeking a getaway. | Lake Watsonville, Boating, Fishing, Hiking trails, Picnic areas |
| Sunset State Beach | A popular beach destination within driving distance, perfect for families and beachgoers. Great for hosting vacation rentals close to the coast. | Sunset State Beach, Camping, Beach volleyball, Fishing, Walking trails |
| Corralitos | A small, picturesque town known for its wineries and scenic beauty, appealing to those seeking a tranquil, rustic experience. | Corralitos Vineyards, Wineries, Nature trails, Local eateries, Community events |
| Freedom | Close to attractions in Santa Cruz but offers a quieter setting. Attracts visitors looking to explore both the coast and inland areas. | Santa Cruz Beach Boardwalk, UCSC Botanical Gardens, Freedom Farmers Market, Local shops, Nature reserves |
Understanding Airbnb License Requirements & STR Laws in Watsonville (2026)
While Watsonville, California, United States currently shows low STR regulations, specific Airbnb license requirements might still exist or change. Always verify the latest short term rental regulations and Airbnb license requirements directly with local government authorities for Watsonville to ensure full compliance before hosting.
(Source: AirROI data, 2026, finding no licensed listings among those analyzed)
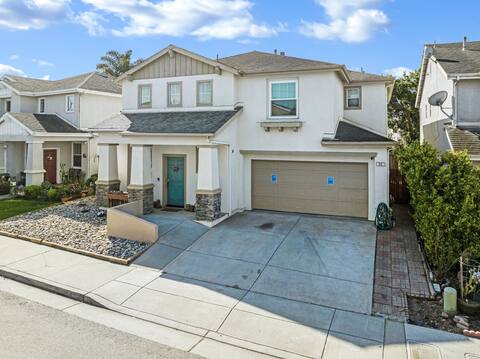
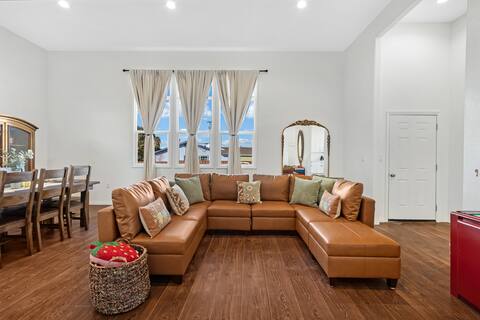
Top Performing Airbnb Properties in Watsonville (2026)
Benchmark your potential! Explore examples of top-performing Airbnb properties in Watsonvillebased on Trailing Twelve Month (TTM) revenue. Analyze their characteristics, revenue, occupancy rate, and ADR to understand what drives success in this market.
Beach home between Santa Cruz & Monterey for 16!
Entire Place • 5 bedrooms

Beach home btwn Santa Cruz & Monterrey for 12!
Entire Place • 4 bedrooms

Pelican 87: Beach Living at its Best
Entire Place • 4 bedrooms
Schoolhouse btwn Santa Cruz & Monterey for 12
Entire Place • 4 bedrooms

Under the Sea 3 BR Custom Townhome 4 Private Decks
Entire Place • 3 bedrooms
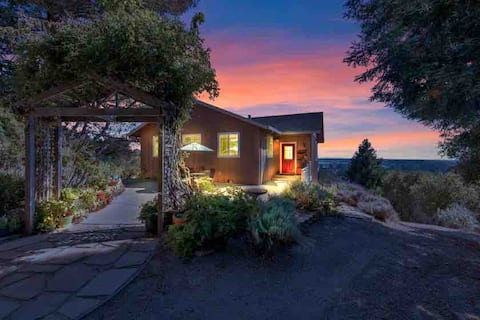
Magical hilltop 3-bedroom with spectacular views
Entire Place • 3 bedrooms
Note: Performance varies based on location, size, amenities, seasonality, and management quality. Data reflects the past 12 months.
Top Performing Airbnb Hosts in Watsonville (2026)
Learn from the best! This table showcases top-performing Airbnb hosts in Watsonville based on the number of properties managed and estimated total revenue over the past year. Analyze their scale and performance metrics.
| Host Name | Properties | Grossing Revenue | Stay Reviews | Avg Rating |
|---|---|---|---|---|
| Job | 7 | $625,652 | 364 | 4.81/5.0 |
| Pajaro Dunes Resort | 10 | $522,028 | 42 | 4.63/5.0 |
| At The Dunes | 4 | $259,764 | 89 | 4.59/5.0 |
| Amy And Brent | 1 | $92,796 | 187 | 4.97/5.0 |
| Christian | 1 | $87,063 | 68 | 4.99/5.0 |
| Michael | 1 | $81,977 | 167 | 4.96/5.0 |
| Evolve | 1 | $79,979 | 107 | 4.73/5.0 |
| Bailey Property Management | 1 | $77,672 | 16 | 4.88/5.0 |
| Nonie | 1 | $73,351 | 727 | 4.95/5.0 |
| Grand Welcome Vacation Rentals | 1 | $53,937 | 31 | 4.68/5.0 |
Analyzing the strategies of top hosts, such as their property selection, pricing, and guest communication, can offer valuable lessons for optimizing your own Airbnb operations in Watsonville.
Dive Deeper: Advanced Watsonville STR Market Data (2026)
Ready to unlock more insights? AirROI provides access to advanced metrics and comprehensive Airbnb data for Watsonville. Explore detailed analytics beyond this report to refine your investment strategy, optimize pricing, and maximize your vacation rental profits.
Explore Advanced MetricsWatsonville Short-Term Rental Market Composition (2026): Property & Room Types
Room Type Distribution
Property Type Distribution
Market Composition Insights for Watsonville
- The Watsonville Airbnb market composition is heavily skewed towards Entire Home/Apt listings, which make up 95.2% of the 42 active rentals. This indicates strong guest preference for privacy and space.
- Looking at the property type distribution in Watsonville, House properties are the most common (50%), reflecting the local real estate landscape.
- Houses represent a significant 50% portion, catering likely to families or larger groups.
- Smaller segments like hotel/boutique, others, unique stays (combined 9.6%) offer potential for unique stay experiences.
Watsonville Airbnb Room Capacity Analysis (2026): Bedroom Distribution
Distribution of Listings by Number of Bedrooms
Room Capacity Insights for Watsonville
- The dominant room capacity in Watsonville is 2 bedrooms listings, making up 38.1% of the market. This suggests a strong demand for properties suitable for couples or solo travelers.
- Together, 2 bedrooms and 3 bedrooms properties represent 64.3% of the active Airbnb listings in Watsonville, indicating a high concentration in these sizes.
- A significant 40.5% of listings offer 3+ bedrooms, catering to larger groups and families seeking more space in Watsonville.
Watsonville Vacation Rental Guest Capacity Trends (2026)
Distribution of Listings by Guest Capacity
Guest Capacity Insights for Watsonville
- The most common guest capacity trend in Watsonville vacation rentals is listings accommodating 8+ guests (28.6%). This suggests the primary traveler segment is likely larger groups.
- Properties designed for 8+ guests and 6 guests dominate the Watsonville STR market, accounting for 52.4% of listings.
- 57.2% of properties accommodate 6+ guests, serving the market segment for larger families or group travel in Watsonville.
- On average, properties in Watsonville are equipped to host 5.5 guests.
Watsonville Airbnb Booking Patterns (2026): Available vs. Booked Days
Available Days Distribution
Booked Days Distribution
Booking Pattern Insights for Watsonville
- The most common availability pattern in Watsonville falls within the 181-270 days range, representing 42.9% of listings. This suggests many properties have significant open periods on their calendars.
- Approximately 85.8% of listings show high availability (181+ days open annually), indicating potential for increased bookings or specific owner usage patterns.
- For booked days, the 91-180 days range is most frequent in Watsonville (42.9%), reflecting common guest stay durations or potential owner blocking patterns.
- A notable 14.3% of properties secure long booking periods (181+ days booked per year), highlighting successful long-term rental strategies or significant owner usage.
Watsonville Airbnb Minimum Stay Requirements Analysis
Distribution of Listings by Minimum Night Requirement
1 Night
10 listings
23.8% of total
2 Nights
20 listings
47.6% of total
3 Nights
1 listings
2.4% of total
7-29 Nights
1 listings
2.4% of total
30+ Nights
10 listings
23.8% of total
Key Insights
- The most prevalent minimum stay requirement in Watsonville is 2 Nights, adopted by 47.6% of listings. This highlights the market's preference for shorter, flexible bookings.
- A strong majority (71.4%) of the Watsonville Airbnb data shows acceptance of very short stays (1-2 nights), indicating a dynamic, high-turnover market.
- A significant segment (23.8%) caters to monthly stays (30+ nights) in Watsonville, pointing to opportunities in the extended-stay market.
Recommendations
- Align with the market by considering a 2 Nights minimum stay, as 47.6% of Watsonville hosts use this setting.
- If feasible, allowing 1-night stays, especially midweek or during low season, could capture last-minute bookings, as only 23.8% currently do.
- Explore offering discounts for stays of 30+ nights to attract the 23.8% of the market seeking extended stays.
- Adjust minimum nights based on seasonality – potentially shorter during low season and longer during peak demand periods in Watsonville.
Watsonville Airbnb Cancellation Policy Trends Analysis (2026)
Super Strict 30 Days
4 listings
9.5% of total
Flexible
4 listings
9.5% of total
Moderate
3 listings
7.1% of total
Firm
18 listings
42.9% of total
Strict
13 listings
31% of total
Cancellation Policy Insights for Watsonville
- The prevailing Airbnb cancellation policy trend in Watsonville is Firm, used by 42.9% of listings.
- A majority (73.9%) of hosts in Watsonville utilize Firm or Strict policies, indicating a market where hosts prioritize booking security.
Recommendations for Hosts
- Consider adopting a Firm policy to align with the 42.9% market standard in Watsonville.
- With 31% using Strict terms, this is a viable option in Watsonville, particularly for high-value properties or during peak demand periods.
- Regularly review your cancellation policy against competitors and market demand shifts in Watsonville.
Watsonville STR Booking Lead Time Analysis (2026)
Average Booking Lead Time by Month
Booking Lead Time Insights for Watsonville
- The overall average booking lead time for vacation rentals in Watsonville is 35 days.
- Guests book furthest in advance for stays during August (average 59 days), likely coinciding with peak travel demand or local events.
- The shortest booking windows occur for stays in March (average 20 days), indicating more last-minute travel plans during this time.
- Seasonally, Summer (47 days avg.) sees the longest lead times, while Winter (25 days avg.) has the shortest, reflecting typical travel planning cycles.
Recommendations for Hosts
- Use the overall average lead time (35 days) as a baseline for your pricing and availability strategy in Watsonville.
- For August stays, consider implementing length-of-stay discounts or slightly higher rates for bookings made less than 59 days out to capitalize on advance planning.
- Target marketing efforts for the Summer season well in advance (at least 47 days) to capture early planners.
- Monitor your own booking lead times against these Watsonville averages to identify opportunities for dynamic pricing adjustments.
Popular & Essential Airbnb Amenities in Watsonville (2026)
Amenity Prevalence
Amenity Insights for Watsonville
- Essential amenities in Watsonville that guests expect include: Smoke alarm, Coffee maker, Kitchen, Carbon monoxide alarm, Heating. Lacking these (any) could significantly impact bookings.
- Popular amenities like Wifi, TV, Hot water are common but not universal. Offering these can provide a competitive edge.
- Warning: Wifi is not universally provided but is considered essential globally. Ensure reliable Wifi is offered.
Recommendations for Hosts
- Ensure your listing includes all essential amenities for Watsonville: Smoke alarm, Coffee maker, Kitchen, Carbon monoxide alarm, Heating.
- Prioritize adding missing essentials: Smoke alarm, Coffee maker, Kitchen, Carbon monoxide alarm, Heating.
- Consider adding popular differentiators like Wifi or TV to increase appeal.
- Highlight unique or less common amenities you offer (e.g., hot tub, dedicated workspace, EV charger) in your listing description and photos.
- Regularly check competitor amenities in Watsonville to stay competitive.
Watsonville Airbnb Guest Demographics & Profile Analysis (2026)
Guest Profile Summary for Watsonville
- The typical guest profile for Airbnb in Watsonville consists of primarily domestic travelers (96%), often arriving from nearby San Francisco, typically belonging to the Post-2000s (Gen Z/Alpha) group (50%), primarily speaking English or Spanish.
- Domestic travelers account for 95.8% of guests.
- Key international markets include United States (95.8%) and Germany (0.9%).
- Top languages spoken are English (63.3%) followed by Spanish (13.8%).
- A significant demographic segment is the Post-2000s (Gen Z/Alpha) group, representing 50% of guests.
Recommendations for Hosts
- Target domestic marketing efforts towards travelers from San Francisco and San Jose.
- Tailor amenities and listing descriptions to appeal to the dominant Post-2000s (Gen Z/Alpha) demographic (e.g., highlight fast WiFi, smart home features, local guides).
- Highlight unique local experiences or amenities relevant to the primary guest profile.
- Consider seasonal promotions aligned with peak travel times for key origin markets.
Nearby Short-Term Rental Market Comparison
How does the Watsonville Airbnb market stack up against its neighbors? Compare key performance metrics like average monthly revenue, ADR, and occupancy rates in surrounding areas to understand the broader regional STR landscape.
| Market | Active Properties | Monthly Revenue | Daily Rate | Avg. Occupancy |
|---|---|---|---|---|
| Carmel Point | 15 | $14,483 | $1046.17 | 54% |
| Del Monte Forest | 105 | $10,280 | $964.89 | 47% |
| Moss Beach | 34 | $10,092 | $676.91 | 53% |
| Carmel-by-the-Sea | 305 | $8,657 | $680.02 | 49% |
| Pleasure Point | 90 | $7,920 | $525.95 | 52% |
| Carmel | 29 | $7,901 | $597.00 | 49% |
| Castroville | 16 | $7,830 | $558.55 | 50% |
| Stinson Beach | 106 | $7,814 | $812.15 | 43% |
| Sand City | 10 | $7,391 | $497.43 | 60% |
| Del Rey Oaks | 33 | $7,281 | $474.67 | 54% |