Wildomar Airbnb Market Analysis 2026: Short Term Rental Data & Vacation Rental Statistics in California, United States
Is Airbnb profitable in Wildomar in 2026? Explore comprehensive Airbnb analytics for Wildomar, California, United States to uncover income potential. This 2026 STR market report for Wildomar, based on AirROI data from February 2025 to January 2026, reveals key trends in the niche market of 38 active listings.
Whether you're considering an Airbnb investment in Wildomar, optimizing your existing vacation rental, or exploring rental arbitrage opportunities, understanding the Wildomar Airbnb data is crucial. Leveraging the low regulation environment is key to maximizing your short term rental income potential. Let's dive into the specifics.
Key Wildomar Airbnb Performance Metrics Overview
Monthly Airbnb Revenue Variations & Income Potential in Wildomar (2026)
Understanding the monthly revenue variations for Airbnb listings in Wildomar is key to maximizing your short term rental income potential. Seasonality significantly impacts earnings. Our analysis, based on data from the past 12 months, shows that the peak revenue month for STRs in Wildomar is typically March, while January often presents the lowest earnings, highlighting opportunities for strategic pricing adjustments during shoulder and low seasons. Explore the typical Airbnb income in Wildomar across different performance tiers:
- Best-in-class properties (Top 10%) achieve $7,306+ monthly, often utilizing dynamic pricing and superior guest experiences.
- Strong performing properties (Top 25%) earn $4,466 or more, indicating effective management and desirable locations/amenities.
- Typical properties (Median) generate around $2,225 per month, representing the average market performance.
- Entry-level properties (Bottom 25%) see earnings around $1,212, often with potential for optimization.
Average Monthly Airbnb Earnings Trend in Wildomar
Wildomar Airbnb Occupancy Rate Trends (2026)
Maximize your bookings by understanding the Wildomar STR occupancy trends. Seasonal demand shifts significantly influence how often properties are booked. Typically, Marchsees the highest demand (peak season occupancy), while January experiences the lowest (low season). Effective strategies, like adjusting minimum stays or offering promotions, can boost occupancy during slower periods. Here's how different property tiers perform in Wildomar:
- Best-in-class properties (Top 10%) achieve 79%+ occupancy, indicating high desirability and potentially optimized availability.
- Strong performing properties (Top 25%) maintain 65% or higher occupancy, suggesting good market fit and guest satisfaction.
- Typical properties (Median) have an occupancy rate around 43%.
- Entry-level properties (Bottom 25%) average 26% occupancy, potentially facing higher vacancy.
Average Monthly Occupancy Rate Trend in Wildomar
Average Daily Rate (ADR) Airbnb Trends in Wildomar (2026)
Effective short term rental pricing strategy in Wildomar involves understanding monthly ADR fluctuations. The Average Daily Rate (ADR) for Airbnb in Wildomar typically peaks in October and dips lowest during February. Leveraging Airbnb dynamic pricing tools or strategies based on this seasonality can significantly boost revenue. Here's a look at the typical nightly rates achieved:
- Best-in-class properties (Top 10%) command rates of $418+ per night, often due to premium features or locations.
- Strong performing properties (Top 25%) achieve nightly rates of $284 or more.
- Typical properties (Median) charge around $139 per night.
- Entry-level properties (Bottom 25%) earn around $76 per night.
Average Daily Rate (ADR) Trend by Month in Wildomar
Get Live Wildomar Market Intelligence 👇

Explore Real-time Analytics
Airbnb Seasonality Analysis & Trends in Wildomar (2026)
Peak Season (March, May, April)
- Revenue averages $3,826 per month
- Occupancy rates average 49.1%
- Daily rates average $217
Shoulder Season
- Revenue averages $3,143 per month
- Occupancy maintains around 46.4%
- Daily rates hold near $222
Low Season (January, September, November)
- Revenue drops to average $2,697 per month
- Occupancy decreases to average 41.0%
- Daily rates adjust to average $229
Seasonality Insights for Wildomar
- The Airbnb seasonality in Wildomar shows moderate seasonality with distinct peak and low periods. While the sections above show seasonal averages, it's also insightful to look at the extremes:
- During the high season, the absolute peak month showcases Wildomar's highest earning potential, with monthly revenues capable of climbing to $3,901, occupancy reaching a high of 54.7%, and ADRs peaking at $237.
- Conversely, the slowest single month of the year, typically falling within the low season, marks the market's lowest point. In this month, revenue might dip to $2,583, occupancy could drop to 32.1%, and ADRs may adjust down to $198.
- Understanding both the seasonal averages and these monthly peaks and troughs in revenue, occupancy, and ADR is crucial for maximizing your Airbnb profit potential in Wildomar.
Seasonal Strategies for Maximizing Profit
- Peak Season: Maximize revenue through premium pricing and potentially longer minimum stays. Ensure high availability.
- Low Season: Offer competitive pricing, special promotions (e.g., extended stay discounts), and flexible cancellation policies. Target off-season travelers like remote workers or budget-conscious guests.
- Shoulder Seasons: Implement dynamic pricing that balances peak and low rates. Target weekend travelers or specific events. Offer slightly more flexible terms than peak season.
- Regularly analyze your own performance against these Wildomar seasonality benchmarks and adjust your pricing and availability strategy accordingly.
Best Areas for Airbnb Investment in Wildomar (2026)
Exploring the top neighborhoods for short-term rentals in Wildomar? This section highlights key areas, outlining why they are attractive for hosts and guests, along with notable local attractions. Consider these locations based on your target guest profile and investment strategy.
| Neighborhood / Area | Why Host Here? (Target Guests & Appeal) | Key Attractions & Landmarks |
|---|---|---|
| Murrieta | Adjunct city known for its family-friendly atmosphere, excellent schools, and nearby attractions. A great choice for families and business travelers alike looking to enjoy a suburban lifestyle with access to larger city amenities. | Murrieta Hot Springs, California Oaks Sports Park, Murrieta Town Square, The Links at Summerly, Historic Old Town Murrieta |
| Temecula | A renowned wine region with beautiful vineyards, great dining, and a lively tourist scene. Perfect for hosting guests looking to explore wine country, enjoy hot air balloon rides, and experience local festivals. | Temecula Valley Wine Country, Old Town Temecula, Pechanga Resort Casino, Hot Air Balloon Rides, Temecula Farmer's Market |
| Lake Elsinore | A popular spot for outdoor enthusiasts with Lake Elsinore offering opportunities for boating, fishing, and hiking. Appeals to vacationers looking for a mix of water activities and natural scenery. | Lake Elsinore, Lake Elsinore Storm Baseball, El Cariso County Park, Canyon Lake, Yankee Point Trail |
| Perris | Increasingly popular for its affordability and accessibility to both urban and outdoor attractions. Ideal for families and individuals seeking budget-friendly stays while enjoying Southern California. | Lake Perris State Recreation Area, Perris Auto Speedway, Perris Valley Historical Museum, The Orange Empire Railway Museum, Skydive Perris |
| San Jacinto | A quieter option with affordable housing and proximity to larger cities, offering a laid-back atmosphere perfect for travelers looking for peace without sacrificing convenience. | San Jacinto Mountains, Diamond Valley Lake, Estudillo Mansion, Ramona Bowl Amphitheatre, Hemacinto Falls |
| Hemet | Known for its historic district and tranquil living, perfect for guests looking for a more peaceful getaway. It features beautiful parks and gardens, making it a serene choice for families. | Hemet Museum, Mary Henley Park, Western Science Center, Diamond Valley Lake, Hemet Valley Mall |
| Wildomar | Located conveniently between Temecula and Lake Elsinore, it is an emerging destination for families and tourists wanting access to both city and nature, with newer developments and amenities. | Marna O'Brien Park, Wildomar Skate Park, Goetz Park, Local wineries like Doffo Winery, Wildomar Trailhead |
| Menifee | A growing community with affordable housing and proximity to shopping and entertainment, appealing to families and those looking for leisure activities, well-suited for longer stays. | Menifee Lakes, Menifee Town Center, The Menifee Marketplace, Menifee Park, Valley-Wide Recreation & Park District |
Understanding Airbnb License Requirements & STR Laws in Wildomar (2026)
While Wildomar, California, United States currently shows low STR regulations, specific Airbnb license requirements might still exist or change. Always verify the latest short term rental regulations and Airbnb license requirements directly with local government authorities for Wildomar to ensure full compliance before hosting.
(Source: AirROI data, 2026, finding no licensed listings among those analyzed)
Top Performing Airbnb Properties in Wildomar (2026)
Benchmark your potential! Explore examples of top-performing Airbnb properties in Wildomarbased on Trailing Twelve Month (TTM) revenue. Analyze their characteristics, revenue, occupancy rate, and ADR to understand what drives success in this market.
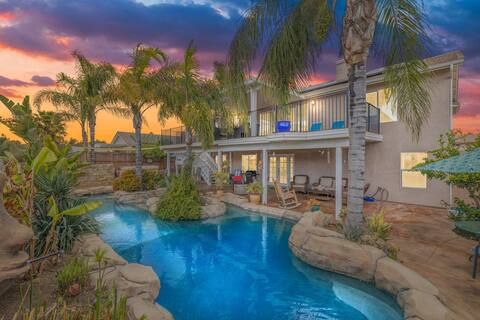
Tiki Paradise Lagoon Pool
Entire Place • 6 bedrooms
Desert Retreat w/ Pool, Spa & EV Charger
Entire Place • 3 bedrooms
Temecula Wineries & Glen Ivy Spa
Entire Place • 3 bedrooms
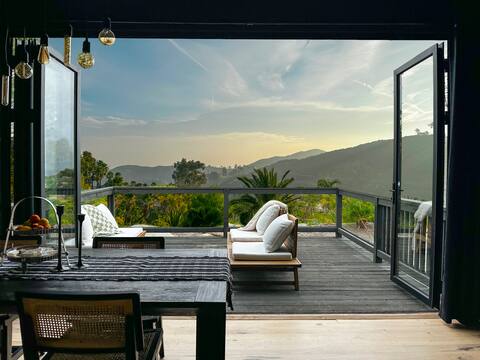
Temecula - A Modern Cabin, BBQ, Fire pit, w/ VIEWS
Entire Place • 1 bedroom
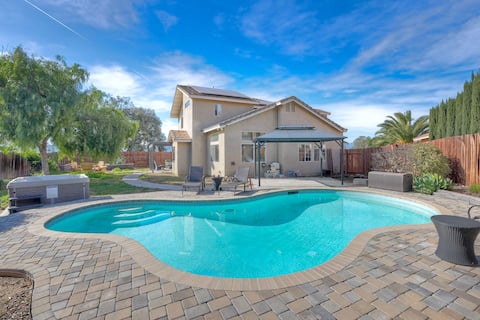
Relaxing Villa In Wildomar Hills w/Billiard Table
Entire Place • 3 bedrooms

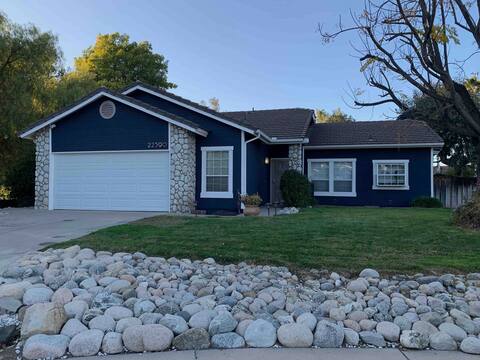
Canyon Ranch Retreat
Entire Place • 3 bedrooms
Note: Performance varies based on location, size, amenities, seasonality, and management quality. Data reflects the past 12 months.
Top Performing Airbnb Hosts in Wildomar (2026)
Learn from the best! This table showcases top-performing Airbnb hosts in Wildomar based on the number of properties managed and estimated total revenue over the past year. Analyze their scale and performance metrics.
| Host Name | Properties | Grossing Revenue | Stay Reviews | Avg Rating |
|---|---|---|---|---|
| Dee | 2 | $92,024 | 65 | 4.99/5.0 |
| Diana | 1 | $87,552 | 38 | 4.79/5.0 |
| Carolyn | 1 | $87,527 | 306 | 4.92/5.0 |
| John | 3 | $83,958 | 1011 | 4.87/5.0 |
| Todd | 1 | $74,196 | 114 | 4.98/5.0 |
| Stephannie | 2 | $63,110 | 80 | 5.00/5.0 |
| Pavlina | 1 | $49,950 | 15 | 5.00/5.0 |
| Tom | 2 | $42,991 | 418 | 4.95/5.0 |
| Ruth | 1 | $35,632 | 16 | 5.00/5.0 |
| Samuel | 1 | $34,060 | 109 | 4.93/5.0 |
Analyzing the strategies of top hosts, such as their property selection, pricing, and guest communication, can offer valuable lessons for optimizing your own Airbnb operations in Wildomar.
Dive Deeper: Advanced Wildomar STR Market Data (2026)
Ready to unlock more insights? AirROI provides access to advanced metrics and comprehensive Airbnb data for Wildomar. Explore detailed analytics beyond this report to refine your investment strategy, optimize pricing, and maximize your vacation rental profits.
Explore Advanced MetricsWildomar Short-Term Rental Market Composition (2026): Property & Room Types
Room Type Distribution
Property Type Distribution
Market Composition Insights for Wildomar
- The Wildomar Airbnb market composition is heavily skewed towards Entire Home/Apt listings, which make up 71.1% of the 38 active rentals. This indicates strong guest preference for privacy and space.
- Looking at the property type distribution in Wildomar, House properties are the most common (68.4%), reflecting the local real estate landscape.
- Houses represent a significant 68.4% portion, catering likely to families or larger groups.
- The presence of 15.8% Hotel/Boutique listings indicates integration with traditional hospitality.
Wildomar Airbnb Room Capacity Analysis (2026): Bedroom Distribution
Distribution of Listings by Number of Bedrooms
Room Capacity Insights for Wildomar
- The dominant room capacity in Wildomar is 1 bedroom listings, making up 21.1% of the market. This suggests a strong demand for properties suitable for couples or solo travelers.
- Together, 1 bedroom and 3 bedrooms properties represent 36.9% of the active Airbnb listings in Wildomar, indicating a high concentration in these sizes.
- A significant 29.0% of listings offer 3+ bedrooms, catering to larger groups and families seeking more space in Wildomar.
Wildomar Vacation Rental Guest Capacity Trends (2026)
Distribution of Listings by Guest Capacity
Guest Capacity Insights for Wildomar
- The most common guest capacity trend in Wildomar vacation rentals is listings accommodating 2 guests (23.7%). This suggests the primary traveler segment is likely couples or solo travelers.
- Properties designed for 2 guests and 8+ guests dominate the Wildomar STR market, accounting for 42.1% of listings.
- 28.9% of properties accommodate 6+ guests, serving the market segment for larger families or group travel in Wildomar.
- On average, properties in Wildomar are equipped to host 3.4 guests.
Wildomar Airbnb Booking Patterns (2026): Available vs. Booked Days
Available Days Distribution
Booked Days Distribution
Booking Pattern Insights for Wildomar
- The most common availability pattern in Wildomar falls within the 271-366 days range, representing 44.7% of listings. This suggests many properties have significant open periods on their calendars.
- Approximately 76.3% of listings show high availability (181+ days open annually), indicating potential for increased bookings or specific owner usage patterns.
- For booked days, the 91-180 days range is most frequent in Wildomar (31.6%), reflecting common guest stay durations or potential owner blocking patterns.
- A notable 23.7% of properties secure long booking periods (181+ days booked per year), highlighting successful long-term rental strategies or significant owner usage.
Wildomar Airbnb Minimum Stay Requirements Analysis
Distribution of Listings by Minimum Night Requirement
1 Night
15 listings
39.5% of total
2 Nights
5 listings
13.2% of total
3 Nights
3 listings
7.9% of total
4-6 Nights
2 listings
5.3% of total
7-29 Nights
4 listings
10.5% of total
30+ Nights
9 listings
23.7% of total
Key Insights
- The most prevalent minimum stay requirement in Wildomar is 1 Night, adopted by 39.5% of listings. This highlights the market's preference for shorter, flexible bookings.
- A significant segment (23.7%) caters to monthly stays (30+ nights) in Wildomar, pointing to opportunities in the extended-stay market.
Recommendations
- Align with the market by considering a 1 Night minimum stay, as 39.5% of Wildomar hosts use this setting.
- Explore offering discounts for stays of 30+ nights to attract the 23.7% of the market seeking extended stays.
- Adjust minimum nights based on seasonality – potentially shorter during low season and longer during peak demand periods in Wildomar.
Wildomar Airbnb Cancellation Policy Trends Analysis (2026)
Flexible
12 listings
31.6% of total
Moderate
13 listings
34.2% of total
Firm
10 listings
26.3% of total
Strict
3 listings
7.9% of total
Cancellation Policy Insights for Wildomar
- The prevailing Airbnb cancellation policy trend in Wildomar is Moderate, used by 34.2% of listings.
- There's a relatively balanced mix between guest-friendly (65.8%) and stricter (34.2%) policies, offering choices for different guest needs.
- Strict cancellation policies are quite rare (7.9%), potentially making listings with this policy less competitive unless justified by high demand or property type.
Recommendations for Hosts
- Consider adopting a Moderate policy to align with the 34.2% market standard in Wildomar.
- Using a Strict policy might deter some guests, as only 7.9% of listings use it. Evaluate if potential revenue protection outweighs possible lower booking rates.
- Regularly review your cancellation policy against competitors and market demand shifts in Wildomar.
Wildomar STR Booking Lead Time Analysis (2026)
Average Booking Lead Time by Month
Booking Lead Time Insights for Wildomar
- The overall average booking lead time for vacation rentals in Wildomar is 27 days.
- Guests book furthest in advance for stays during November (average 48 days), likely coinciding with peak travel demand or local events.
- The shortest booking windows occur for stays in January (average 19 days), indicating more last-minute travel plans during this time.
- Seasonally, Fall (43 days avg.) sees the longest lead times, while Winter (27 days avg.) has the shortest, reflecting typical travel planning cycles.
Recommendations for Hosts
- Use the overall average lead time (27 days) as a baseline for your pricing and availability strategy in Wildomar.
- For November stays, consider implementing length-of-stay discounts or slightly higher rates for bookings made less than 48 days out to capitalize on advance planning.
- Target marketing efforts for the Fall season well in advance (at least 43 days) to capture early planners.
- Monitor your own booking lead times against these Wildomar averages to identify opportunities for dynamic pricing adjustments.
Popular & Essential Airbnb Amenities in Wildomar (2026)
Amenity Prevalence
Amenity Insights for Wildomar
- Essential amenities in Wildomar that guests expect include: Wifi, Smoke alarm, Air conditioning, TV. Lacking these (any) could significantly impact bookings.
- Popular amenities like Carbon monoxide alarm, Free parking on premises, Kitchen are common but not universal. Offering these can provide a competitive edge.
Recommendations for Hosts
- Ensure your listing includes all essential amenities for Wildomar: Wifi, Smoke alarm, Air conditioning, TV.
- Prioritize adding missing essentials: Air conditioning, TV.
- Consider adding popular differentiators like Carbon monoxide alarm or Free parking on premises to increase appeal.
- Highlight unique or less common amenities you offer (e.g., hot tub, dedicated workspace, EV charger) in your listing description and photos.
- Regularly check competitor amenities in Wildomar to stay competitive.
Wildomar Airbnb Guest Demographics & Profile Analysis (2026)
Guest Profile Summary for Wildomar
- The typical guest profile for Airbnb in Wildomar consists of primarily domestic travelers (96%), often arriving from nearby Los Angeles, typically belonging to the Post-2000s (Gen Z/Alpha) group (50%), primarily speaking English or Spanish.
- Domestic travelers account for 96.1% of guests.
- Key international markets include United States (96.1%) and Canada (1.3%).
- Top languages spoken are English (68.9%) followed by Spanish (17.9%).
- A significant demographic segment is the Post-2000s (Gen Z/Alpha) group, representing 50% of guests.
Recommendations for Hosts
- Target domestic marketing efforts towards travelers from Los Angeles and San Diego.
- Tailor amenities and listing descriptions to appeal to the dominant Post-2000s (Gen Z/Alpha) demographic (e.g., highlight fast WiFi, smart home features, local guides).
- Highlight unique local experiences or amenities relevant to the primary guest profile.
- Consider seasonal promotions aligned with peak travel times for key origin markets.
Nearby Short-Term Rental Market Comparison
How does the Wildomar Airbnb market stack up against its neighbors? Compare key performance metrics like average monthly revenue, ADR, and occupancy rates in surrounding areas to understand the broader regional STR landscape.
| Market | Active Properties | Monthly Revenue | Daily Rate | Avg. Occupancy |
|---|---|---|---|---|
| Newport Beach | 1,273 | $8,950 | $744.06 | 47% |
| Rancho San Diego | 25 | $8,649 | $568.72 | 48% |
| Malibu | 251 | $8,293 | $1263.89 | 35% |
| Thousand Palms | 33 | $8,119 | $725.48 | 36% |
| Manhattan Beach | 267 | $7,875 | $585.30 | 53% |
| Lakeside | 33 | $7,537 | $604.33 | 44% |
| GlenOak Hills | 41 | $7,394 | $648.65 | 41% |
| Bermuda Dunes | 143 | $7,324 | $664.90 | 39% |
| Mount Helix | 33 | $7,163 | $594.94 | 50% |
| Del Mar | 128 | $7,011 | $671.56 | 45% |