Winters Airbnb Market Analysis 2026: Short Term Rental Data & Vacation Rental Statistics in California, United States
Is Airbnb profitable in Winters in 2026? Explore comprehensive Airbnb analytics for Winters, California, United States to uncover income potential. This 2026 STR market report for Winters, based on AirROI data from June 2024 to May 2025, reveals key trends in the niche market of 39 active listings.
Whether you're considering an Airbnb investment in Winters, optimizing your existing vacation rental, or exploring rental arbitrage opportunities, understanding the Winters Airbnb data is crucial. Understanding the local regulations is key to maximizing your short term rental income potential. Let's dive into the specifics.
Key Winters Airbnb Performance Metrics Overview
Monthly Airbnb Revenue Variations & Income Potential in Winters (2026)
Understanding the monthly revenue variations for Airbnb listings in Winters is key to maximizing your short term rental income potential. Seasonality significantly impacts earnings. Our analysis, based on data from the past 12 months, shows that the peak revenue month for STRs in Winters is typically May, while March often presents the lowest earnings, highlighting opportunities for strategic pricing adjustments during shoulder and low seasons. Explore the typical Airbnb income in Winters across different performance tiers:
- Best-in-class properties (Top 10%) achieve $7,224+ monthly, often utilizing dynamic pricing and superior guest experiences.
- Strong performing properties (Top 25%) earn $4,552 or more, indicating effective management and desirable locations/amenities.
- Typical properties (Median) generate around $2,255 per month, representing the average market performance.
- Entry-level properties (Bottom 25%) see earnings around $1,124, often with potential for optimization.
Average Monthly Airbnb Earnings Trend in Winters
Winters Airbnb Occupancy Rate Trends (2026)
Maximize your bookings by understanding the Winters STR occupancy trends. Seasonal demand shifts significantly influence how often properties are booked. Typically, Junesees the highest demand (peak season occupancy), while March experiences the lowest (low season). Effective strategies, like adjusting minimum stays or offering promotions, can boost occupancy during slower periods. Here's how different property tiers perform in Winters:
- Best-in-class properties (Top 10%) achieve 36%+ occupancy, indicating high desirability and potentially optimized availability.
- Strong performing properties (Top 25%) maintain 26% or higher occupancy, suggesting good market fit and guest satisfaction.
- Typical properties (Median) have an occupancy rate around 14%.
- Entry-level properties (Bottom 25%) average 8% occupancy, potentially facing higher vacancy.
Average Monthly Occupancy Rate Trend in Winters
Average Daily Rate (ADR) Airbnb Trends in Winters (2026)
Effective short term rental pricing strategy in Winters involves understanding monthly ADR fluctuations. The Average Daily Rate (ADR) for Airbnb in Winters typically peaks in May and dips lowest during December. Leveraging Airbnb dynamic pricing tools or strategies based on this seasonality can significantly boost revenue. Here's a look at the typical nightly rates achieved:
- Best-in-class properties (Top 10%) command rates of $1,225+ per night, often due to premium features or locations.
- Strong performing properties (Top 25%) achieve nightly rates of $674 or more.
- Typical properties (Median) charge around $401 per night.
- Entry-level properties (Bottom 25%) earn around $272 per night.
Average Daily Rate (ADR) Trend by Month in Winters
Get Live Winters Market Intelligence 👇

Explore Real-time Analytics
Airbnb Seasonality Analysis & Trends in Winters (2025)
Peak Season (May, September, October)
- Revenue averages $4,567 per month
- Occupancy rates average 22.1%
- Daily rates average $537
Shoulder Season
- Revenue averages $3,483 per month
- Occupancy maintains around 19.2%
- Daily rates hold near $522
Low Season (February, March, December)
- Revenue drops to average $1,884 per month
- Occupancy decreases to average 12.1%
- Daily rates adjust to average $575
Seasonality Insights for Winters
- The Airbnb seasonality in Winters shows highly seasonal trends requiring careful strategy. While the sections above show seasonal averages, it's also insightful to look at the extremes:
- During the high season, the absolute peak month showcases Winters's highest earning potential, with monthly revenues capable of climbing to $4,619, occupancy reaching a high of 27.9%, and ADRs peaking at $748.
- Conversely, the slowest single month of the year, typically falling within the low season, marks the market's lowest point. In this month, revenue might dip to $1,597, occupancy could drop to 9.3%, and ADRs may adjust down to $412.
- Understanding both the seasonal averages and these monthly peaks and troughs in revenue, occupancy, and ADR is crucial for maximizing your Airbnb profit potential in Winters.
Seasonal Strategies for Maximizing Profit
- Peak Season: Maximize revenue through premium pricing and potentially longer minimum stays. Ensure high availability.
- Low Season: Offer competitive pricing, special promotions (e.g., extended stay discounts), and flexible cancellation policies. Target off-season travelers like remote workers or budget-conscious guests.
- Shoulder Seasons: Implement dynamic pricing that balances peak and low rates. Target weekend travelers or specific events. Offer slightly more flexible terms than peak season.
- Regularly analyze your own performance against these Winters seasonality benchmarks and adjust your pricing and availability strategy accordingly.
Best Areas for Airbnb Investment in Winters (2026)
Exploring the top neighborhoods for short-term rentals in Winters? This section highlights key areas, outlining why they are attractive for hosts and guests, along with notable local attractions. Consider these locations based on your target guest profile and investment strategy.
| Neighborhood / Area | Why Host Here? (Target Guests & Appeal) | Key Attractions & Landmarks |
|---|---|---|
| Downtown Winters | The heart of Winters with charming shops, restaurants, and a vibrant local community. Perfect for visitors looking to explore the historic downtown area and enjoy local cuisine. | Winters Farmers Market, Putah Creek, Local wineries, Winters Theater, Parks and outdoor activities |
| Putah Creek | Known for its beautiful natural scenery, perfect for outdoor enthusiasts. Offers opportunities for fishing, hiking, and enjoying nature while being close to the city. | Putah Creek Park, Hiking trails, Picnic areas, Wildlife viewing, Water activities |
| Historic Winters | Rich in history with well-preserved buildings and a quaint small-town feel. Attracts those seeking a getaway to a less commercialized area with historical charm. | Historic buildings, Local museums, Art galleries, Community events, Photography spots |
| Winters Community Center | A focal point for local events and activities, making it a great spot for families and groups looking to engage in community life during their stay. | Community events, Sports facilities, Family-friendly activities, Local leagues, Event spaces |
| Winters Wineries | Nearby wineries producing high-quality wine, attracting wine enthusiasts and those looking for wine-tasting experiences in a serene setting. | Wine tastings, Vineyard tours, Winery events, Gourmet food pairings, Picnic areas |
| Lake Berryessa | A popular destination for water sports and recreation, attractive for those who enjoy boating, fishing, and camping in a beautiful natural environment. | Boating, Fishing, Camping, Hiking trails, Sightseeing |
| Yolo County Fairgrounds | Located in nearby Woodland, it hosts various events throughout the year, appealing to travelers attending fairs, concerts, and community gatherings. | Yolo County Fair, Concerts, Community events, Food festivals, Exhibitions |
| Cache Creek Casino Resort | A well-known entertainment venue located nearby, attracting visitors looking for gaming and entertainment options outside of Winters. | Gaming, Live entertainment, Dining options, Spa services, Golf course |
Understanding Airbnb License Requirements & STR Laws in Winters (2026)
With 13% of listings showing registration in 2026, understanding potential Airbnb license requirements is crucial in Winters. Always verify the latest short term rental regulations and Airbnb license requirements directly with local government authorities for Winters to ensure full compliance before hosting.
(Source: AirROI data, 2026, based on 13% licensed listings)
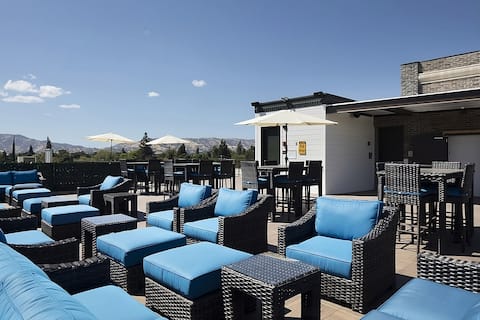
Top Performing Airbnb Properties in Winters (2026)
Benchmark your potential! Explore examples of top-performing Airbnb properties in Wintersbased on Trailing Twelve Month (TTM) revenue. Analyze their characteristics, revenue, occupancy rate, and ADR to understand what drives success in this market.

Superb Location! Four Units, Pet-friendly!
Private Room • 4 bedrooms

Group Getaway! 3 Pet-friendly Units, Free Parking!
Private Room • 3 bedrooms
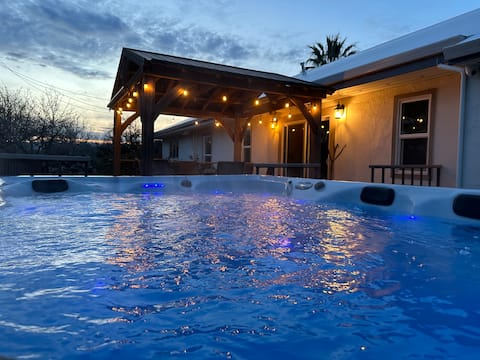
Ranch house w/Pool & Spa
Entire Place • 3 bedrooms

Convenient Stay! Four Modern Units, Pet-friendly!
Private Room • 4 bedrooms

Chic Ranch-Style Home on 33-Acre Walnut Ranch
Entire Place • 3 bedrooms
Perfect Spa Getaway! Zen Terra Spa, Classy 1BR!
Private Room • 1 bedroom
Note: Performance varies based on location, size, amenities, seasonality, and management quality. Data reflects the past 12 months.
Top Performing Airbnb Hosts in Winters (2026)
Learn from the best! This table showcases top-performing Airbnb hosts in Winters based on the number of properties managed and estimated total revenue over the past year. Analyze their scale and performance metrics.
| Host Name | Properties | Grossing Revenue | Stay Reviews | Avg Rating |
|---|---|---|---|---|
| Host #468914943 | 25 | $929,157 | 1 | Not Rated |
| Hotel Winters | 5 | $77,434 | 3 | Not Rated |
| Host #318594350 | 1 | $68,802 | 100 | Not Rated |
| Evolve | 2 | $55,241 | 37 | 4.89/5.0 |
| Meika | 1 | $38,763 | 16 | 5.00/5.0 |
| Patrick | 1 | $32,703 | 35 | 5.00/5.0 |
| Rhonda | 1 | $27,559 | 43 | 5.00/5.0 |
| Sandy | 1 | $15,444 | 48 | 4.96/5.0 |
| Host #489721927 | 2 | $7,723 | 0 | Not Rated |
Analyzing the strategies of top hosts, such as their property selection, pricing, and guest communication, can offer valuable lessons for optimizing your own Airbnb operations in Winters.
Dive Deeper: Advanced Winters STR Market Data (2026)
Ready to unlock more insights? AirROI provides access to advanced metrics and comprehensive Airbnb data for Winters. Explore detailed analytics beyond this report to refine your investment strategy, optimize pricing, and maximize your vacation rental profits.
Explore Advanced MetricsWinters Short-Term Rental Market Composition (2026): Property & Room Types
Room Type Distribution
Property Type Distribution
Market Composition Insights for Winters
- The Winters Airbnb market composition is heavily skewed towards Hotel Room listings, which make up 59% of the 39 active rentals. This indicates strong guest preference for privacy and space.
- Looking at the property type distribution in Winters, Hotel/Boutique properties are the most common (71.8%), reflecting the local real estate landscape.
- Houses represent a significant 15.4% portion, catering likely to families or larger groups.
- The presence of 71.8% Hotel/Boutique listings indicates integration with traditional hospitality.
Winters Airbnb Room Capacity Analysis (2026): Bedroom Distribution
Distribution of Listings by Number of Bedrooms
Room Capacity Insights for Winters
- The dominant room capacity in Winters is 1 bedroom listings, making up 51.3% of the market. This suggests a strong demand for properties suitable for couples or solo travelers.
- Together, 1 bedroom and 3 bedrooms properties represent 71.8% of the active Airbnb listings in Winters, indicating a high concentration in these sizes.
- With over half the market (51.3%) consisting of studios or 1-bedroom units, Winters is particularly well-suited for individuals or couples.
- A significant 30.8% of listings offer 3+ bedrooms, catering to larger groups and families seeking more space in Winters.
Winters Vacation Rental Guest Capacity Trends (2026)
Distribution of Listings by Guest Capacity
Guest Capacity Insights for Winters
- The most common guest capacity trend in Winters vacation rentals is listings accommodating 2 guests (35.9%). This suggests the primary traveler segment is likely couples or solo travelers.
- Properties designed for 2 guests and 4 guests dominate the Winters STR market, accounting for 61.5% of listings.
- 36.0% of properties accommodate 6+ guests, serving the market segment for larger families or group travel in Winters.
- On average, properties in Winters are equipped to host 4.5 guests.
Winters Airbnb Booking Patterns (2026): Available vs. Booked Days
Available Days Distribution
Booked Days Distribution
Booking Pattern Insights for Winters
- The most common availability pattern in Winters falls within the 271-366 days range, representing 92.3% of listings. This suggests many properties have significant open periods on their calendars.
- Approximately 100.0% of listings show high availability (181+ days open annually), indicating potential for increased bookings or specific owner usage patterns.
- For booked days, the 31-90 days range is most frequent in Winters (64.1%), reflecting common guest stay durations or potential owner blocking patterns.
Winters Airbnb Minimum Stay Requirements Analysis
Distribution of Listings by Minimum Night Requirement
1 Night
32 listings
82.1% of total
2 Nights
5 listings
12.8% of total
30+ Nights
2 listings
5.1% of total
Key Insights
- The most prevalent minimum stay requirement in Winters is 1 Night, adopted by 82.1% of listings. This highlights the market's preference for shorter, flexible bookings.
- A strong majority (94.9%) of the Winters Airbnb data shows acceptance of very short stays (1-2 nights), indicating a dynamic, high-turnover market.
Recommendations
- Align with the market by considering a 1 Night minimum stay, as 82.1% of Winters hosts use this setting.
- Explore offering discounts for stays of 30+ nights to attract the 5.1% of the market seeking extended stays.
- Adjust minimum nights based on seasonality – potentially shorter during low season and longer during peak demand periods in Winters.
Winters Airbnb Cancellation Policy Trends Analysis (2026)
Flexible
3 listings
21.4% of total
Moderate
5 listings
35.7% of total
Firm
2 listings
14.3% of total
Strict
4 listings
28.6% of total
Cancellation Policy Insights for Winters
- The prevailing Airbnb cancellation policy trend in Winters is Moderate, used by 35.7% of listings.
- There's a relatively balanced mix between guest-friendly (57.1%) and stricter (42.9%) policies, offering choices for different guest needs.
Recommendations for Hosts
- Consider adopting a Moderate policy to align with the 35.7% market standard in Winters.
- Regularly review your cancellation policy against competitors and market demand shifts in Winters.
Winters STR Booking Lead Time Analysis (2026)
Average Booking Lead Time by Month
Booking Lead Time Insights for Winters
- The overall average booking lead time for vacation rentals in Winters is 34 days.
- Guests book furthest in advance for stays during June (average 140 days), likely coinciding with peak travel demand or local events.
- The shortest booking windows occur for stays in August (average 14 days), indicating more last-minute travel plans during this time.
- Seasonally, Summer (65 days avg.) sees the longest lead times, while Winter (22 days avg.) has the shortest, reflecting typical travel planning cycles.
Recommendations for Hosts
- Use the overall average lead time (34 days) as a baseline for your pricing and availability strategy in Winters.
- For June stays, consider implementing length-of-stay discounts or slightly higher rates for bookings made less than 140 days out to capitalize on advance planning.
- During August, focus on last-minute booking availability and promotions, as guests book with very short notice (14 days avg.).
- Target marketing efforts for the Summer season well in advance (at least 65 days) to capture early planners.
- Monitor your own booking lead times against these Winters averages to identify opportunities for dynamic pricing adjustments.
Popular & Essential Airbnb Amenities in Winters (2026)
Amenity Prevalence
Amenity Insights for Winters
- Essential amenities in Winters that guests expect include: Smoke alarm, Wifi, Heating, Essentials, Free parking on premises, Air conditioning, Washer, TV, Carbon monoxide alarm. Lacking these (any) could significantly impact bookings.
- Popular amenities like Shampoo are common but not universal. Offering these can provide a competitive edge.
Recommendations for Hosts
- Ensure your listing includes all essential amenities for Winters: Smoke alarm, Wifi, Heating, Essentials, Free parking on premises, Air conditioning, Washer, TV, Carbon monoxide alarm.
- Consider adding popular differentiators like Shampoo to increase appeal.
- Highlight unique or less common amenities you offer (e.g., hot tub, dedicated workspace, EV charger) in your listing description and photos.
- Regularly check competitor amenities in Winters to stay competitive.
Winters Airbnb Guest Demographics & Profile Analysis (2026)
Guest Profile Summary for Winters
- The typical guest profile for Airbnb in Winters consists of primarily domestic travelers (96%), often arriving from nearby San Francisco, typically belonging to the Post-2000s (Gen Z/Alpha) group (50%), primarily speaking English or Spanish.
- Domestic travelers account for 96.0% of guests.
- Key international markets include United States (96%) and DC (2%).
- Top languages spoken are English (89.5%) followed by Spanish (10.5%).
- A significant demographic segment is the Post-2000s (Gen Z/Alpha) group, representing 50% of guests.
Recommendations for Hosts
- Target domestic marketing efforts towards travelers from San Francisco and Oakland.
- Tailor amenities and listing descriptions to appeal to the dominant Post-2000s (Gen Z/Alpha) demographic (e.g., highlight fast WiFi, smart home features, local guides).
- Highlight unique local experiences or amenities relevant to the primary guest profile.
- Consider seasonal promotions aligned with peak travel times for key origin markets.
Nearby Short-Term Rental Market Comparison
How does the Winters Airbnb market stack up against its neighbors? Compare key performance metrics like average monthly revenue, ADR, and occupancy rates in surrounding areas to understand the broader regional STR landscape.
| Market | Active Properties | Monthly Revenue | Daily Rate | Avg. Occupancy |
|---|---|---|---|---|
| Sonoma | 232 | $8,732 | $798.29 | 43% |
| Moss Beach | 35 | $8,481 | $628.97 | 52% |
| Marshall | 19 | $7,990 | $563.04 | 51% |
| Kenwood | 56 | $7,977 | $771.60 | 38% |
| Dillon Beach | 80 | $7,874 | $678.79 | 42% |
| Glen Ellen | 81 | $7,702 | $737.91 | 42% |
| Stinson Beach | 95 | $6,886 | $717.10 | 44% |
| Eldridge | 23 | $6,847 | $798.12 | 37% |
| St. Helena | 49 | $6,766 | $769.83 | 38% |
| Muir Beach | 10 | $6,450 | $423.28 | 56% |