Yucaipa Airbnb Market Analysis 2026: Short Term Rental Data & Vacation Rental Statistics in California, United States
Is Airbnb profitable in Yucaipa in 2026? Explore comprehensive Airbnb analytics for Yucaipa, California, United States to uncover income potential. This 2026 STR market report for Yucaipa, based on AirROI data from February 2025 to January 2026, reveals key trends in the niche market of 21 active listings.
Whether you're considering an Airbnb investment in Yucaipa, optimizing your existing vacation rental, or exploring rental arbitrage opportunities, understanding the Yucaipa Airbnb data is crucial. Leveraging the low regulation environment is key to maximizing your short term rental income potential. Let's dive into the specifics.
Key Yucaipa Airbnb Performance Metrics Overview
Monthly Airbnb Revenue Variations & Income Potential in Yucaipa (2026)
Understanding the monthly revenue variations for Airbnb listings in Yucaipa is key to maximizing your short term rental income potential. Seasonality significantly impacts earnings. Our analysis, based on data from the past 12 months, shows that the peak revenue month for STRs in Yucaipa is typically April, while March often presents the lowest earnings, highlighting opportunities for strategic pricing adjustments during shoulder and low seasons. Explore the typical Airbnb income in Yucaipa across different performance tiers:
- Best-in-class properties (Top 10%) achieve $8,001+ monthly, often utilizing dynamic pricing and superior guest experiences.
- Strong performing properties (Top 25%) earn $3,918 or more, indicating effective management and desirable locations/amenities.
- Typical properties (Median) generate around $2,350 per month, representing the average market performance.
- Entry-level properties (Bottom 25%) see earnings around $1,057, often with potential for optimization.
Average Monthly Airbnb Earnings Trend in Yucaipa
Yucaipa Airbnb Occupancy Rate Trends (2026)
Maximize your bookings by understanding the Yucaipa STR occupancy trends. Seasonal demand shifts significantly influence how often properties are booked. Typically, Februarysees the highest demand (peak season occupancy), while December experiences the lowest (low season). Effective strategies, like adjusting minimum stays or offering promotions, can boost occupancy during slower periods. Here's how different property tiers perform in Yucaipa:
- Best-in-class properties (Top 10%) achieve 84%+ occupancy, indicating high desirability and potentially optimized availability.
- Strong performing properties (Top 25%) maintain 68% or higher occupancy, suggesting good market fit and guest satisfaction.
- Typical properties (Median) have an occupancy rate around 45%.
- Entry-level properties (Bottom 25%) average 27% occupancy, potentially facing higher vacancy.
Average Monthly Occupancy Rate Trend in Yucaipa
Average Daily Rate (ADR) Airbnb Trends in Yucaipa (2026)
Effective short term rental pricing strategy in Yucaipa involves understanding monthly ADR fluctuations. The Average Daily Rate (ADR) for Airbnb in Yucaipa typically peaks in June and dips lowest during September. Leveraging Airbnb dynamic pricing tools or strategies based on this seasonality can significantly boost revenue. Here's a look at the typical nightly rates achieved:
- Best-in-class properties (Top 10%) command rates of $642+ per night, often due to premium features or locations.
- Strong performing properties (Top 25%) achieve nightly rates of $277 or more.
- Typical properties (Median) charge around $126 per night.
- Entry-level properties (Bottom 25%) earn around $97 per night.
Average Daily Rate (ADR) Trend by Month in Yucaipa
Get Live Yucaipa Market Intelligence 👇

Explore Real-time Analytics
Airbnb Seasonality Analysis & Trends in Yucaipa (2026)
Peak Season (April, August, May)
- Revenue averages $3,760 per month
- Occupancy rates average 49.6%
- Daily rates average $260
Shoulder Season
- Revenue averages $3,186 per month
- Occupancy maintains around 46.5%
- Daily rates hold near $252
Low Season (February, March, September)
- Revenue drops to average $2,865 per month
- Occupancy decreases to average 47.7%
- Daily rates adjust to average $248
Seasonality Insights for Yucaipa
- The Airbnb seasonality in Yucaipa shows moderate seasonality with distinct peak and low periods. While the sections above show seasonal averages, it's also insightful to look at the extremes:
- During the high season, the absolute peak month showcases Yucaipa's highest earning potential, with monthly revenues capable of climbing to $4,143, occupancy reaching a high of 53.4%, and ADRs peaking at $263.
- Conversely, the slowest single month of the year, typically falling within the low season, marks the market's lowest point. In this month, revenue might dip to $2,844, occupancy could drop to 35.0%, and ADRs may adjust down to $237.
- Understanding both the seasonal averages and these monthly peaks and troughs in revenue, occupancy, and ADR is crucial for maximizing your Airbnb profit potential in Yucaipa.
Seasonal Strategies for Maximizing Profit
- Peak Season: Maximize revenue through premium pricing and potentially longer minimum stays. Ensure high availability.
- Low Season: Offer competitive pricing, special promotions (e.g., extended stay discounts), and flexible cancellation policies. Target off-season travelers like remote workers or budget-conscious guests.
- Shoulder Seasons: Implement dynamic pricing that balances peak and low rates. Target weekend travelers or specific events. Offer slightly more flexible terms than peak season.
- Regularly analyze your own performance against these Yucaipa seasonality benchmarks and adjust your pricing and availability strategy accordingly.
Best Areas for Airbnb Investment in Yucaipa (2026)
Exploring the top neighborhoods for short-term rentals in Yucaipa? This section highlights key areas, outlining why they are attractive for hosts and guests, along with notable local attractions. Consider these locations based on your target guest profile and investment strategy.
| Neighborhood / Area | Why Host Here? (Target Guests & Appeal) | Key Attractions & Landmarks |
|---|---|---|
| California Citrus State Historic Park | A beautiful park showcasing the history of the citrus industry in California. Offers a unique outdoor experience with historical walking trails, perfect for families and tourists. | Historic lemon groves, Visitor center, Walking trails, Picnic areas, Citrus-themed events |
| Yucaipa Community Park | A large community park with a pond, playgrounds, and sports facilities. Attracts local families and visitors looking for outdoor recreational activities. | Playgrounds, Fishing pond, Walking paths, Sports fields, Picnic areas |
| Yucaipa Valley Golf Club | An 18-hole golf course nestled in the picturesque Yucaipa Valley. Popular with golf enthusiasts and offers beautiful views of the surrounding mountains. | Golfing, Clubhouse, Scenic views, Golf lessons, Driving range |
| Wildwood Canyon Park | A natural area with hiking trails and beautiful scenic views of the San Bernardino Mountains, ideal for outdoor enthusiasts. | Hiking trails, Natural scenery, Wildlife viewing, Picnicking spots, Trail maps |
| Oak Glen | Known for its apple orchards and beautiful fall foliage, Oak Glen attracts visitors year-round for its fruit picking and seasonal activities. | Apple picking, Pumpkin patches, Quaint shops, Scenic drives, Family-friendly activities |
| Historic Yucaipa | The charming historic downtown filled with unique shops, dining options, and community events. Great for visitors seeking a local experience. | Local shops, Restaurants, Art galleries, Community events, Historic buildings |
| Crafton Hills College | Home to a diverse student body and various events throughout the year, this college district can attract parents and visitors during events. | Campus events, Cultural activities, Art exhibits, Athletic events, Community classes |
| Yucaipa Performing Arts Center | A venue for concerts, plays, and other performances, drawing in visitors interested in cultural experiences and entertainment. | Live performances, Theater events, Community functions, Workshops, Art presentations |
Understanding Airbnb License Requirements & STR Laws in Yucaipa (2026)
While Yucaipa, California, United States currently shows low STR regulations, specific Airbnb license requirements might still exist or change. Always verify the latest short term rental regulations and Airbnb license requirements directly with local government authorities for Yucaipa to ensure full compliance before hosting.
(Source: AirROI data, 2026, based on 10% licensed listings)
Top Performing Airbnb Properties in Yucaipa (2026)
Benchmark your potential! Explore examples of top-performing Airbnb properties in Yucaipabased on Trailing Twelve Month (TTM) revenue. Analyze their characteristics, revenue, occupancy rate, and ADR to understand what drives success in this market.

Vineyard Retreat, Pool & Amazing Views!
Entire Place • 6 bedrooms
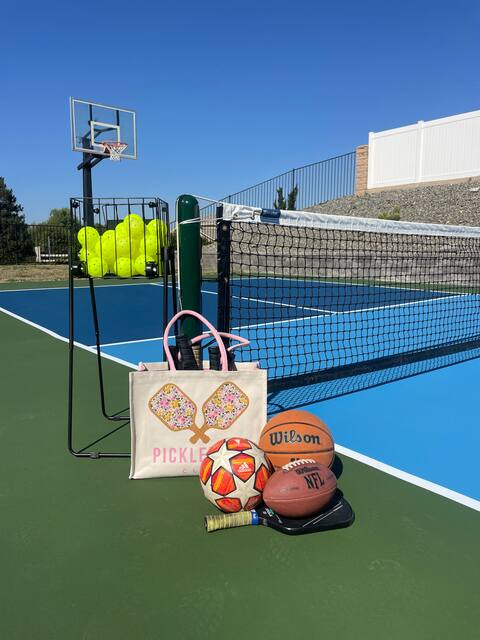
Backyard pickleball with a modern twist!
Entire Place • 3 bedrooms
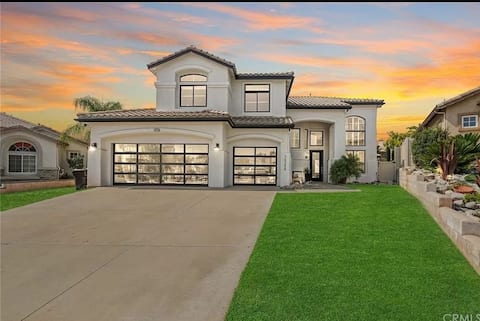
Cheerful 5 Room Home w/ Salt Water Pool & Hot Tub
Entire Place • 5 bedrooms
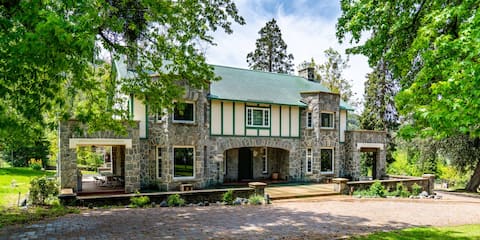
Historic Stone Oak Manor
Entire Place • 5 bedrooms

Authentic Mexican Casita, Pool, Spa, Fire, WIFI
Entire Place • 3 bedrooms

Yucaipa's Cottage on a Hill
Entire Place • 2 bedrooms
Note: Performance varies based on location, size, amenities, seasonality, and management quality. Data reflects the past 12 months.
Top Performing Airbnb Hosts in Yucaipa (2026)
Learn from the best! This table showcases top-performing Airbnb hosts in Yucaipa based on the number of properties managed and estimated total revenue over the past year. Analyze their scale and performance metrics.
| Host Name | Properties | Grossing Revenue | Stay Reviews | Avg Rating |
|---|---|---|---|---|
| Ann | 1 | $129,320 | 108 | 4.89/5.0 |
| Ann-Marie | 1 | $61,845 | 16 | 5.00/5.0 |
| Robert | 1 | $60,553 | 96 | 4.70/5.0 |
| Keir | 1 | $51,098 | 12 | 4.83/5.0 |
| Michael | 1 | $40,744 | 75 | 4.88/5.0 |
| Carol And Victor | 1 | $39,619 | 177 | 4.98/5.0 |
| Donna | 1 | $39,473 | 72 | 5.00/5.0 |
| Rachel | 1 | $34,574 | 143 | 4.96/5.0 |
| Heather | 1 | $25,514 | 78 | 4.96/5.0 |
| Candy | 2 | $22,976 | 410 | 4.90/5.0 |
Analyzing the strategies of top hosts, such as their property selection, pricing, and guest communication, can offer valuable lessons for optimizing your own Airbnb operations in Yucaipa.
Dive Deeper: Advanced Yucaipa STR Market Data (2026)
Ready to unlock more insights? AirROI provides access to advanced metrics and comprehensive Airbnb data for Yucaipa. Explore detailed analytics beyond this report to refine your investment strategy, optimize pricing, and maximize your vacation rental profits.
Explore Advanced MetricsYucaipa Short-Term Rental Market Composition (2026): Property & Room Types
Room Type Distribution
Property Type Distribution
Market Composition Insights for Yucaipa
- The Yucaipa Airbnb market composition is heavily skewed towards Entire Home/Apt listings, which make up 85.7% of the 21 active rentals. This indicates strong guest preference for privacy and space.
- Looking at the property type distribution in Yucaipa, House properties are the most common (57.1%), reflecting the local real estate landscape.
- Houses represent a significant 57.1% portion, catering likely to families or larger groups.
- The presence of 28.6% Hotel/Boutique listings indicates integration with traditional hospitality.
- Smaller segments like others (combined 4.8%) offer potential for unique stay experiences.
Yucaipa Airbnb Room Capacity Analysis (2026): Bedroom Distribution
Distribution of Listings by Number of Bedrooms
Room Capacity Insights for Yucaipa
- The dominant room capacity in Yucaipa is 1 bedroom listings, making up 28.6% of the market. This suggests a strong demand for properties suitable for couples or solo travelers.
- Together, 1 bedroom and 3 bedrooms properties represent 47.6% of the active Airbnb listings in Yucaipa, indicating a high concentration in these sizes.
- A significant 42.8% of listings offer 3+ bedrooms, catering to larger groups and families seeking more space in Yucaipa.
Yucaipa Vacation Rental Guest Capacity Trends (2026)
Distribution of Listings by Guest Capacity
Guest Capacity Insights for Yucaipa
- The most common guest capacity trend in Yucaipa vacation rentals is listings accommodating 8+ guests (33.3%). This suggests the primary traveler segment is likely larger groups.
- Properties designed for 8+ guests and 2 guests dominate the Yucaipa STR market, accounting for 57.1% of listings.
- 52.4% of properties accommodate 6+ guests, serving the market segment for larger families or group travel in Yucaipa.
- On average, properties in Yucaipa are equipped to host 4.7 guests.
Yucaipa Airbnb Booking Patterns (2026): Available vs. Booked Days
Available Days Distribution
Booked Days Distribution
Booking Pattern Insights for Yucaipa
- The most common availability pattern in Yucaipa falls within the 271-366 days range, representing 38.1% of listings. This suggests many properties have significant open periods on their calendars.
- Approximately 66.7% of listings show high availability (181+ days open annually), indicating potential for increased bookings or specific owner usage patterns.
- For booked days, the 181-270 days range is most frequent in Yucaipa (33.3%), reflecting common guest stay durations or potential owner blocking patterns.
- A notable 38.1% of properties secure long booking periods (181+ days booked per year), highlighting successful long-term rental strategies or significant owner usage.
Yucaipa Airbnb Minimum Stay Requirements Analysis
Distribution of Listings by Minimum Night Requirement
1 Night
7 listings
33.3% of total
2 Nights
6 listings
28.6% of total
3 Nights
1 listings
4.8% of total
7-29 Nights
2 listings
9.5% of total
30+ Nights
5 listings
23.8% of total
Key Insights
- The most prevalent minimum stay requirement in Yucaipa is 1 Night, adopted by 33.3% of listings. This highlights the market's preference for shorter, flexible bookings.
- A strong majority (61.9%) of the Yucaipa Airbnb data shows acceptance of very short stays (1-2 nights), indicating a dynamic, high-turnover market.
- A significant segment (23.8%) caters to monthly stays (30+ nights) in Yucaipa, pointing to opportunities in the extended-stay market.
Recommendations
- Align with the market by considering a 1 Night minimum stay, as 33.3% of Yucaipa hosts use this setting.
- Explore offering discounts for stays of 30+ nights to attract the 23.8% of the market seeking extended stays.
- Adjust minimum nights based on seasonality – potentially shorter during low season and longer during peak demand periods in Yucaipa.
Yucaipa Airbnb Cancellation Policy Trends Analysis (2026)
Flexible
7 listings
33.3% of total
Moderate
4 listings
19% of total
Firm
9 listings
42.9% of total
Strict
1 listings
4.8% of total
Cancellation Policy Insights for Yucaipa
- The prevailing Airbnb cancellation policy trend in Yucaipa is Firm, used by 42.9% of listings.
- There's a relatively balanced mix between guest-friendly (52.3%) and stricter (47.7%) policies, offering choices for different guest needs.
- Strict cancellation policies are quite rare (4.8%), potentially making listings with this policy less competitive unless justified by high demand or property type.
Recommendations for Hosts
- Consider adopting a Firm policy to align with the 42.9% market standard in Yucaipa.
- Using a Strict policy might deter some guests, as only 4.8% of listings use it. Evaluate if potential revenue protection outweighs possible lower booking rates.
- Regularly review your cancellation policy against competitors and market demand shifts in Yucaipa.
Yucaipa STR Booking Lead Time Analysis (2026)
Average Booking Lead Time by Month
Booking Lead Time Insights for Yucaipa
- The overall average booking lead time for vacation rentals in Yucaipa is 38 days.
- Guests book furthest in advance for stays during April (average 60 days), likely coinciding with peak travel demand or local events.
- The shortest booking windows occur for stays in February (average 16 days), indicating more last-minute travel plans during this time.
- Seasonally, Fall (50 days avg.) sees the longest lead times, while Winter (26 days avg.) has the shortest, reflecting typical travel planning cycles.
Recommendations for Hosts
- Use the overall average lead time (38 days) as a baseline for your pricing and availability strategy in Yucaipa.
- For April stays, consider implementing length-of-stay discounts or slightly higher rates for bookings made less than 60 days out to capitalize on advance planning.
- Target marketing efforts for the Fall season well in advance (at least 50 days) to capture early planners.
- Monitor your own booking lead times against these Yucaipa averages to identify opportunities for dynamic pricing adjustments.
Popular & Essential Airbnb Amenities in Yucaipa (2026)
Amenity Prevalence
Amenity Insights for Yucaipa
- Essential amenities in Yucaipa that guests expect include: Smoke alarm, Wifi, Refrigerator, Heating, Hot water, Essentials, Air conditioning, Bed linens, Dishes and silverware, Microwave. Lacking these (any) could significantly impact bookings.
Recommendations for Hosts
- Ensure your listing includes all essential amenities for Yucaipa: Smoke alarm, Wifi, Refrigerator, Heating, Hot water, Essentials, Air conditioning, Bed linens, Dishes and silverware, Microwave.
- Prioritize adding missing essentials: Air conditioning, Bed linens, Dishes and silverware, Microwave.
- Highlight unique or less common amenities you offer (e.g., hot tub, dedicated workspace, EV charger) in your listing description and photos.
- Regularly check competitor amenities in Yucaipa to stay competitive.
Yucaipa Airbnb Guest Demographics & Profile Analysis (2026)
Guest Profile Summary for Yucaipa
- The typical guest profile for Airbnb in Yucaipa consists of primarily domestic travelers (97%), often arriving from nearby Los Angeles, typically belonging to the Post-2000s (Gen Z/Alpha) group (50%), primarily speaking English or Spanish.
- Domestic travelers account for 96.7% of guests.
- Key international markets include United States (96.7%) and Germany (1.3%).
- Top languages spoken are English (72.5%) followed by Spanish (14.3%).
- A significant demographic segment is the Post-2000s (Gen Z/Alpha) group, representing 50% of guests.
Recommendations for Hosts
- Target domestic marketing efforts towards travelers from Los Angeles and San Diego.
- Tailor amenities and listing descriptions to appeal to the dominant Post-2000s (Gen Z/Alpha) demographic (e.g., highlight fast WiFi, smart home features, local guides).
- Highlight unique local experiences or amenities relevant to the primary guest profile.
- Consider seasonal promotions aligned with peak travel times for key origin markets.
Nearby Short-Term Rental Market Comparison
How does the Yucaipa Airbnb market stack up against its neighbors? Compare key performance metrics like average monthly revenue, ADR, and occupancy rates in surrounding areas to understand the broader regional STR landscape.
| Market | Active Properties | Monthly Revenue | Daily Rate | Avg. Occupancy |
|---|---|---|---|---|
| Newport Beach | 1,273 | $8,950 | $744.06 | 47% |
| Malibu | 251 | $8,293 | $1263.89 | 35% |
| Thousand Palms | 33 | $8,119 | $725.48 | 36% |
| Manhattan Beach | 267 | $7,875 | $585.30 | 53% |
| GlenOak Hills | 41 | $7,394 | $648.65 | 41% |
| Bermuda Dunes | 143 | $7,324 | $664.90 | 39% |
| Avalon | 249 | $6,705 | $696.60 | 38% |
| Rancho Santa Fe | 34 | $6,074 | $913.16 | 35% |
| Unincorporated Santa Monica Mountains | 119 | $6,008 | $699.60 | 38% |
| Encinitas | 559 | $5,940 | $543.93 | 49% |