Breckenridge, Colorado Airbnb Market Data 2026: STR Report & Statistics
How much can you earn on Airbnb in Breckenridge, Colorado? Based on AirROI's 2026 dataset (July 2025 – June 2026), the short answer is $61,416 per year — at a $585 nightly rate, 37.9% occupancy, and a $241 RevPAR that reflects moderate rate-to-revenue efficiency with room to optimize.
Breckenridge's 3,163 active listings and moderate demand with room for well-positioned listings to outperform make it a major short-term rental market. Supply grew 6.5% over the past year, yet revenue and nightly rates both trended upward — a signal that traveler demand is outpacing new inventory rather than being diluted by it. For hosts, pricing power remains intact even as competition increases.
Regulation is high, and hosts should factor licensing costs and compliance timelines into their launch plan. The data points to a market where fundamentals reward execution — the right property, priced well, in the right neighborhood still outperforms.

Table of Contents [hide] [show]
What Are the Key Airbnb Metrics in Breckenridge?
In Breckenridge, the headline Airbnb metrics are $61,416 in average annual revenue,37.9% occupancy, $585 ADR, and $241 in RevPAR, and guests book about 67 days in advance.
How Much Do Airbnb Hosts Earn Monthly in Breckenridge?
Understanding the monthly revenue variations for Airbnb listings in Breckenridge is key to maximizing your short term rental income potential. Seasonality significantly impacts earnings. Our analysis, based on data from the past 12 months, shows that the peak revenue month for STRs in Breckenridge is typically February, while May often presents the lowest earnings, highlighting opportunities for strategic pricing adjustments during shoulder and low seasons. Explore the typical Airbnb income in Breckenridge across different performance tiers:
- Best-in-class properties (Top 10%) achieve $14,738+ monthly, often utilizing dynamic pricing and superior guest experiences.
- Strong performing properties (Top 25%) earn $8,808 or more, indicating effective management and desirable locations/amenities.
- Typical properties (Median) generate around $4,904 per month, representing the average market performance.
- Entry-level properties (Bottom 25%) see earnings around $2,582, often with potential for optimization.
Average Monthly Airbnb Earnings Trend in Breckenridge
What Is the Monthly Airbnb Occupancy Rate in Breckenridge?
Maximize your bookings by understanding the Breckenridge STR occupancy trends. Seasonal demand shifts significantly influence how often properties are booked. Typically, Februarysees the highest demand (peak season occupancy), while May experiences the lowest (low season). Effective strategies, like adjusting minimum stays or offering promotions, can boost occupancy during slower periods. Here's how different property tiers perform in Breckenridge:
- Best-in-class properties (Top 10%) achieve 71%+ occupancy, indicating high desirability and potentially optimized availability.
- Strong performing properties (Top 25%) maintain 55% or higher occupancy, suggesting good market fit and guest satisfaction.
- Typical properties (Median) have an occupancy rate around 36%.
- Entry-level properties (Bottom 25%) average 19% occupancy, potentially facing higher vacancy.
Average Monthly Occupancy Rate Trend in Breckenridge
What Is the Average Airbnb Nightly Rate in Breckenridge?
Effective short term rental pricing strategy in Breckenridge involves understanding monthly ADR fluctuations. The Average Daily Rate (ADR) for Airbnb in Breckenridge typically peaks in February and dips lowest during October. Leveraging Airbnb dynamic pricing tools or strategies based on this seasonality can significantly boost revenue. Here's a look at the typical nightly rates achieved:
- Best-in-class properties (Top 10%) command rates of $1,075+ per night, often due to premium features or locations.
- Strong performing properties (Top 25%) achieve nightly rates of $682 or more.
- Typical properties (Median) charge around $433 per night.
- Entry-level properties (Bottom 25%) earn around $291 per night.
Average Daily Rate (ADR) Trend by Month in Breckenridge
What Is the RevPAR for Airbnb in Breckenridge?
RevPAR in Breckenridge is currently $241. Because RevPAR combines nightly rates with realized occupancy, it is one of the cleanest ways to compare how efficiently listings turn demand into revenue across the market.
- Entry-level properties (Bottom 25%) see $114 RevPAR.
- Typical properties (Median) generate $182 RevPAR.
- Strong performers (Top 25%) earn $304 RevPAR.
- Best-in-class (Top 10%) achieve $471 RevPAR.
Average Monthly RevPAR Trend in Breckenridge
RevPAR Insights for Breckenridge
- The average RevPAR in Breckenridge is $241. This metric combines nightly rates with realized occupancy, making it one of the best single-number indicators of market efficiency.
- The gap between the top 10% ($471) and bottom 25% ($114) is $357, indicating significant performance disparity driven by property quality, pricing strategy, and location.
- RevPAR peaks in Feb and bottoms out in May, mirroring the broader seasonal demand pattern and suggesting opportunities for dynamic pricing.
Recommendations for Hosts
- Track your own RevPAR monthly against these Breckenridge benchmarks. If your RevPAR falls below the median of $182, examine whether low occupancy or low ADR is the primary drag.
- Top-quartile listings achieve $304+ RevPAR through a combination of competitive pricing, strong reviews, and strategic amenities. Target this tier through incremental improvements.
- Use RevPAR rather than revenue alone when comparing properties of different sizes — it normalizes for available nights and gives a more accurate picture of performance.
Get Live Breckenridge Market Intelligence 👇
Explore Real-time Analytics
When Is the Peak Season for Airbnb in Breckenridge?
Breckenridge's peak Airbnb season falls in February, March, December, while the softest stretch is April, May, October. Overall, the market shows highly seasonal trends requiring careful strategy, which should guide pricing, minimum stays, and cash-flow planning.
Peak Season (February, March, December)
- Revenue averages $12,509 per month
- Occupancy rates average 51.9%
- Daily rates average $790
Shoulder Season
- Revenue averages $6,137 per month
- Occupancy maintains around 38.9%
- Daily rates hold near $526
Low Season (April, May, October)
- Revenue drops to average $3,396 per month
- Occupancy decreases to average 25.1%
- Daily rates adjust to average $493
Seasonality Insights for Breckenridge
- Airbnb seasonality in Breckenridge is pronounced. Revenue swings sharply between peak and low months, which means pricing strategy, minimum-stay settings, and cash reserves all need to account for extended slower periods.
- During the high season, the absolute peak month showcases Breckenridge's highest earning potential, with monthly revenues climbing to $13,415, occupancy reaching 56.9%, and ADRs peaking at $855.
- Conversely, the slowest single month marks the market's lowest point — revenue may dip to $2,700, occupancy could drop to 21.0%, and ADRs may adjust to $462.
- Lower occupancy paired with meaningful seasonality means hosts in Breckenridge need to maximize every peak-season booking and seriously consider whether off-season pricing adjustments or minimum-stay changes can capture incremental revenue.
Seasonal Strategies for Maximizing Profit
- Peak Season: Maximize revenue through premium pricing. In a high-regulation market like Breckenridge, ensure your permit covers the number of nights you plan to book — some jurisdictions cap annual rental days.
- Low Season: Offer competitive pricing, extended-stay discounts, and flexible cancellation policies. Target off-season travelers like remote workers, budget-conscious guests, and travelers with flexible schedules.
- Shoulder Seasons: Implement dynamic pricing that bridges peak and low rates. Target weekend travelers, local events, and business visitors. Slightly more flexible terms than peak season can help maintain occupancy without deep discounting.
- In a highly seasonal market like Breckenridge, building a cash reserve during the top months is essential for covering fixed costs during the slow period. Automated pricing tools can help capture demand shifts in real time.
Do You Need a License for Airbnb in Breckenridge?
Breckenridge, Colorado, United States has a high regulation classification, yet only 53% of listings show registration evidence. That gap between regulation on the books and compliance on the ground can shift quickly — municipalities often tighten enforcement in waves, putting unregistered operators at risk of fines or delisting. Always verify the latest short-term rental regulations and Airbnb license requirements directly with local government authorities for Breckenridge to ensure full compliance before hosting.
(Source: AirROI data, 2026, based on 53% licensed listings)
What Are the Best Neighborhoods for Airbnb in Breckenridge?
In a large, heavily regulated market like Breckenridge, neighborhood selection is one of the strongest levers for Airbnb investment performance. Zoning rules, permitting availability, and guest demand patterns can vary block by block. The 8 neighborhoods below represent areas where short-term rental activity concentrates — understanding why each one attracts guests and hosts helps investors evaluate where their property type and budget fit best.
| Neighborhood / Area | Why Host Here? (Target Guests & Appeal) | Key Attractions & Landmarks |
|---|---|---|
| Peak 8 | One of the most popular areas in Breckenridge, Peak 8 offers ski-in/ski-out access and is close to the Breckenridge Ski Resort. It's perfect for winter sports enthusiasts and summer hikers alike. | Breckenridge Ski Resort, Peak 8 Fun Park, Breckenridge Distillery, Cucumber Gulch Wildlife Preserve, Ski & Snowboard School at Breckenridge |
| Historic Main Street | The heart of Breckenridge, Historic Main Street is lined with charming shops, restaurants, and bars. It's ideal for those who want to experience the local culture and nightlife. | Main Street, Breckenridge Riverwalk Center, Breckenridge Arts District, Barney Ford House Museum, Norris B. Johnson Memorial Park |
| Breck Ski Resort Base | Being right at the base of the ski resort makes this area perfect for skiers and snowboarders, providing easy access to lifts and the slopes. | Quicksilver Super6 Lift, Ski and Ride School, Breckenridge Gondola, Epic Discovery, Maggie's Pond |
| Boreas Pass | This area offers a more secluded and serene experience, with stunning views and access to hiking trails, making it great for nature lovers. | Boreas Pass Road, Lake Aloha, Minnie Mine Trail, Blue Lake Trail, Hiking at Boreas Pass |
| Warrior's Mark | A family-friendly neighborhood that is close to the slopes and has a relaxed atmosphere, ideal for groups and families looking for spacious accommodations. | Ski-in/Ski-out access, Adjustable shuttle services, Hiking trails, Nature parks nearby |
| Silverthorne | Though a bit further from the center of Breckenridge, Silverthorne offers great mountain views and access to several outdoor activities, appealing to adventurers. | Dillon Reservoir, Silverthorne Performing Arts Center, Blue River Trail, Outlets at Silverthorne, Rainbow Park |
| Frisco | Frisco is a charming mountain town that provides access to several ski areas and has a vibrant community atmosphere with local events and activities. | Frisco Historic Park, Frisco Bay Marina, Summit County Historical Society, Frisco Adventure Park, Mountain Biking Trails |
| Breckenridge Northeast | This area offers a mix of residential and vacation rentals, showcasing natural beauty and proximity to both ski resorts and summer activities. | Breck Connect Gondola, Skiing and snowboarding, Hiking to Quandary Peak, Natural wildlife areas, Parks and open spaces |
Because Breckenridge has a high regulation profile, confirming that short-term rental permits are available in your target neighborhood is a critical first step before committing to a property purchase. Regulation can vary at the neighborhood or district level even within the same city.
What Types of Properties Are on Airbnb in Breckenridge?
Room Type Distribution
Property Type Distribution
Market Composition Insights for Breckenridge
- The Breckenridge Airbnb market composition is heavily skewed towards Entire Home/Apt listings, which make up 96.7% of the 3,163 active rentals. This indicates strong guest preference for privacy and space.
- Looking at the property type distribution in Breckenridge, Apartment/Condo properties are the most common (57.2%), reflecting the local real estate landscape.
- Houses represent a significant 37.7% portion, catering likely to families or larger groups.
- Smaller segments like outdoor/unique, hotel/boutique, others (combined 5.2%) offer potential for unique stay experiences.
Breckenridge Airbnb Room Capacity Analysis (2026): Bedroom Distribution
Distribution of Listings by Number of Bedrooms
Room Capacity Insights for Breckenridge
- The dominant room capacity in Breckenridge is 2 bedrooms listings, making up 31.5% of the market. This suggests a strong demand for properties suitable for couples or solo travelers.
- Together, 2 bedrooms and 3 bedrooms properties represent 52.1% of the active Airbnb listings in Breckenridge, indicating a high concentration in these sizes.
- A significant 42.1% of listings offer 3+ bedrooms, catering to larger groups and families seeking more space in Breckenridge.
Breckenridge Vacation Rental Guest Capacity Trends (2026)
Distribution of Listings by Guest Capacity
Guest Capacity Insights for Breckenridge
- The most common guest capacity trend in Breckenridge vacation rentals is listings accommodating 8+ guests (48%). This suggests the primary traveler segment is likely larger groups.
- Properties designed for 8+ guests and 4 guests dominate the Breckenridge STR market, accounting for 70.3% of listings.
- 70.5% of properties accommodate 6+ guests, serving the market segment for larger families or group travel in Breckenridge.
- On average, properties in Breckenridge are equipped to host 6.3 guests.
How Do Listings in Breckenridge Compare on Quality?
Listing quality in Breckenridge can be approximated through presentation depth, bedroom count, and how often hosts disclose exact locations. These signals show how professionally the local supply base is merchandised.
Listing Quality Insights for Breckenridge
- At 36.2 photos per listing on average, Breckenridge hosts invest well in visual presentation. Listings with 20+ photos consistently outperform in search ranking and conversion.
- 43.8% of listings show their exact location. Lower disclosure rates can increase booking hesitation — guests want to know exactly where they are staying.
Recommendations for Hosts
- Enable exact location if possible — it removes a common source of guest uncertainty and can improve your listing's position in map-based searches.
- Use these quality indicators as a self-audit checklist. Listings that exceed the Breckenridge averages across all three metrics are better positioned for premium pricing.
What Amenities Do Airbnb Guests Expect in Breckenridge?
Amenity Prevalence
Amenity Insights for Breckenridge
- Essential amenities in Breckenridge that guests expect include: Wifi, TV, Heating, Smoke alarm, Kitchen, Carbon monoxide alarm, Coffee maker. Lacking these (any) could significantly impact bookings.
- Popular amenities like Microwave, Dishes and silverware, Essentials are common but not universal. Offering these can provide a competitive edge.
Recommendations for Hosts
- Ensure your listing includes all essential amenities for Breckenridge: Wifi, TV, Heating, Smoke alarm, Kitchen, Carbon monoxide alarm, Coffee maker.
- Prioritize adding missing essentials: Wifi, TV, Heating, Smoke alarm, Kitchen, Carbon monoxide alarm, Coffee maker.
- Consider adding popular differentiators like Microwave or Dishes and silverware to increase appeal.
- Highlight unique or less common amenities you offer (e.g., hot tub, dedicated workspace, EV charger) in your listing description and photos.
- Regularly check competitor amenities in Breckenridge to stay competitive.
Which Airbnb Amenities Boost Revenue in Breckenridge?
Not every amenity matters equally. This table focuses on the amenities most associated with higher revenue in Breckenridge, which makes it more useful for prioritizing upgrades than a simple popularity list alone.
| Amenity | Prevalence | Revenue With | Revenue Without | Revenue Uplift |
|---|---|---|---|---|
Dishes and silverware | 94.7% | $64,526 | $6,312 | 922.2% |
Cooking basics | 86.0% | $68,382 | $18,760 | 264.5% |
KayakHigh opportunity | 0.6% | $155,514 | $60,817 | 155.7% |
Essentials | 91.1% | $64,913 | $25,554 | 154.0% |
Hair dryer | 88.9% | $65,719 | $26,940 | 143.9% |
Smoke alarm | 97.8% | $62,232 | $25,900 | 140.3% |
Washer | 85.7% | $66,790 | $29,265 | 128.2% |
Children’s bikesHigh opportunity | 0.2% | $133,745 | $61,256 | 118.3% |
Dryer | 84.5% | $66,958 | $31,255 | 114.2% |
Shampoo | 87.6% | $65,438 | $32,987 | 98.4% |
Revenue Impact Insights for Breckenridge
- Dishes and silverware tops the revenue impact list with a 922.2% uplift — listings with this amenity earn $64,526 vs. $6,312 without it.
- High-opportunity amenities — Kayak, Children’s bikes — combine revenue uplift above 100% with prevalence under 10%, meaning most competitors haven't adopted them yet.
- Dishes and silverware, Cooking basics, Essentials, Hair dryer, Smoke alarm, Washer, Dryer, Shampoo — while widespread — still correlate with meaningful revenue gains, making them table stakes rather than true differentiators.
Recommendations for Hosts
- Prioritize adding Kayak — it has the best combination of high revenue impact and low market saturation in Breckenridge.
- Focus your upgrade budget on amenities in the top half of this table. Below-median amenities may improve guest experience but contribute less to revenue growth.
- Highlight revenue-impacting amenities prominently in your listing title, photos, and description — guests can't value what they don't notice.
Dive Deeper: Advanced Breckenridge STR Market Data (2026)
Ready to unlock more insights? AirROI provides access to advanced metrics and comprehensive Airbnb data for Breckenridge. Explore detailed analytics beyond this report to refine your investment strategy, optimize pricing, and maximize your vacation rental profits.
Explore Advanced MetricsBreckenridge Airbnb Guest Demographics & Profile Analysis (2026)
Guest Profile Summary for Breckenridge
- The typical guest profile for Airbnb in Breckenridge consists of primarily domestic travelers (95%), often arriving from nearby Denver, typically belonging to the Post-2000s (Gen Z/Alpha) group (50%), primarily speaking English or Spanish.
- Domestic travelers account for 95.3% of guests.
- Key international markets include United States (95.3%) and Mexico (1.3%).
- Top languages spoken are English (69.4%) followed by Spanish (16.7%).
- A significant demographic segment is the Post-2000s (Gen Z/Alpha) group, representing 50% of guests.
Recommendations for Hosts
- Target domestic marketing efforts towards travelers from Denver and Colorado Springs.
- Tailor amenities and listing descriptions to appeal to the dominant Post-2000s (Gen Z/Alpha) demographic (e.g., highlight fast WiFi, smart home features, local guides).
- Highlight unique local experiences or amenities relevant to the primary guest profile.
- Consider seasonal promotions aligned with peak travel times for key origin markets.
What Are Airbnb Guest Ratings in Breckenridge?
Listings in Breckenridge average 4.79 out of 5 overall, with about 61.4 reviews per active listing and 38.7% of listings carrying the Guest Favorite badge.
Rating Breakdown by Category
Guest Rating Insights for Breckenridge
- An average rating of 4.79 places Breckenridge in solid territory. Most guests leave satisfied, though there is room for hosts to push toward the top tier.
- The strongest subcategory is Location (4.93), while Value (4.71) trails behind — a useful signal for hosts looking to prioritize upgrades.
- 38.7% of listings carry the Guest Favorite badge, a strong trust signal that can meaningfully lift click-through and booking rates.
Recommendations for Hosts
- Focus improvement efforts on Value — even small gains in the weakest subcategory can lift overall ratings and search ranking.
- Encourage guests to leave reviews after checkout. Listings with more reviews rank higher in search results and convert browsers into bookers more effectively.
Breckenridge Airbnb Booking Patterns (2026): Available vs. Booked Days
Available Days Distribution
Booked Days Distribution
Booking Pattern Insights for Breckenridge
- The most common availability pattern in Breckenridge falls within the 271-366 days range, representing 52.5% of listings. This suggests many properties have significant open periods on their calendars.
- Approximately 87.9% of listings show high availability (181+ days open annually), indicating potential for increased bookings or specific owner usage patterns.
- For booked days, the 91-180 days range is most frequent in Breckenridge (36.2%), reflecting common guest stay durations or potential owner blocking patterns.
- A notable 13.2% of properties secure long booking periods (181+ days booked per year), highlighting successful long-term rental strategies or significant owner usage.
How Far in Advance Do Guests Book Airbnb in Breckenridge?
Average Booking Lead Time by Month
Booking Lead Time Insights for Breckenridge
- The overall average booking lead time for vacation rentals in Breckenridge is 67 days.
- Guests book furthest in advance for stays during February (average 81 days), likely coinciding with peak travel demand or local events.
- The shortest booking windows occur for stays in May (average 37 days), indicating more last-minute travel plans during this time.
- Seasonally, Winter (75 days avg.) sees the longest lead times, while Fall (53 days avg.) has the shortest, reflecting typical travel planning cycles.
Recommendations for Hosts
- Use the overall average lead time (67 days) as a baseline for your pricing and availability strategy in Breckenridge.
- For February stays, consider implementing length-of-stay discounts or slightly higher rates for bookings made less than 81 days out to capitalize on advance planning.
- Target marketing efforts for the Winter season well in advance (at least 75 days) to capture early planners.
- Monitor your own booking lead times against these Breckenridge averages to identify opportunities for dynamic pricing adjustments.
What Is the Average Length of Stay for Airbnb in Breckenridge?
Guests in Breckenridge stay about 4.8 nights on average, generating roughly 66,279 reservations and 21 bookings per listing in the latest AirROI dataset. The most common check-in time is 4:00 PM and check-out is 10:00 AM.
Monthly Length of Stay in Breckenridge
Check-in Time Distribution
Check-out Time Distribution
Stay Pattern Insights for Breckenridge
- A mid-range stay length points to leisure-driven demand — weekend getaways and short vacations. Hosts should optimize for quick turnover efficiency while keeping the guest experience smooth.
- At 21 bookings per listing, the turnover rate is high. Hosts with streamlined operations (self-check-in, automated messaging, reliable cleaners) have a structural advantage.
- Stay lengths peak in Jul (5.2 nights) and shorten in May (3.4 nights). Adjust minimum-night requirements seasonally to match.
Recommendations for Hosts
- With shorter average stays, focus on streamlining turnover. Self-check-in, reliable cleaning crews, and pre-staged amenities can reduce per-booking operational costs.
- Set your check-in time to match or beat the market standard of 4:00 PM. Offering early check-in flexibility can be a low-cost differentiator.
- Monitor length-of-stay seasonality to adjust minimum-night requirements — longer minimums during peak periods maximize revenue while shorter minimums fill gaps in shoulder seasons.
Breckenridge Airbnb Minimum Stay Requirements Analysis
Distribution of Listings by Minimum Night Requirement
1 Night
250 listings
7.9% of total
2 Nights
612 listings
19.3% of total
3 Nights
247 listings
7.8% of total
4-6 Nights
177 listings
5.6% of total
7-29 Nights
37 listings
1.2% of total
30+ Nights
1840 listings
58.2% of total
Key Insights
- The most prevalent minimum stay requirement in Breckenridge is 30+ Nights, adopted by 58.2% of listings. This highlights the market's preference for longer commitments.
- A significant segment (58.2%) caters to monthly stays (30+ nights) in Breckenridge, pointing to opportunities in the extended-stay market.
Recommendations
- Align with the market by considering a 30+ Nights minimum stay, as 58.2% of Breckenridge hosts use this setting.
- If feasible, allowing 1-night stays, especially midweek or during low season, could capture last-minute bookings, as only 7.9% currently do.
- Explore offering discounts for stays of 30+ nights to attract the 58.2% of the market seeking extended stays.
- Adjust minimum nights based on seasonality – potentially shorter during low season and longer during peak demand periods in Breckenridge.
Breckenridge Airbnb Cancellation Policy Trends Analysis (2026)
Limited
132 listings
4.2% of total
Super Strict 60 Days
335 listings
10.6% of total
Super Strict 30 Days
410 listings
13% of total
Flexible
64 listings
2% of total
Moderate
333 listings
10.5% of total
Firm
1573 listings
49.7% of total
Strict
316 listings
10% of total
Cancellation Policy Insights for Breckenridge
- The prevailing Airbnb cancellation policy trend in Breckenridge is Firm, used by 49.7% of listings.
- A majority (59.7%) of hosts in Breckenridge utilize Firm or Strict policies, indicating a market where hosts prioritize booking security.
Recommendations for Hosts
- Consider adopting a Firm policy to align with the 49.7% market standard in Breckenridge.
- Using a Strict policy might deter some guests, as only 10% of listings use it. Evaluate if potential revenue protection outweighs possible lower booking rates.
- Regularly review your cancellation policy against competitors and market demand shifts in Breckenridge.
How Much Are Airbnb Cleaning Fees in Breckenridge?
Cleaning fees in Breckenridge are meaningful operating levers, not just pass-through charges. What matters most is how often hosts charge them, how high they run relative to market norms, and how large a share of gross revenue they consume.
Cleaning Fee Insights for Breckenridge
- 95.5% of listings charge a cleaning fee, making it standard practice in Breckenridge. Guests expect it and factor it into their booking decisions.
- The gap between the average ($519) and median ($250) cleaning fee indicates some high-end properties are pulling the average up considerably.
- Cleaning fees represent 11.0% of gross revenue on average — a significant line item that impacts total guest cost and competitiveness.
Recommendations for Hosts
- Price your cleaning fee competitively against the Breckenridge median of $250. Fees significantly above market norms can deter bookings, especially for shorter stays.
- Consider whether bundling the cleaning fee into a slightly higher nightly rate might improve conversion, since many guests filter by total price and separate fees can feel punitive.
- Monitor competitor cleaning fees regularly. Airbnb's search algorithm factors in total price, so a well-calibrated cleaning fee can improve your listing's ranking.
What Do the Top Airbnb Listings in Breckenridge Look Like?
Benchmark your potential! Explore examples of top-performing Airbnb properties in Breckenridgebased on Trailing Twelve Month (TTM) revenue. Analyze their characteristics, revenue, occupancy rate, and ADR to understand what drives success in this market.
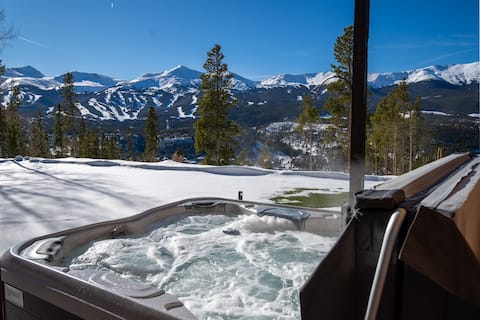
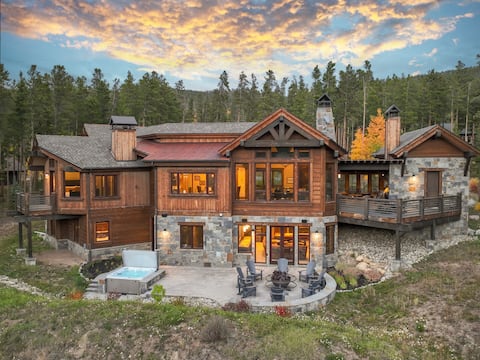
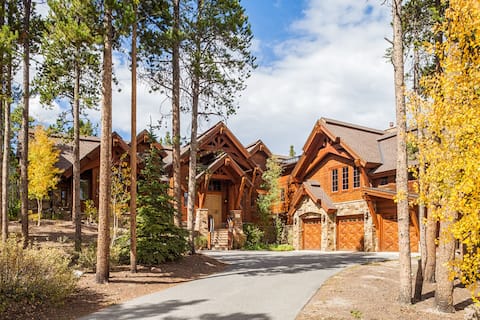
Luxury mountain home with stunning views, hot tub,
Entire Place • 8 bedrooms
Entertaining Masterpiece, close to town, views!
Entire Place • 5 bedrooms

Walk town and parks, shuttle, hot tub, game room!
Entire Place • 5 bedrooms
Hatari Lodge: Huge Custom Home Walk to Gondola!
Entire Place • 5 bedrooms

Everything you'd ever want!
Entire Place • 5 bedrooms

Trail walk to town, Panoramic of Breckenridge!
Entire Place • 5 bedrooms
Note: Performance varies based on location, size, amenities, seasonality, and management quality. Data reflects the past 12 months.
Who Are the Top Airbnb Hosts in Breckenridge?
Learn from the best! This table showcases top-performing Airbnb hosts in Breckenridge based on the number of properties managed and estimated total revenue over the past year. Analyze their scale and performance metrics.
| Host Name | Properties | Grossing Revenue | Stay Reviews | Avg Rating |
|---|---|---|---|---|
| Summit Mountain Rentals | 223 | $15,808,095 | 2556 | 4.71/5.0 |
| VisitBreck | 145 | $15,258,517 | 2114 | 4.85/5.0 |
| Alpine Edge | 76 | $10,235,896 | 4080 | 4.89/5.0 |
| Great Western Lodging | 168 | $8,759,342 | 3941 | 4.58/5.0 |
| LocalVR Breckenridge | 115 | $8,217,949 | 10687 | 4.76/5.0 |
| Ski Country Resorts | 129 | $7,796,764 | 9658 | 4.67/5.0 |
| Summit Luxury Estates | 20 | $6,401,318 | 311 | 4.94/5.0 |
| Evolve | 85 | $6,300,630 | 6563 | 4.79/5.0 |
| Jesse | 77 | $6,015,914 | 4357 | 4.95/5.0 |
| Live Breck Property Management | 43 | $5,385,054 | 1408 | 4.96/5.0 |
Analyzing the strategies of top hosts, such as their property selection, pricing, and guest communication, can offer valuable lessons for optimizing your own Airbnb operations in Breckenridge.
Who Are the Airbnb Hosts in Breckenridge?
Breckenridge is a quality-focused market, with a high Superhost share and fairly mature operating standards.
Host Profile Insights for Breckenridge
- With 56.1% Superhosts, Breckenridge has an experienced host base that sets high guest expectations. New entrants should plan for competitive quality standards.
- 56.2% of listings are professionally managed, indicating a mature, competitive market with institutional players.
- 18.5% of listings have Instant Book enabled. Lower Instant Book adoption means many guests must request approval, which can slow conversions.
- 85.8% of listings use Airbnb's simplified pricing (host-only fee), where the host pays the entire platform service fee and the guest sees one all-in price with no separate Airbnb service charge. High adoption signals a professional, PMS-connected host base — Airbnb mandates simplified pricing for software-connected listings.
Recommendations for Hosts
- Consider enabling Instant Book — it reduces booking friction and Airbnb's algorithm tends to favor Instant Book listings in search results.
- With 14.1% cohosted listings, there may be a growing local market for property management services.
- Benchmark your host metrics against these Breckenridge averages regularly and adjust your hosting strategy based on what top performers do differently.
Top Professional Management Companies in Breckenridge
These are the highest-grossing professional property management operations in Breckenridge, ranked by total revenue across their portfolio. Their performance metrics offer a benchmark for what institutional-level hosting looks like in this market.
| Company | Listings | Revenue | ADR | Occ. | Rating |
|---|---|---|---|---|---|
| Summit Mountain Rentals | 223 | $15,808,095 | $607 | 39.0% | 4.71/5 |
| VisitBreck | 145 | $15,258,517 | $1,005 | 36.1% | 4.85/5 |
| Alpine Edge | 76 | $10,235,896 | $772 | 52.8% | 4.89/5 |
| Great Western Lodging | 168 | $8,759,342 | $443 | 37.2% | 4.58/5 |
| LocalVR Breckenridge | 115 | $8,217,949 | $423 | 50.6% | 4.76/5 |
| Ski Country Resorts | 129 | $7,796,764 | $338 | 47.9% | 4.67/5 |
| Summit Luxury Estates | 20 | $6,401,318 | $3,667 | 30.4% | 4.94/5 |
| Evolve | 85 | $6,300,630 | $420 | 47.4% | 4.79/5 |
| Jesse | 77 | $6,015,914 | $498 | 44.4% | 4.95/5 |
| Live Breck Property Management | 43 | $5,385,054 | $797 | 48.4% | 4.96/5 |
Management Company Insights for Breckenridge
- The leading management company, Summit Mountain Rentals, operates 223 listings with $15,808,095 in gross revenue — a useful benchmark for what scale looks like in Breckenridge.
- Top managers average 108 properties each, pointing to a market where portfolio scale is a meaningful competitive factor.
- Professionally managed listings in the top tier average 4.81/5 in guest ratings — demonstrating that scale and quality can coexist.
Recommendations
- Study how top management companies price, position, and maintain their portfolios — their ADR and occupancy rates reflect strategies refined across dozens of listings.
- If you're considering hiring a property manager, compare their portfolio performance against these benchmarks before committing.
How Does Breckenridge's Airbnb Market Compare to Nearby Cities?
How does the Breckenridge Airbnb market stack up against its neighbors? Compare key performance metrics like average monthly revenue, ADR, and occupancy rates in surrounding areas to understand the broader regional STR landscape.
Compared with Black Hawk, Breckenridge has 11 percentage points lower occupancy and about $243 higher ADR. That helps frame whether this market is winning more on demand, pricing, or both.
| Market | Active Properties | Monthly Revenue | Daily Rate | Avg. Occupancy |
|---|---|---|---|---|
| Aspen | 634 | $7,185 | $1072.11 | 35% |
| Blue River | 195 | $6,925 | $646.90 | 41% |
| Snowmass | 18 | $6,345 | $793.71 | 36% |
| El Jebel | 32 | $5,468 | $526.66 | 43% |
| Snowmass Village | 656 | $5,166 | $787.86 | 35% |
| Aspen Park | 10 | $5,087 | $420.42 | 47% |
| Indian Hills | 13 | $4,894 | $339.71 | 48% |
| Beaver Creek | 544 | $4,694 | $962.29 | 28% |
| Glenwood Springs | 257 | $4,693 | $374.84 | 46% |
| Black Hawk | 138 | $4,677 | $341.40 | 49% |
Frequently Asked Questions About Airbnb in Breckenridge
These quick answers summarize the most common investor and operator questions using AirROI's latest market data for Breckenridge.
How much do Airbnb hosts make in Breckenridge?
Breckenridge hosts earn about $61,416 per year on average, with an average nightly rate of $585 and RevPAR of $241. Those figures describe the typical revenue environment for active listings in Breckenridge, Colorado, not the ceiling for the best operators. Source: AirROI 2026 data, Breckenridge market, July 2025 to June 2026.
What is the average Airbnb occupancy rate in Breckenridge?
The average Airbnb occupancy rate in Breckenridge is 37.9%. February is the strongest month and May is the softest, so hosts should expect demand to move meaningfully throughout the year rather than stay flat.
What is the average Airbnb daily rate in Breckenridge?
Listings in Breckenridge average $585 per night. The broader pricing spread also matters: lower-performing listings cluster closer to the lower quartiles, while premium homes can price materially above the city average when demand spikes or listing quality stands out.
How many Airbnb listings are active in Breckenridge?
Breckenridge currently has about 3,163 active Airbnb listings in AirROI's market dataset. That supply count helps explain how competitive the market is, how much depth there is for benchmarking, and whether the market behaves like a niche destination or a scaled urban market.
How strict are short-term rental regulations in Breckenridge?
AirROI currently classifies the short-term rental regulation level in Breckenridge as High. The dataset also shows about 52.8% of listings with registration evidence. That is a market signal, not legal advice, so hosts should still confirm current licensing and compliance rules locally before listing.
What is the RevPAR for Airbnb in Breckenridge?
RevPAR in Breckenridge is about $241. That metric combines pricing and occupancy into one efficiency number, so it is often a better quick benchmark than ADR alone when investors want to compare how well listings convert nightly rates into realized revenue.
Is Airbnb profitable in Breckenridge?
Occupancy of 37.9% means Breckenridge is a more selective market. Profitability is achievable but requires careful cost management, premium positioning, or targeting longer stays to reduce turnover. Average annual revenue is $61,416, but individual returns depend on property type, location within the city, and the host's operating efficiency.
How far in advance do guests book Airbnb in Breckenridge?
The average booking lead time in Breckenridge is about 67 days — a longer planning horizon typical of destination or vacation markets where travelers book well in advance. Hosts who understand their market's booking cadence can adjust minimum stays and pricing windows accordingly.
What are the best neighborhoods for Airbnb in Breckenridge?
Based on AirROI's analysis, some of the top neighborhoods for short-term rentals in Breckenridge include Peak 8, Historic Main Street, Breck Ski Resort Base. Each area attracts different guest profiles — from business travelers to leisure visitors — so the best location depends on the property type and target audience a host is aiming for. See the full neighborhood breakdown above.
What type of property performs best on Airbnb in Breckenridge?
entire_home listings make up 96.7% of the active supply in Breckenridge. The most common configuration does not always mean the most profitable — operators who identify underserved property types or bedroom counts can sometimes outperform the market average by filling a gap in local supply.
How does Breckenridge compare to nearby Airbnb markets?
Among neighboring markets, Aspen posts $86,219 in average annual revenue with 35.0% occupancy, compared to Breckenridge's $61,416 and 37.9%. Comparing nearby markets helps investors understand whether a destination's performance reflects local demand or broader regional trends.
What is the average length of stay in Breckenridge?
The average Airbnb stay length in Breckenridge is about 4.8 nights. That matters for turnover, cleaning operations, and pricing strategy because shorter stays increase changeovers while longer stays can smooth occupancy and reduce operational friction.
What is the average Airbnb guest rating in Breckenridge?
Airbnb listings in Breckenridge average 4.79 out of 5 overall. About 38.7% of listings carry the guest favorite badge, which suggests a meaningful share of inventory is competing on review quality rather than price alone.
Which amenities boost Airbnb revenue in Breckenridge?
Dishes and silverware and Cooking basics are among the strongest revenue-linked amenities in Breckenridge. In AirROI's latest dataset, listings with these amenities outperform those without on average revenue, which makes amenities analysis useful for prioritizing investment and listing upgrades.
Do Airbnb hosts charge cleaning fees in Breckenridge?
Yes. About 95.5% of active Airbnb listings in Breckenridge charge a cleaning fee, and the average fee is $519. The more important operating benchmark is how much of gross revenue that fee consumes, not just the absolute dollar amount.
What percentage of Airbnb hosts are Superhosts in Breckenridge?
A 56.1% Superhost rate signals a highly competitive market where review quality and responsiveness are table stakes, not differentiators.
About AirROI Market Data
AirROI tracks over 20 million properties across 190+ countries and maintains 15+ years of historical performance data, making it one of the deepest Airbnb and STR intelligence platforms available. The analytics pipeline aggregates listing-level data monthly — revenue, occupancy, nightly rates, RevPAR, guest demographics, booking patterns, and competitive supply — so investors and operators can benchmark any market against its own history and against neighboring destinations.
Real estate investors, property managers, financial institutions, hedge funds, tourism boards, hospitality consultants, tech platforms, and academic researchers rely on AirROI data to underwrite acquisitions, optimize pricing, model macro trends, and conduct peer-reviewed research. Data is available through in-depth market reports like this one and the Airbnb API with 22 endpoints and an Airbnb MCP Server for AI agents.
AirROI proprietary analytics as of 2026-06-30. Metrics reflect trailing twelve-month aggregates from active listings. Revenue figures are market averages, not projections. Neighborhood descriptions are AI-generated and reviewed for accuracy. For full methodology, see the data methodology page.