Idaho Springs Airbnb Market Analysis 2026: Short Term Rental Data & Vacation Rental Statistics in Colorado, United States
Is Airbnb profitable in Idaho Springs in 2026? Explore comprehensive Airbnb analytics for Idaho Springs, Colorado, United States to uncover income potential. This 2026 STR market report for Idaho Springs, based on AirROI data from February 2025 to January 2026, reveals key trends in the niche market of 167 active listings.
Whether you're considering an Airbnb investment in Idaho Springs, optimizing your existing vacation rental, or exploring rental arbitrage opportunities, understanding the Idaho Springs Airbnb data is crucial. Understanding the local regulations is key to maximizing your short term rental income potential. Let's dive into the specifics.
Key Idaho Springs Airbnb Performance Metrics Overview
Monthly Airbnb Revenue Variations & Income Potential in Idaho Springs (2026)
Understanding the monthly revenue variations for Airbnb listings in Idaho Springs is key to maximizing your short term rental income potential. Seasonality significantly impacts earnings. Our analysis, based on data from the past 12 months, shows that the peak revenue month for STRs in Idaho Springs is typically July, while April often presents the lowest earnings, highlighting opportunities for strategic pricing adjustments during shoulder and low seasons. Explore the typical Airbnb income in Idaho Springs across different performance tiers:
- Best-in-class properties (Top 10%) achieve $9,032+ monthly, often utilizing dynamic pricing and superior guest experiences.
- Strong performing properties (Top 25%) earn $6,130 or more, indicating effective management and desirable locations/amenities.
- Typical properties (Median) generate around $3,890 per month, representing the average market performance.
- Entry-level properties (Bottom 25%) see earnings around $2,345, often with potential for optimization.
Average Monthly Airbnb Earnings Trend in Idaho Springs
Idaho Springs Airbnb Occupancy Rate Trends (2026)
Maximize your bookings by understanding the Idaho Springs STR occupancy trends. Seasonal demand shifts significantly influence how often properties are booked. Typically, Julysees the highest demand (peak season occupancy), while January experiences the lowest (low season). Effective strategies, like adjusting minimum stays or offering promotions, can boost occupancy during slower periods. Here's how different property tiers perform in Idaho Springs:
- Best-in-class properties (Top 10%) achieve 80%+ occupancy, indicating high desirability and potentially optimized availability.
- Strong performing properties (Top 25%) maintain 66% or higher occupancy, suggesting good market fit and guest satisfaction.
- Typical properties (Median) have an occupancy rate around 51%.
- Entry-level properties (Bottom 25%) average 34% occupancy, potentially facing higher vacancy.
Average Monthly Occupancy Rate Trend in Idaho Springs
Average Daily Rate (ADR) Airbnb Trends in Idaho Springs (2026)
Effective short term rental pricing strategy in Idaho Springs involves understanding monthly ADR fluctuations. The Average Daily Rate (ADR) for Airbnb in Idaho Springs typically peaks in December and dips lowest during April. Leveraging Airbnb dynamic pricing tools or strategies based on this seasonality can significantly boost revenue. Here's a look at the typical nightly rates achieved:
- Best-in-class properties (Top 10%) command rates of $467+ per night, often due to premium features or locations.
- Strong performing properties (Top 25%) achieve nightly rates of $361 or more.
- Typical properties (Median) charge around $263 per night.
- Entry-level properties (Bottom 25%) earn around $175 per night.
Average Daily Rate (ADR) Trend by Month in Idaho Springs
Get Live Idaho Springs Market Intelligence 👇

Explore Real-time Analytics
Airbnb Seasonality Analysis & Trends in Idaho Springs (2026)
Peak Season (July, August, June)
- Revenue averages $6,399 per month
- Occupancy rates average 63.4%
- Daily rates average $304
Shoulder Season
- Revenue averages $4,637 per month
- Occupancy maintains around 50.1%
- Daily rates hold near $286
Low Season (January, April, November)
- Revenue drops to average $3,212 per month
- Occupancy decreases to average 36.5%
- Daily rates adjust to average $270
Seasonality Insights for Idaho Springs
- The Airbnb seasonality in Idaho Springs shows highly seasonal trends requiring careful strategy. While the sections above show seasonal averages, it's also insightful to look at the extremes:
- During the high season, the absolute peak month showcases Idaho Springs's highest earning potential, with monthly revenues capable of climbing to $7,045, occupancy reaching a high of 67.2%, and ADRs peaking at $329.
- Conversely, the slowest single month of the year, typically falling within the low season, marks the market's lowest point. In this month, revenue might dip to $2,844, occupancy could drop to 35.6%, and ADRs may adjust down to $239.
- Understanding both the seasonal averages and these monthly peaks and troughs in revenue, occupancy, and ADR is crucial for maximizing your Airbnb profit potential in Idaho Springs.
Seasonal Strategies for Maximizing Profit
- Peak Season: Maximize revenue through premium pricing and potentially longer minimum stays. Ensure high availability.
- Low Season: Offer competitive pricing, special promotions (e.g., extended stay discounts), and flexible cancellation policies. Target off-season travelers like remote workers or budget-conscious guests.
- Shoulder Seasons: Implement dynamic pricing that balances peak and low rates. Target weekend travelers or specific events. Offer slightly more flexible terms than peak season.
- Regularly analyze your own performance against these Idaho Springs seasonality benchmarks and adjust your pricing and availability strategy accordingly.
Best Areas for Airbnb Investment in Idaho Springs (2026)
Exploring the top neighborhoods for short-term rentals in Idaho Springs? This section highlights key areas, outlining why they are attractive for hosts and guests, along with notable local attractions. Consider these locations based on your target guest profile and investment strategy.
| Neighborhood / Area | Why Host Here? (Target Guests & Appeal) | Key Attractions & Landmarks |
|---|---|---|
| Downtown Idaho Springs | The historic heart of Idaho Springs, close to restaurants, shops, and the beautiful Clear Creek. Ideal for tourists looking to explore local culture and enjoy outdoor activities. | Clear Creek, Idaho Springs Historic District, Buckskin Joe's, Indian Hot Springs, Astor House Museum |
| Georgetown Loop Railroad | A major draw for visitors, this scenic railroad attracts tourists interested in history and breathtaking views. Perfect for hosting travelers seeking unique experiences. | Georgetown Loop Railroad, Georgetown Lake, Historic Georgetown, Museum of the Americas, Barker Gulch |
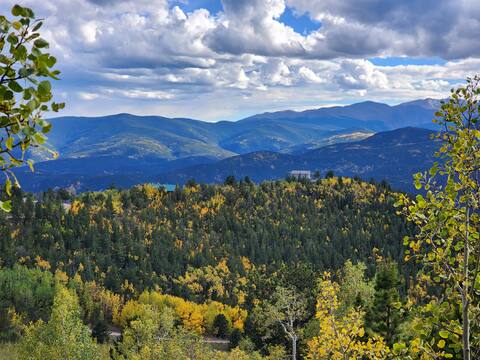
| Mount Evans | An outdoor paradise, known for its stunning mountain scenery and recreational activities. Appeals to nature lovers and adventure seekers year-round. | Mount Evans Scenic Byway, Summit Lake Park, Hiking Trails, Wildflower Fields, Wildlife Viewing |
| St. Mary's Glacier | A popular hiking destination, attracting visitors with its beautiful scenery and accessible trails, especially in summer and fall. | St. Mary's Glacier Hike, Lake St. Mary, Scenic Views, Wildlife Viewing, Ice Climbing |
| Echo Lake | Another scenic spot near Mount Evans, this area is known for its picturesque lake and outdoor activities. Suitable for families and outdoor enthusiasts. | Echo Lake Park, Picnic Areas, Hiking Trails, Fishing, Wildflower Viewing |
| Idaho Springs Mountain Park | Offers a unique experience with its mix of natural beauty and mountain recreational activities. A great spot for hosting groups or families. | Mountain Recreation, Picnic Areas, Scenic Views, Wildlife Viewing, Trails |
| North Fork of the Clear Creek | Families and outdoor adventure seekers flock to this area for camping, hiking, and fishing opportunities. | Camping Sites, Hiking Trails, Fishing Areas, Picnic Spots, Nature Watching |
| Harris Park | A family-friendly area with park amenities and close access to outdoor adventures. Ideal for families visiting Idaho Springs. | Harris Park, Playgrounds, Picnic Areas, Trail Access, Scenic Views |
Understanding Airbnb License Requirements & STR Laws in Idaho Springs (2026)
With 28% of listings showing registration in 2026, understanding potential Airbnb license requirements is crucial in Idaho Springs. Always verify the latest short term rental regulations and Airbnb license requirements directly with local government authorities for Idaho Springs to ensure full compliance before hosting.
(Source: AirROI data, 2026, based on 28% licensed listings)
Top Performing Airbnb Properties in Idaho Springs (2026)
Benchmark your potential! Explore examples of top-performing Airbnb properties in Idaho Springsbased on Trailing Twelve Month (TTM) revenue. Analyze their characteristics, revenue, occupancy rate, and ADR to understand what drives success in this market.

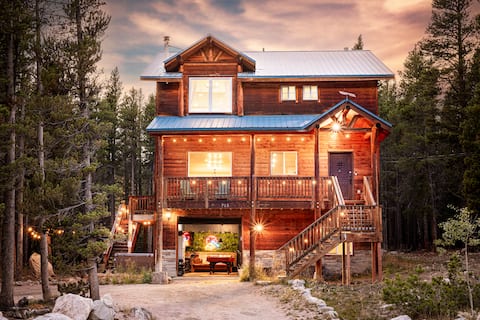
Expansive Views! 4500SqFt Luxury Dome Near Denver
Entire Place • 5 bedrooms
Hot Tub, Near Loveland Ski | Game Room | Pets
Entire Place • 4 bedrooms
Indoor Pool | Hot Tub | 4 Acres | Off Grid | Views
Entire Place • 6 bedrooms

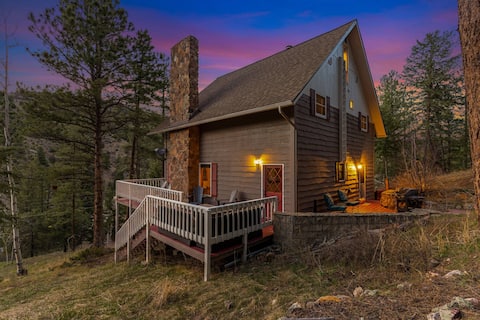
2 Mi to St Mary’s Glacier: Modern Cabin w/ Hot Tub
Entire Place • 2 bedrooms
King of the Mountain. Private Hot Tub. Pets allowe
Entire Place • 5 bedrooms

Cabin on Fall River- Cozy Streamside Cabin
Entire Place • 3 bedrooms
Note: Performance varies based on location, size, amenities, seasonality, and management quality. Data reflects the past 12 months.
Top Performing Airbnb Hosts in Idaho Springs (2026)
Learn from the best! This table showcases top-performing Airbnb hosts in Idaho Springs based on the number of properties managed and estimated total revenue over the past year. Analyze their scale and performance metrics.
| Host Name | Properties | Grossing Revenue | Stay Reviews | Avg Rating |
|---|---|---|---|---|
| Evolve | 9 | $575,085 | 812 | 4.81/5.0 |
| Anna | 13 | $491,579 | 3607 | 4.90/5.0 |
| Gino | 7 | $348,190 | 718 | 4.97/5.0 |
| Tyler | 4 | $313,031 | 453 | 4.92/5.0 |
| Grand Hospitality Group | 1 | $302,835 | 59 | 4.88/5.0 |
| Derek Barnes | 6 | $263,022 | 530 | 4.86/5.0 |
| Emily | 1 | $167,399 | 125 | 4.98/5.0 |
| Caroline | 6 | $155,859 | 2039 | 4.75/5.0 |
| Kristen Marie | 2 | $154,639 | 165 | 4.99/5.0 |
| Alan | 1 | $152,849 | 76 | 4.71/5.0 |
Analyzing the strategies of top hosts, such as their property selection, pricing, and guest communication, can offer valuable lessons for optimizing your own Airbnb operations in Idaho Springs.
Dive Deeper: Advanced Idaho Springs STR Market Data (2026)
Ready to unlock more insights? AirROI provides access to advanced metrics and comprehensive Airbnb data for Idaho Springs. Explore detailed analytics beyond this report to refine your investment strategy, optimize pricing, and maximize your vacation rental profits.
Explore Advanced MetricsIdaho Springs Short-Term Rental Market Composition (2026): Property & Room Types
Room Type Distribution
Property Type Distribution
Market Composition Insights for Idaho Springs
- The Idaho Springs Airbnb market composition is heavily skewed towards Entire Home/Apt listings, which make up 95.8% of the 167 active rentals. This indicates strong guest preference for privacy and space.
- Looking at the property type distribution in Idaho Springs, Outdoor/Unique properties are the most common (46.7%), reflecting the local real estate landscape.
- Houses represent a significant 34.1% portion, catering likely to families or larger groups.
- Smaller segments like hotel/boutique, others, unique stays (combined 4.8%) offer potential for unique stay experiences.
Idaho Springs Airbnb Room Capacity Analysis (2026): Bedroom Distribution
Distribution of Listings by Number of Bedrooms
Room Capacity Insights for Idaho Springs
- The dominant room capacity in Idaho Springs is 2 bedrooms listings, making up 35.3% of the market. This suggests a strong demand for properties suitable for couples or solo travelers.
- Together, 2 bedrooms and 3 bedrooms properties represent 60.4% of the active Airbnb listings in Idaho Springs, indicating a high concentration in these sizes.
- A significant 37.1% of listings offer 3+ bedrooms, catering to larger groups and families seeking more space in Idaho Springs.
Idaho Springs Vacation Rental Guest Capacity Trends (2026)
Distribution of Listings by Guest Capacity
Guest Capacity Insights for Idaho Springs
- The most common guest capacity trend in Idaho Springs vacation rentals is listings accommodating 8+ guests (24.6%). This suggests the primary traveler segment is likely larger groups.
- Properties designed for 8+ guests and 6 guests dominate the Idaho Springs STR market, accounting for 49.2% of listings.
- 52.8% of properties accommodate 6+ guests, serving the market segment for larger families or group travel in Idaho Springs.
- On average, properties in Idaho Springs are equipped to host 5.2 guests.
Idaho Springs Airbnb Booking Patterns (2026): Available vs. Booked Days
Available Days Distribution
Booked Days Distribution
Booking Pattern Insights for Idaho Springs
- The most common availability pattern in Idaho Springs falls within the 91-180 days range, representing 41.3% of listings. This suggests many properties have significant open periods on their calendars.
- Approximately 53.3% of listings show high availability (181+ days open annually), indicating potential for increased bookings or specific owner usage patterns.
- For booked days, the 181-270 days range is most frequent in Idaho Springs (42.5%), reflecting common guest stay durations or potential owner blocking patterns.
- A notable 49.1% of properties secure long booking periods (181+ days booked per year), highlighting successful long-term rental strategies or significant owner usage.
Idaho Springs Airbnb Minimum Stay Requirements Analysis
Distribution of Listings by Minimum Night Requirement
1 Night
42 listings
25.1% of total
2 Nights
62 listings
37.1% of total
3 Nights
6 listings
3.6% of total
7-29 Nights
9 listings
5.4% of total
30+ Nights
48 listings
28.7% of total
Key Insights
- The most prevalent minimum stay requirement in Idaho Springs is 2 Nights, adopted by 37.1% of listings. This highlights the market's preference for shorter, flexible bookings.
- A strong majority (62.2%) of the Idaho Springs Airbnb data shows acceptance of very short stays (1-2 nights), indicating a dynamic, high-turnover market.
- A significant segment (28.7%) caters to monthly stays (30+ nights) in Idaho Springs, pointing to opportunities in the extended-stay market.
Recommendations
- Align with the market by considering a 2 Nights minimum stay, as 37.1% of Idaho Springs hosts use this setting.
- If feasible, allowing 1-night stays, especially midweek or during low season, could capture last-minute bookings, as only 25.1% currently do.
- Explore offering discounts for stays of 30+ nights to attract the 28.7% of the market seeking extended stays.
- Adjust minimum nights based on seasonality – potentially shorter during low season and longer during peak demand periods in Idaho Springs.
Idaho Springs Airbnb Cancellation Policy Trends Analysis (2026)
Limited
10 listings
6% of total
Flexible
14 listings
8.4% of total
Moderate
44 listings
26.3% of total
Firm
75 listings
44.9% of total
Strict
24 listings
14.4% of total
Cancellation Policy Insights for Idaho Springs
- The prevailing Airbnb cancellation policy trend in Idaho Springs is Firm, used by 44.9% of listings.
- A majority (59.3%) of hosts in Idaho Springs utilize Firm or Strict policies, indicating a market where hosts prioritize booking security.
Recommendations for Hosts
- Consider adopting a Firm policy to align with the 44.9% market standard in Idaho Springs.
- Using a Strict policy might deter some guests, as only 14.4% of listings use it. Evaluate if potential revenue protection outweighs possible lower booking rates.
- Regularly review your cancellation policy against competitors and market demand shifts in Idaho Springs.
Idaho Springs STR Booking Lead Time Analysis (2026)
Average Booking Lead Time by Month
Booking Lead Time Insights for Idaho Springs
- The overall average booking lead time for vacation rentals in Idaho Springs is 50 days.
- Guests book furthest in advance for stays during July (average 68 days), likely coinciding with peak travel demand or local events.
- The shortest booking windows occur for stays in March (average 33 days), indicating more last-minute travel plans during this time.
- Seasonally, Summer (63 days avg.) sees the longest lead times, while Spring (41 days avg.) has the shortest, reflecting typical travel planning cycles.
Recommendations for Hosts
- Use the overall average lead time (50 days) as a baseline for your pricing and availability strategy in Idaho Springs.
- For July stays, consider implementing length-of-stay discounts or slightly higher rates for bookings made less than 68 days out to capitalize on advance planning.
- Target marketing efforts for the Summer season well in advance (at least 63 days) to capture early planners.
- Monitor your own booking lead times against these Idaho Springs averages to identify opportunities for dynamic pricing adjustments.
Popular & Essential Airbnb Amenities in Idaho Springs (2026)
Amenity Prevalence
Amenity Insights for Idaho Springs
- Essential amenities in Idaho Springs that guests expect include: Hot water, Smoke alarm, Carbon monoxide alarm, TV, Heating, Wifi, Fire extinguisher, Free parking on premises, Kitchen. Lacking these (any) could significantly impact bookings.
- Popular amenities like Coffee maker are common but not universal. Offering these can provide a competitive edge.
Recommendations for Hosts
- Ensure your listing includes all essential amenities for Idaho Springs: Hot water, Smoke alarm, Carbon monoxide alarm, TV, Heating, Wifi, Fire extinguisher, Free parking on premises, Kitchen.
- Prioritize adding missing essentials: Hot water, Smoke alarm, Carbon monoxide alarm, TV, Heating, Wifi, Fire extinguisher, Free parking on premises, Kitchen.
- Consider adding popular differentiators like Coffee maker to increase appeal.
- Highlight unique or less common amenities you offer (e.g., hot tub, dedicated workspace, EV charger) in your listing description and photos.
- Regularly check competitor amenities in Idaho Springs to stay competitive.
Idaho Springs Airbnb Guest Demographics & Profile Analysis (2026)
Guest Profile Summary for Idaho Springs
- The typical guest profile for Airbnb in Idaho Springs consists of primarily domestic travelers (97%), often arriving from nearby Denver, typically belonging to the Post-2000s (Gen Z/Alpha) group (50%), primarily speaking English or Spanish.
- Domestic travelers account for 97.3% of guests.
- Key international markets include United States (97.3%) and DC (0.6%).
- Top languages spoken are English (73.6%) followed by Spanish (14.5%).
- A significant demographic segment is the Post-2000s (Gen Z/Alpha) group, representing 50% of guests.
Recommendations for Hosts
- Target domestic marketing efforts towards travelers from Denver and Austin.
- Tailor amenities and listing descriptions to appeal to the dominant Post-2000s (Gen Z/Alpha) demographic (e.g., highlight fast WiFi, smart home features, local guides).
- Highlight unique local experiences or amenities relevant to the primary guest profile.
- Consider seasonal promotions aligned with peak travel times for key origin markets.
Nearby Short-Term Rental Market Comparison
How does the Idaho Springs Airbnb market stack up against its neighbors? Compare key performance metrics like average monthly revenue, ADR, and occupancy rates in surrounding areas to understand the broader regional STR landscape.
| Market | Active Properties | Monthly Revenue | Daily Rate | Avg. Occupancy |
|---|---|---|---|---|
| Blue River | 201 | $7,203 | $609.20 | 45% |
| Aspen | 610 | $7,095 | $992.28 | 36% |
| Snowmass | 21 | $6,247 | $701.59 | 40% |
| Aspen Park | 11 | $5,825 | $395.00 | 54% |
| Indian Hills | 11 | $5,799 | $333.03 | 54% |
| Grand County | 14 | $5,137 | $513.48 | 42% |
| Breckenridge | 3,051 | $4,995 | $544.32 | 40% |
| Crested Butte | 267 | $4,956 | $536.90 | 42% |
| Snowmass Village | 636 | $4,938 | $711.61 | 35% |
| Black Hawk | 133 | $4,884 | $328.37 | 52% |