Danbury Airbnb Market Analysis 2026: Short Term Rental Data & Vacation Rental Statistics in Connecticut, United States
Is Airbnb profitable in Danbury in 2026? Explore comprehensive Airbnb analytics for Danbury, Connecticut, United States to uncover income potential. This 2026 STR market report for Danbury, based on AirROI data from February 2025 to January 2026, reveals key trends in the niche market of 53 active listings.
Whether you're considering an Airbnb investment in Danbury, optimizing your existing vacation rental, or exploring rental arbitrage opportunities, understanding the Danbury Airbnb data is crucial. Leveraging the low regulation environment is key to maximizing your short term rental income potential. Let's dive into the specifics.
Key Danbury Airbnb Performance Metrics Overview
Monthly Airbnb Revenue Variations & Income Potential in Danbury (2026)
Understanding the monthly revenue variations for Airbnb listings in Danbury is key to maximizing your short term rental income potential. Seasonality significantly impacts earnings. Our analysis, based on data from the past 12 months, shows that the peak revenue month for STRs in Danbury is typically August, while January often presents the lowest earnings, highlighting opportunities for strategic pricing adjustments during shoulder and low seasons. Explore the typical Airbnb income in Danbury across different performance tiers:
- Best-in-class properties (Top 10%) achieve $13,014+ monthly, often utilizing dynamic pricing and superior guest experiences.
- Strong performing properties (Top 25%) earn $5,842 or more, indicating effective management and desirable locations/amenities.
- Typical properties (Median) generate around $2,595 per month, representing the average market performance.
- Entry-level properties (Bottom 25%) see earnings around $1,272, often with potential for optimization.
Average Monthly Airbnb Earnings Trend in Danbury
Danbury Airbnb Occupancy Rate Trends (2026)
Maximize your bookings by understanding the Danbury STR occupancy trends. Seasonal demand shifts significantly influence how often properties are booked. Typically, Julysees the highest demand (peak season occupancy), while January experiences the lowest (low season). Effective strategies, like adjusting minimum stays or offering promotions, can boost occupancy during slower periods. Here's how different property tiers perform in Danbury:
- Best-in-class properties (Top 10%) achieve 82%+ occupancy, indicating high desirability and potentially optimized availability.
- Strong performing properties (Top 25%) maintain 64% or higher occupancy, suggesting good market fit and guest satisfaction.
- Typical properties (Median) have an occupancy rate around 45%.
- Entry-level properties (Bottom 25%) average 23% occupancy, potentially facing higher vacancy.
Average Monthly Occupancy Rate Trend in Danbury
Average Daily Rate (ADR) Airbnb Trends in Danbury (2026)
Effective short term rental pricing strategy in Danbury involves understanding monthly ADR fluctuations. The Average Daily Rate (ADR) for Airbnb in Danbury typically peaks in September and dips lowest during February. Leveraging Airbnb dynamic pricing tools or strategies based on this seasonality can significantly boost revenue. Here's a look at the typical nightly rates achieved:
- Best-in-class properties (Top 10%) command rates of $741+ per night, often due to premium features or locations.
- Strong performing properties (Top 25%) achieve nightly rates of $418 or more.
- Typical properties (Median) charge around $192 per night.
- Entry-level properties (Bottom 25%) earn around $88 per night.
Average Daily Rate (ADR) Trend by Month in Danbury
Get Live Danbury Market Intelligence 👇

Explore Real-time Analytics
Airbnb Seasonality Analysis & Trends in Danbury (2026)
Peak Season (August, July, September)
- Revenue averages $7,276 per month
- Occupancy rates average 51.0%
- Daily rates average $325
Shoulder Season
- Revenue averages $4,860 per month
- Occupancy maintains around 44.8%
- Daily rates hold near $310
Low Season (January, February, March)
- Revenue drops to average $3,031 per month
- Occupancy decreases to average 42.1%
- Daily rates adjust to average $291
Seasonality Insights for Danbury
- The Airbnb seasonality in Danbury shows highly seasonal trends requiring careful strategy. While the sections above show seasonal averages, it's also insightful to look at the extremes:
- During the high season, the absolute peak month showcases Danbury's highest earning potential, with monthly revenues capable of climbing to $8,153, occupancy reaching a high of 53.3%, and ADRs peaking at $332.
- Conversely, the slowest single month of the year, typically falling within the low season, marks the market's lowest point. In this month, revenue might dip to $2,510, occupancy could drop to 31.6%, and ADRs may adjust down to $275.
- Understanding both the seasonal averages and these monthly peaks and troughs in revenue, occupancy, and ADR is crucial for maximizing your Airbnb profit potential in Danbury.
Seasonal Strategies for Maximizing Profit
- Peak Season: Maximize revenue through premium pricing and potentially longer minimum stays. Ensure high availability.
- Low Season: Offer competitive pricing, special promotions (e.g., extended stay discounts), and flexible cancellation policies. Target off-season travelers like remote workers or budget-conscious guests.
- Shoulder Seasons: Implement dynamic pricing that balances peak and low rates. Target weekend travelers or specific events. Offer slightly more flexible terms than peak season.
- Regularly analyze your own performance against these Danbury seasonality benchmarks and adjust your pricing and availability strategy accordingly.
Best Areas for Airbnb Investment in Danbury (2026)
Exploring the top neighborhoods for short-term rentals in Danbury? This section highlights key areas, outlining why they are attractive for hosts and guests, along with notable local attractions. Consider these locations based on your target guest profile and investment strategy.
| Neighborhood / Area | Why Host Here? (Target Guests & Appeal) | Key Attractions & Landmarks |
|---|---|---|
| Downtown Danbury | The heart of the city, Downtown Danbury is bustling with restaurants, shops, and cultural events. Its location provides easy access to local attractions and is appealing for both business travelers and tourists. | Danbury Museum & Historical Society, Danbury Fair Mall, O'Neill Center, Ives Concert Park, CityCenter Danbury |
| Danbury City Center | Perfect for visitors looking for urban convenience, the City Center has a mix of living, dining, and shopping options. It's a hub for events and activities throughout the year. | Danbury Railway Museum, Ridgewood Country Club, Danbury Public Library, Danbury Ice Arena, Brookfield Zoo |
| Lake Kenosia | A serene, picturesque area that offers outdoor recreational activities and beautiful lake views. Ideal for vacationers seeking a nature retreat close to the city. | Lake Kenosia Park, Tarrywile Park, Hubbard Park, Danbury Yacht Club, Scenic walking trails |
| Newtown | A charming, historic town just a short drive from Danbury, Newtown attracts families and those looking for a quieter, suburban atmosphere with historical significance. | Newtown Historical Society, Candlewood Lake, Lake Lillinonah, Towns of Newtown Shopping District, High Meadow Farm |
| New Milford | Nearby New Milford offers a picturesque New England charm, appealing to guests looking for a quaint town experience with a mix of shops and nature activities. | Harrybrooke Park, New Milford Historical Society, Lovers Leap State Park, The Downtown Green, Farmers Market |
| Bethel | A vibrant small town close to Danbury known for its cultural offerings and local festivals, making it suitable for visitors looking to explore local traditions and community events. | Bethel Municipal Stadium, Bethel Historical Society, Kelley’s Apple Farm, Bethel Village Square, Arts and Crafts Festivals |
| Danbury Fair Mall | A major shopping destination featuring a wide variety of stores and entertainment options. Ideal for shoppers and families wanting a fun day out. | Danbury Fair Mall, Bow Tie Cinemas, Restaurants and cafes, Play areas for kids, Seasonal events and fairs |
| Tarrywile Park | This large park offers extensive walking trails and beautiful landscapes, appealing to nature lovers and those looking for an outdoor getaway within the city limits. | Tarrywile Park and Mansion, Hiking and walking trails, Picnic areas, Bird watching spots, Scenic views of Danbury |
Understanding Airbnb License Requirements & STR Laws in Danbury (2026)
While Danbury, Connecticut, United States currently shows low STR regulations, specific Airbnb license requirements might still exist or change. Always verify the latest short term rental regulations and Airbnb license requirements directly with local government authorities for Danbury to ensure full compliance before hosting.
(Source: AirROI data, 2026, finding no licensed listings among those analyzed)
Top Performing Airbnb Properties in Danbury (2026)
Benchmark your potential! Explore examples of top-performing Airbnb properties in Danburybased on Trailing Twelve Month (TTM) revenue. Analyze their characteristics, revenue, occupancy rate, and ADR to understand what drives success in this market.
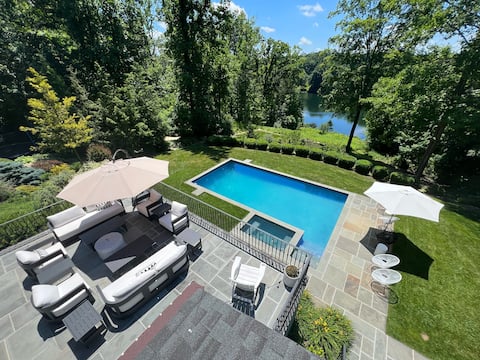
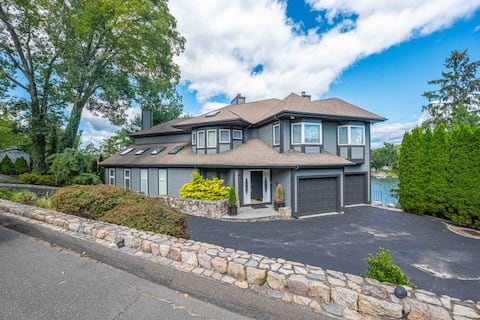
Lakeside Luxury • Hot Tub, Pool & Chef Kitchen
Entire Place • 5 bedrooms
Waterfront Home on Candlewood Lake!
Entire Place • 5 bedrooms

Lake Front Luxury
Entire Place • 4 bedrooms

Candlewood Lake - Lakefront Family Getaway 3775sqf
Entire Place • 4 bedrooms

Lakeview Estate - Chef's Kitchen - NYC Getaway
Entire Place • 3 bedrooms

BEAUTIFUL LUXURIOUS DANBURY ESTATE!!
Entire Place • 4 bedrooms
Note: Performance varies based on location, size, amenities, seasonality, and management quality. Data reflects the past 12 months.
Top Performing Airbnb Hosts in Danbury (2026)
Learn from the best! This table showcases top-performing Airbnb hosts in Danbury based on the number of properties managed and estimated total revenue over the past year. Analyze their scale and performance metrics.
| Host Name | Properties | Grossing Revenue | Stay Reviews | Avg Rating |
|---|---|---|---|---|
| Lloyd | 1 | $365,143 | 122 | 4.95/5.0 |
| Yasmina | 2 | $256,728 | 98 | 4.77/5.0 |
| Joel | 8 | $200,909 | 465 | 4.93/5.0 |
| Gianna | 1 | $147,739 | 58 | 4.93/5.0 |
| Tracey | 2 | $123,241 | 444 | 4.96/5.0 |
| Peter & Matt | 1 | $114,458 | 50 | 5.00/5.0 |
| Nicholas | 1 | $100,252 | 119 | 4.96/5.0 |
| Ray | 3 | $99,342 | 20 | 4.58/5.0 |
| Stephen | 1 | $86,767 | 24 | 5.00/5.0 |
| Ashley | 2 | $76,010 | 13 | 4.83/5.0 |
Analyzing the strategies of top hosts, such as their property selection, pricing, and guest communication, can offer valuable lessons for optimizing your own Airbnb operations in Danbury.
Dive Deeper: Advanced Danbury STR Market Data (2026)
Ready to unlock more insights? AirROI provides access to advanced metrics and comprehensive Airbnb data for Danbury. Explore detailed analytics beyond this report to refine your investment strategy, optimize pricing, and maximize your vacation rental profits.
Explore Advanced MetricsDanbury Short-Term Rental Market Composition (2026): Property & Room Types
Room Type Distribution
Property Type Distribution
Market Composition Insights for Danbury
- The Danbury Airbnb market composition is heavily skewed towards Entire Home/Apt listings, which make up 69.8% of the 53 active rentals. This indicates strong guest preference for privacy and space.
- However, a notable 30.2% share for Private Rooms suggests opportunities for budget-conscious travelers or hosts renting out spare rooms.
- Looking at the property type distribution in Danbury, House properties are the most common (64.2%), reflecting the local real estate landscape.
- Houses represent a significant 64.2% portion, catering likely to families or larger groups.
- Smaller segments like unique stays (combined 1.9%) offer potential for unique stay experiences.
Danbury Airbnb Room Capacity Analysis (2026): Bedroom Distribution
Distribution of Listings by Number of Bedrooms
Room Capacity Insights for Danbury
- The dominant room capacity in Danbury is 1 bedroom listings, making up 24.5% of the market. This suggests a strong demand for properties suitable for couples or solo travelers.
- Together, 1 bedroom and 4 bedrooms properties represent 47.1% of the active Airbnb listings in Danbury, indicating a high concentration in these sizes.
- A significant 39.6% of listings offer 3+ bedrooms, catering to larger groups and families seeking more space in Danbury.
Danbury Vacation Rental Guest Capacity Trends (2026)
Distribution of Listings by Guest Capacity
Guest Capacity Insights for Danbury
- The most common guest capacity trend in Danbury vacation rentals is listings accommodating 8+ guests (30.2%). This suggests the primary traveler segment is likely larger groups.
- Properties designed for 8+ guests and 2 guests dominate the Danbury STR market, accounting for 45.3% of listings.
- 37.8% of properties accommodate 6+ guests, serving the market segment for larger families or group travel in Danbury.
- On average, properties in Danbury are equipped to host 3.9 guests.
Danbury Airbnb Booking Patterns (2026): Available vs. Booked Days
Available Days Distribution
Booked Days Distribution
Booking Pattern Insights for Danbury
- The most common availability pattern in Danbury falls within the 271-366 days range, representing 49.1% of listings. This suggests many properties have significant open periods on their calendars.
- Approximately 73.6% of listings show high availability (181+ days open annually), indicating potential for increased bookings or specific owner usage patterns.
- For booked days, the 91-180 days range is most frequent in Danbury (30.2%), reflecting common guest stay durations or potential owner blocking patterns.
- A notable 26.4% of properties secure long booking periods (181+ days booked per year), highlighting successful long-term rental strategies or significant owner usage.
Danbury Airbnb Minimum Stay Requirements Analysis
Distribution of Listings by Minimum Night Requirement
1 Night
14 listings
26.4% of total
2 Nights
15 listings
28.3% of total
3 Nights
1 listings
1.9% of total
4-6 Nights
7 listings
13.2% of total
7-29 Nights
5 listings
9.4% of total
30+ Nights
11 listings
20.8% of total
Key Insights
- The most prevalent minimum stay requirement in Danbury is 2 Nights, adopted by 28.3% of listings. This highlights the market's preference for shorter, flexible bookings.
- A significant segment (20.8%) caters to monthly stays (30+ nights) in Danbury, pointing to opportunities in the extended-stay market.
Recommendations
- Align with the market by considering a 2 Nights minimum stay, as 28.3% of Danbury hosts use this setting.
- If feasible, allowing 1-night stays, especially midweek or during low season, could capture last-minute bookings, as only 26.4% currently do.
- Explore offering discounts for stays of 30+ nights to attract the 20.8% of the market seeking extended stays.
- Adjust minimum nights based on seasonality – potentially shorter during low season and longer during peak demand periods in Danbury.
Danbury Airbnb Cancellation Policy Trends Analysis (2026)
Limited
2 listings
3.8% of total
Flexible
11 listings
20.8% of total
Moderate
15 listings
28.3% of total
Firm
20 listings
37.7% of total
Strict
5 listings
9.4% of total
Cancellation Policy Insights for Danbury
- The prevailing Airbnb cancellation policy trend in Danbury is Firm, used by 37.7% of listings.
- There's a relatively balanced mix between guest-friendly (49.1%) and stricter (47.1%) policies, offering choices for different guest needs.
- Strict cancellation policies are quite rare (9.4%), potentially making listings with this policy less competitive unless justified by high demand or property type.
Recommendations for Hosts
- Consider adopting a Firm policy to align with the 37.7% market standard in Danbury.
- Using a Strict policy might deter some guests, as only 9.4% of listings use it. Evaluate if potential revenue protection outweighs possible lower booking rates.
- Regularly review your cancellation policy against competitors and market demand shifts in Danbury.
Danbury STR Booking Lead Time Analysis (2026)
Average Booking Lead Time by Month
Booking Lead Time Insights for Danbury
- The overall average booking lead time for vacation rentals in Danbury is 37 days.
- Guests book furthest in advance for stays during August (average 61 days), likely coinciding with peak travel demand or local events.
- The shortest booking windows occur for stays in January (average 14 days), indicating more last-minute travel plans during this time.
- Seasonally, Summer (54 days avg.) sees the longest lead times, while Winter (29 days avg.) has the shortest, reflecting typical travel planning cycles.
Recommendations for Hosts
- Use the overall average lead time (37 days) as a baseline for your pricing and availability strategy in Danbury.
- For August stays, consider implementing length-of-stay discounts or slightly higher rates for bookings made less than 61 days out to capitalize on advance planning.
- During January, focus on last-minute booking availability and promotions, as guests book with very short notice (14 days avg.).
- Target marketing efforts for the Summer season well in advance (at least 54 days) to capture early planners.
- Monitor your own booking lead times against these Danbury averages to identify opportunities for dynamic pricing adjustments.
Popular & Essential Airbnb Amenities in Danbury (2026)
Amenity Prevalence
Amenity Insights for Danbury
- Essential amenities in Danbury that guests expect include: Heating, Wifi, Smoke alarm, TV. Lacking these (any) could significantly impact bookings.
- Popular amenities like Hot water, Hangers, Free parking on premises are common but not universal. Offering these can provide a competitive edge.
Recommendations for Hosts
- Ensure your listing includes all essential amenities for Danbury: Heating, Wifi, Smoke alarm, TV.
- Prioritize adding missing essentials: Wifi, Smoke alarm, TV.
- Consider adding popular differentiators like Hot water or Hangers to increase appeal.
- Highlight unique or less common amenities you offer (e.g., hot tub, dedicated workspace, EV charger) in your listing description and photos.
- Regularly check competitor amenities in Danbury to stay competitive.
Danbury Airbnb Guest Demographics & Profile Analysis (2026)
Guest Profile Summary for Danbury
- The typical guest profile for Airbnb in Danbury consists of primarily domestic travelers (91%), often arriving from nearby New York, typically belonging to the Post-2000s (Gen Z/Alpha) group (50%), primarily speaking English or Spanish.
- Domestic travelers account for 90.8% of guests.
- Key international markets include United States (90.8%) and Canada (1.7%).
- Top languages spoken are English (67.4%) followed by Spanish (17.1%).
- A significant demographic segment is the Post-2000s (Gen Z/Alpha) group, representing 50% of guests.
Recommendations for Hosts
- Target domestic marketing efforts towards travelers from New York and Stamford.
- Tailor amenities and listing descriptions to appeal to the dominant Post-2000s (Gen Z/Alpha) demographic (e.g., highlight fast WiFi, smart home features, local guides).
- Highlight unique local experiences or amenities relevant to the primary guest profile.
- Consider seasonal promotions aligned with peak travel times for key origin markets.
Nearby Short-Term Rental Market Comparison
How does the Danbury Airbnb market stack up against its neighbors? Compare key performance metrics like average monthly revenue, ADR, and occupancy rates in surrounding areas to understand the broader regional STR landscape.
| Market | Active Properties | Monthly Revenue | Daily Rate | Avg. Occupancy |
|---|---|---|---|---|
| Town of Kingston | 10 | $6,470 | $473.76 | 49% |
| Frankford Township | 11 | $6,329 | $505.19 | 41% |
| Sag Harbor | 15 | $6,129 | $1280.84 | 40% |
| Town of East Hampton | 1,327 | $5,945 | $986.02 | 36% |
| Spring Lake Heights | 16 | $5,785 | $725.20 | 40% |
| Town of Monroe | 22 | $5,690 | $720.52 | 37% |
| Town of Southampton | 1,201 | $5,620 | $1002.45 | 33% |
| Town of Ancram | 22 | $5,616 | $512.55 | 38% |
| Southampton | 19 | $5,405 | $1456.43 | 30% |
| Neptune City | 12 | $5,299 | $531.14 | 45% |