Washington, District of Columbia Airbnb Market Data 2026: STR Report & Statistics
How much can you earn on Airbnb in Washington, District of Columbia? Based on AirROI's 2026 dataset (May 2025 – April 2026), the short answer is $30,710 per year — at a $232 nightly rate, 45.7% occupancy, and a $107 RevPAR that reflects moderate rate-to-revenue efficiency with room to optimize.
Washington's 4,352 active listings and moderate demand with room for well-positioned listings to outperform make it a major short-term rental market. Supply grew 55.5% and nightly rates have risen, creating an environment where the most bookable listings stand to capture outsized share. Hosts who pair competitive pricing with strong guest experience are well-positioned to convert the growing traveler base into consistent bookings.
Regulation is high and 83% of listings show active registration — compliance is the cost of entry. For data-driven hosts, the opportunity lies in reading these signals and positioning accordingly.

Table of Contents [hide] [show]
What Are the Key Airbnb Metrics in Washington?
In Washington, the headline Airbnb metrics are $30,710 in average annual revenue,45.7% occupancy, $232 ADR, and $107 in RevPAR, and guests book about 41 days in advance.
How Much Do Airbnb Hosts Earn Monthly in Washington?
Understanding the monthly revenue variations for Airbnb listings in Washington is key to maximizing your short term rental income potential. Seasonality significantly impacts earnings. Our analysis, based on data from the past 12 months, shows that the peak revenue month for STRs in Washington is typically June, while February often presents the lowest earnings, highlighting opportunities for strategic pricing adjustments during shoulder and low seasons. Explore the typical Airbnb income in Washington across different performance tiers:
- Best-in-class properties (Top 10%) achieve $7,320+ monthly, often utilizing dynamic pricing and superior guest experiences.
- Strong performing properties (Top 25%) earn $4,590 or more, indicating effective management and desirable locations/amenities.
- Typical properties (Median) generate around $2,713 per month, representing the average market performance.
- Entry-level properties (Bottom 25%) see earnings around $1,335, often with potential for optimization.
Average Monthly Airbnb Earnings Trend in Washington
What Is the Monthly Airbnb Occupancy Rate in Washington?
Maximize your bookings by understanding the Washington STR occupancy trends. Seasonal demand shifts significantly influence how often properties are booked. Typically, Junesees the highest demand (peak season occupancy), while January experiences the lowest (low season). Effective strategies, like adjusting minimum stays or offering promotions, can boost occupancy during slower periods. Here's how different property tiers perform in Washington:
- Best-in-class properties (Top 10%) achieve 84%+ occupancy, indicating high desirability and potentially optimized availability.
- Strong performing properties (Top 25%) maintain 71% or higher occupancy, suggesting good market fit and guest satisfaction.
- Typical properties (Median) have an occupancy rate around 49%.
- Entry-level properties (Bottom 25%) average 25% occupancy, potentially facing higher vacancy.
Average Monthly Occupancy Rate Trend in Washington
What Is the Average Airbnb Nightly Rate in Washington?
Effective short term rental pricing strategy in Washington involves understanding monthly ADR fluctuations. The Average Daily Rate (ADR) for Airbnb in Washington typically peaks in April and dips lowest during February. Leveraging Airbnb dynamic pricing tools or strategies based on this seasonality can significantly boost revenue. Here's a look at the typical nightly rates achieved:
- Best-in-class properties (Top 10%) command rates of $421+ per night, often due to premium features or locations.
- Strong performing properties (Top 25%) achieve nightly rates of $271 or more.
- Typical properties (Median) charge around $173 per night.
- Entry-level properties (Bottom 25%) earn around $118 per night.
Average Daily Rate (ADR) Trend by Month in Washington
What Is the RevPAR for Airbnb in Washington?
RevPAR in Washington is currently $107. Because RevPAR combines nightly rates with realized occupancy, it is one of the cleanest ways to compare how efficiently listings turn demand into revenue across the market.
- Entry-level properties (Bottom 25%) see $48 RevPAR.
- Typical properties (Median) generate $83 RevPAR.
- Strong performers (Top 25%) earn $131 RevPAR.
- Best-in-class (Top 10%) achieve $210 RevPAR.
Average Monthly RevPAR Trend in Washington
RevPAR Insights for Washington
- The average RevPAR in Washington is $107. This metric combines nightly rates with realized occupancy, making it one of the best single-number indicators of market efficiency.
- The gap between the top 10% ($210) and bottom 25% ($48) is $162, indicating significant performance disparity driven by property quality, pricing strategy, and location.
- RevPAR peaks in Jun and bottoms out in Jan, mirroring the broader seasonal demand pattern and suggesting opportunities for dynamic pricing.
Recommendations for Hosts
- Track your own RevPAR monthly against these Washington benchmarks. If your RevPAR falls below the median of $83, examine whether low occupancy or low ADR is the primary drag.
- Top-quartile listings achieve $131+ RevPAR through a combination of competitive pricing, strong reviews, and strategic amenities. Target this tier through incremental improvements.
- Use RevPAR rather than revenue alone when comparing properties of different sizes — it normalizes for available nights and gives a more accurate picture of performance.
Get Live Washington Market Intelligence 👇
Explore Real-time Analytics
When Is the Peak Season for Airbnb in Washington?
Washington's peak Airbnb season falls in June, May, October, while the softest stretch is January, February, December. Overall, the market shows moderate seasonality with distinct peak and low periods, which should guide pricing, minimum stays, and cash-flow planning.
Peak Season (June, May, October)
- Revenue averages $4,409 per month
- Occupancy rates average 56.2%
- Daily rates average $238
Shoulder Season
- Revenue averages $3,619 per month
- Occupancy maintains around 48.9%
- Daily rates hold near $230
Low Season (January, February, December)
- Revenue drops to average $2,563 per month
- Occupancy decreases to average 38.6%
- Daily rates adjust to average $214
Seasonality Insights for Washington
- The Airbnb seasonality pattern in Washington shows moderate seasonality with distinct peak and low periods. While the sections above show seasonal averages, it is also insightful to look at the extremes:
- During the high season, the absolute peak month showcases Washington's highest earning potential, with monthly revenues climbing to $4,627, occupancy reaching 58.9%, and ADRs peaking at $251.
- Conversely, the slowest single month marks the market's lowest point — revenue may dip to $2,323, occupancy could drop to 36.1%, and ADRs may adjust to $211.
- Understanding both the seasonal averages and these monthly peaks and troughs in revenue, occupancy, and ADR is crucial for maximizing your Airbnb profit potential in Washington.
Seasonal Strategies for Maximizing Profit
- Peak Season: Maximize revenue through premium pricing. In a high-regulation market like Washington, ensure your permit covers the number of nights you plan to book — some jurisdictions cap annual rental days.
- Low Season: Offer competitive pricing, extended-stay discounts, and flexible cancellation policies. Target off-season travelers like remote workers, budget-conscious guests, and travelers with flexible schedules.
- Shoulder Seasons: Implement dynamic pricing that bridges peak and low rates. Target weekend travelers, local events, and business visitors. Slightly more flexible terms than peak season can help maintain occupancy without deep discounting.
- Regularly analyze your own performance against these Washington seasonality benchmarks and adjust your pricing and availability strategy accordingly.
Do You Need a License for Airbnb in Washington?
Yes, Washington, District of Columbia, United States enforces high STR regulations and 83% of active listings show registration evidence — indicating that enforcement is active and compliance is a prerequisite for operating legally. Hosts entering this market should budget for permit fees, inspections, and potential occupancy tax obligations as part of their startup costs. Always verify the latest short-term rental regulations and Airbnb license requirements directly with local government authorities for Washington to ensure full compliance before hosting.
(Source: AirROI data, 2026, based on 83% licensed listings)
What Are the Best Neighborhoods for Airbnb in Washington?
In a large, heavily regulated market like Washington, neighborhood selection is one of the strongest levers for Airbnb investment performance. Zoning rules, permitting availability, and guest demand patterns can vary block by block. The 8 neighborhoods below represent areas where short-term rental activity concentrates — understanding why each one attracts guests and hosts helps investors evaluate where their property type and budget fit best.
| Neighborhood / Area | Why Host Here? (Target Guests & Appeal) | Key Attractions & Landmarks |
|---|---|---|
| Adams Morgan | Vibrant neighborhood known for its eclectic culture, diverse dining options, and nightlife. Popular with young travelers and locals seeking a lively atmosphere. | Adams Morgan Historic District, The Line Hotel, Banneker Recreation Center, Live music venues, Diverse restaurants and cafes |
| Georgetown | Historic waterfront area with charming streets, boutique shopping, and prestigious university. Attracts tourists for its picturesque views and rich history. | Georgetown Waterfront Park, C&O Canal, Dumbarton Oaks, Historic homes and mansions, Shopping on Wisconsin Avenue |
| Capitol Hill | Residential neighborhood with easy access to the U.S. Capitol and other government buildings. Ideal for business travelers and those interested in American politics. | U.S. Capitol, Library of Congress, Supreme Court, Eastern Market, Historic row houses |
| Dupont Circle | Trendy and artsy neighborhood with a mix of historic architecture, parks, and embassies. Popular among tourists for its vibrant atmosphere and cultural attractions. | Dupont Circle Park, The Phillips Collection, Bookstores and cafes, Embassy Row, Farmers' Market |
| Logan Circle | Historic district known for its Victorian houses and beautiful park. Great for families and those looking for a quieter, residential feel while still being close to downtown. | Logan Circle Park, Historic row houses, Boutique shops and restaurants, Local art galleries, Community events |
| Shaw | Diverse neighborhood with a rich African American history and burgeoning dining scene. Attracts a trendy crowd looking for food and cultural experiences. | Howard Theatre, Shaw’s Tavern, Naylor Court, Atlas Performing Arts Center, Growing food scene |
| The Wharf | New waterfront development with dining, shopping, and entertainment options. Ideal for tourists looking for modern amenities along the Potomac River. | The Anthem, Waterfront Park, Dining with river views, Fishing pier, Live music events |
| National Mall | Iconic area housing the nation's monuments and museums. Perfect for visitors who want easy access to America's history and culture. | Lincoln Memorial, Smithsonian Museums, Washington Monument, Tidal Basin, National World War II Memorial |
Because Washington has a high regulation profile, confirming that short-term rental permits are available in your target neighborhood is a critical first step before committing to a property purchase. Regulation can vary at the neighborhood or district level even within the same city.
What Types of Properties Are on Airbnb in Washington?
Room Type Distribution
Property Type Distribution
Market Composition Insights for Washington
- The Washington Airbnb market composition is heavily skewed towards Entire Home/Apt listings, which make up 84.1% of the 4,352 active rentals. This indicates strong guest preference for privacy and space.
- Looking at the property type distribution in Washington, Apartment/Condo properties are the most common (51.2%), reflecting the local real estate landscape.
- Houses represent a significant 37.2% portion, catering likely to families or larger groups.
- Smaller segments like hotel/boutique (combined 4.2%) offer potential for unique stay experiences.
Washington Airbnb Room Capacity Analysis (2026): Bedroom Distribution
Distribution of Listings by Number of Bedrooms
Room Capacity Insights for Washington
- The dominant room capacity in Washington is 1 bedroom listings, making up 39.8% of the market. This suggests a strong demand for properties suitable for couples or solo travelers.
- Together, 1 bedroom and 2 bedrooms properties represent 63.6% of the active Airbnb listings in Washington, indicating a high concentration in these sizes.
Washington Vacation Rental Guest Capacity Trends (2026)
Distribution of Listings by Guest Capacity
Guest Capacity Insights for Washington
- The most common guest capacity trend in Washington vacation rentals is listings accommodating 4 guests (24.3%). This suggests the primary traveler segment is likely small families or groups.
- Properties designed for 4 guests and 2 guests dominate the Washington STR market, accounting for 45.3% of listings.
- 23.6% of properties accommodate 6+ guests, serving the market segment for larger families or group travel in Washington.
- On average, properties in Washington are equipped to host 3.7 guests.
How Do Listings in Washington Compare on Quality?
Listing quality in Washington can be approximated through presentation depth, bedroom count, and how often hosts disclose exact locations. These signals show how professionally the local supply base is merchandised.
Listing Quality Insights for Washington
- At 24.9 photos per listing on average, Washington hosts invest well in visual presentation. Listings with 20+ photos consistently outperform in search ranking and conversion.
- 25.7% of listings show their exact location. Lower disclosure rates can increase booking hesitation — guests want to know exactly where they are staying.
Recommendations for Hosts
- Enable exact location if possible — it removes a common source of guest uncertainty and can improve your listing's position in map-based searches.
- Use these quality indicators as a self-audit checklist. Listings that exceed the Washington averages across all three metrics are better positioned for premium pricing.
What Amenities Do Airbnb Guests Expect in Washington?
Amenity Prevalence
Amenity Insights for Washington
- Essential amenities in Washington that guests expect include: Wifi, Air conditioning, Heating, Smoke alarm. Lacking these (any) could significantly impact bookings.
- Popular amenities like Hot water, TV, Carbon monoxide alarm are common but not universal. Offering these can provide a competitive edge.
Recommendations for Hosts
- Ensure your listing includes all essential amenities for Washington: Wifi, Air conditioning, Heating, Smoke alarm.
- Prioritize adding missing essentials: Wifi, Air conditioning, Heating, Smoke alarm.
- Consider adding popular differentiators like Hot water or TV to increase appeal.
- Highlight unique or less common amenities you offer (e.g., hot tub, dedicated workspace, EV charger) in your listing description and photos.
- Regularly check competitor amenities in Washington to stay competitive.
Which Airbnb Amenities Boost Revenue in Washington?
Not every amenity matters equally. This table focuses on the amenities most associated with higher revenue in Washington, which makes it more useful for prioritizing upgrades than a simple popularity list alone.
| Amenity | Prevalence | Revenue With | Revenue Without | Revenue Uplift |
|---|---|---|---|---|
Bowling alleyHigh opportunity | 0.1% | $84,346 | $30,648 | 175.2% |
TV | 93.1% | $32,006 | $13,199 | 142.5% |
Coffee maker | 85.5% | $33,390 | $14,936 | 123.6% |
Hair dryer | 86.2% | $33,238 | $14,932 | 122.6% |
Children's playroomHigh opportunity | 0.8% | $67,512 | $30,403 | 122.1% |
Baby monitorHigh opportunity | 1.0% | $67,098 | $30,347 | 121.1% |
Theme roomHigh opportunity | 0.9% | $61,907 | $30,442 | 103.4% |
Dishes and silverware | 86.4% | $32,978 | $16,331 | 101.9% |
Smoke alarm | 98.6% | $30,918 | $16,050 | 92.6% |
Refrigerator | 86.5% | $32,819 | $17,234 | 90.4% |
Revenue Impact Insights for Washington
- Bowling alley tops the revenue impact list with a 175.2% uplift — listings with this amenity earn $84,346 vs. $30,648 without it.
- High-opportunity amenities — Bowling alley, Children's playroom, Baby monitor — combine revenue uplift above 100% with prevalence under 10%, meaning most competitors haven't adopted them yet.
- TV, Coffee maker, Hair dryer, Dishes and silverware, Smoke alarm, Refrigerator — while widespread — still correlate with meaningful revenue gains, making them table stakes rather than true differentiators.
Recommendations for Hosts
- Prioritize adding Bowling alley — it has the best combination of high revenue impact and low market saturation in Washington.
- Focus your upgrade budget on amenities in the top half of this table. Below-median amenities may improve guest experience but contribute less to revenue growth.
- Highlight revenue-impacting amenities prominently in your listing title, photos, and description — guests can't value what they don't notice.
Dive Deeper: Advanced Washington STR Market Data (2026)
Ready to unlock more insights? AirROI provides access to advanced metrics and comprehensive Airbnb data for Washington. Explore detailed analytics beyond this report to refine your investment strategy, optimize pricing, and maximize your vacation rental profits.
Explore Advanced MetricsWashington Airbnb Guest Demographics & Profile Analysis (2026)
Guest Profile Summary for Washington
- The typical guest profile for Airbnb in Washington consists of primarily domestic travelers (84%), often arriving from nearby New York, typically belonging to the Post-2000s (Gen Z/Alpha) group (50%), primarily speaking English or Spanish.
- Domestic travelers account for 83.5% of guests.
- Key international markets include United States (83.5%) and DC (4.1%).
- Top languages spoken are English (59.8%) followed by Spanish (14.6%).
- A significant demographic segment is the Post-2000s (Gen Z/Alpha) group, representing 50% of guests.
Recommendations for Hosts
- Target domestic marketing efforts towards travelers from New York and Washington.
- Tailor amenities and listing descriptions to appeal to the dominant Post-2000s (Gen Z/Alpha) demographic (e.g., highlight fast WiFi, smart home features, local guides).
- Highlight unique local experiences or amenities relevant to the primary guest profile.
- Consider seasonal promotions aligned with peak travel times for key origin markets.
What Are Airbnb Guest Ratings in Washington?
Listings in Washington average 4.78 out of 5 overall, with about 106.2 reviews per active listing and 38.5% of listings carrying the Guest Favorite badge.
Rating Breakdown by Category
Guest Rating Insights for Washington
- An average rating of 4.78 places Washington in solid territory. Most guests leave satisfied, though there is room for hosts to push toward the top tier.
- The strongest subcategory is Communication (4.88), while Value (4.71) trails behind — a useful signal for hosts looking to prioritize upgrades.
- 38.5% of listings carry the Guest Favorite badge, a strong trust signal that can meaningfully lift click-through and booking rates.
Recommendations for Hosts
- Focus improvement efforts on Value — even small gains in the weakest subcategory can lift overall ratings and search ranking.
- Encourage guests to leave reviews after checkout. Listings with more reviews rank higher in search results and convert browsers into bookers more effectively.
Washington Airbnb Booking Patterns (2026): Available vs. Booked Days
Available Days Distribution
Booked Days Distribution
Booking Pattern Insights for Washington
- The most common availability pattern in Washington falls within the 271-366 days range, representing 41% of listings. This suggests many properties have significant open periods on their calendars.
- Approximately 70.4% of listings show high availability (181+ days open annually), indicating potential for increased bookings or specific owner usage patterns.
- For booked days, the 91-180 days range is most frequent in Washington (30.1%), reflecting common guest stay durations or potential owner blocking patterns.
- A notable 31.0% of properties secure long booking periods (181+ days booked per year), highlighting successful long-term rental strategies or significant owner usage.
How Far in Advance Do Guests Book Airbnb in Washington?
Average Booking Lead Time by Month
Booking Lead Time Insights for Washington
- The overall average booking lead time for vacation rentals in Washington is 41 days.
- Guests book furthest in advance for stays during June (average 55 days), likely coinciding with peak travel demand or local events.
- The shortest booking windows occur for stays in February (average 27 days), indicating more last-minute travel plans during this time.
- Seasonally, Summer (46 days avg.) sees the longest lead times, while Winter (30 days avg.) has the shortest, reflecting typical travel planning cycles.
Recommendations for Hosts
- Use the overall average lead time (41 days) as a baseline for your pricing and availability strategy in Washington.
- For June stays, consider implementing length-of-stay discounts or slightly higher rates for bookings made less than 55 days out to capitalize on advance planning.
- Target marketing efforts for the Summer season well in advance (at least 46 days) to capture early planners.
- Monitor your own booking lead times against these Washington averages to identify opportunities for dynamic pricing adjustments.
What Is the Average Length of Stay for Airbnb in Washington?
Guests in Washington stay about 7.4 nights on average, generating roughly 117,608 reservations and 27.2 bookings per listing in the latest AirROI dataset. The most common check-in time is 4:00 PM and check-out is 11:00 AM.
Monthly Length of Stay in Washington
Check-in Time Distribution
Check-out Time Distribution
Stay Pattern Insights for Washington
- Longer stays mean fewer turnovers and lower cleaning costs per revenue dollar. This pattern also opens the door to monthly discount strategies that attract remote workers and extended-stay travelers.
- At 27.2 bookings per listing, the turnover rate is high. Hosts with streamlined operations (self-check-in, automated messaging, reliable cleaners) have a structural advantage.
- Stay lengths peak in Jun (6.3 nights) and shorten in Mar (4 nights). Adjust minimum-night requirements seasonally to match.
Recommendations for Hosts
- Leverage the longer-stay pattern by offering weekly discounts — even 5-10% off can convert browsing into bookings for guests considering an extended stay.
- Set your check-in time to match or beat the market standard of 4:00 PM. Offering early check-in flexibility can be a low-cost differentiator.
- Monitor length-of-stay seasonality to adjust minimum-night requirements — longer minimums during peak periods maximize revenue while shorter minimums fill gaps in shoulder seasons.
Washington Airbnb Minimum Stay Requirements Analysis
Distribution of Listings by Minimum Night Requirement
1 Night
856 listings
19.7% of total
2 Nights
943 listings
21.7% of total
3 Nights
296 listings
6.8% of total
4-6 Nights
147 listings
3.4% of total
7-29 Nights
202 listings
4.6% of total
30+ Nights
1908 listings
43.8% of total
Key Insights
- The most prevalent minimum stay requirement in Washington is 30+ Nights, adopted by 43.8% of listings. This highlights the market's preference for longer commitments.
- A significant segment (43.8%) caters to monthly stays (30+ nights) in Washington, pointing to opportunities in the extended-stay market.
Recommendations
- Align with the market by considering a 30+ Nights minimum stay, as 43.8% of Washington hosts use this setting.
- If feasible, allowing 1-night stays, especially midweek or during low season, could capture last-minute bookings, as only 19.7% currently do.
- Explore offering discounts for stays of 30+ nights to attract the 43.8% of the market seeking extended stays.
- Adjust minimum nights based on seasonality – potentially shorter during low season and longer during peak demand periods in Washington.
Washington Airbnb Cancellation Policy Trends Analysis (2026)
Non-refundable
1 listings
0% of total
Super Strict 30 Days
131 listings
3% of total
Limited
174 listings
4% of total
Super Strict 60 Days
27 listings
0.6% of total
Refundable
1 listings
0% of total
Flexible
668 listings
15.4% of total
Moderate
1388 listings
31.9% of total
Firm
1339 listings
30.8% of total
Strict
620 listings
14.3% of total
Cancellation Policy Insights for Washington
- The prevailing Airbnb cancellation policy trend in Washington is Moderate, used by 31.9% of listings.
- There's a relatively balanced mix between guest-friendly (47.3%) and stricter (45.1%) policies, offering choices for different guest needs.
Recommendations for Hosts
- Consider adopting a Moderate policy to align with the 31.9% market standard in Washington.
- Using a Strict policy might deter some guests, as only 14.3% of listings use it. Evaluate if potential revenue protection outweighs possible lower booking rates.
- Regularly review your cancellation policy against competitors and market demand shifts in Washington.
How Much Are Airbnb Cleaning Fees in Washington?
Cleaning fees in Washington are meaningful operating levers, not just pass-through charges. What matters most is how often hosts charge them, how high they run relative to market norms, and how large a share of gross revenue they consume.
Cleaning Fee Insights for Washington
- 85.4% of listings charge a cleaning fee, making it standard practice in Washington. Guests expect it and factor it into their booking decisions.
- The gap between the average ($464) and median ($116) cleaning fee indicates some high-end properties are pulling the average up considerably.
- Cleaning fees represent 9.8% of gross revenue on average — a modest component of the overall booking price.
Recommendations for Hosts
- Price your cleaning fee competitively against the Washington median of $116. Fees significantly above market norms can deter bookings, especially for shorter stays.
- Monitor competitor cleaning fees regularly. Airbnb's search algorithm factors in total price, so a well-calibrated cleaning fee can improve your listing's ranking.
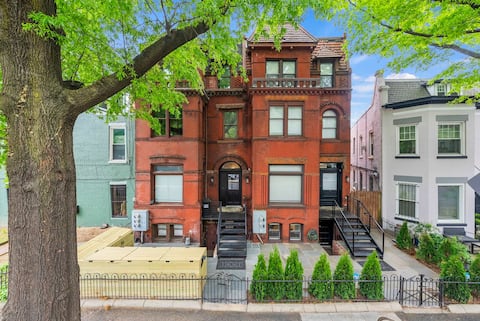
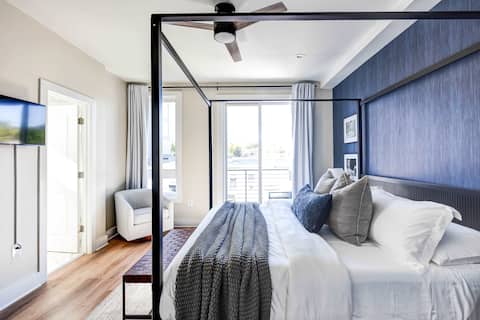
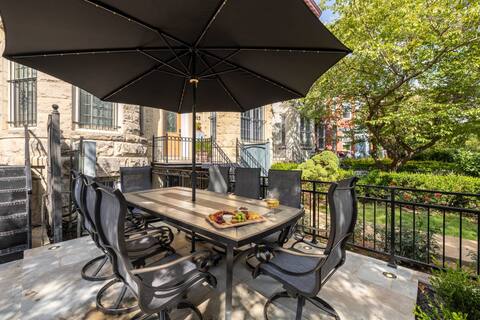
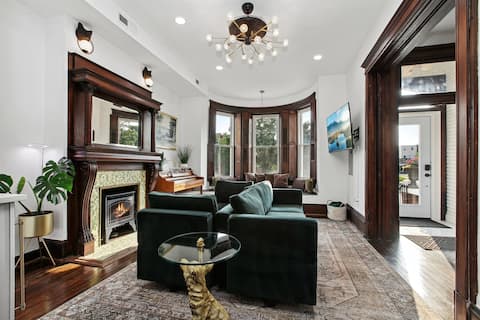
What Do the Top Airbnb Listings in Washington Look Like?
Benchmark your potential! Explore examples of top-performing Airbnb properties in Washingtonbased on Trailing Twelve Month (TTM) revenue. Analyze their characteristics, revenue, occupancy rate, and ADR to understand what drives success in this market.
Luxury 8BR/7BA DC Mansion – Reunions, Retreats
Entire Place • 8 bedrooms
Luxury 12-BR DC Mansion+Rooftop Patio | Sleeps 28
Entire Place • 12 bedrooms
Luxe 7-BR Victorian Castle in the Nation's Capital
Entire Place • 7 bedrooms

Beautiful new Georgetown home
Entire Place • 4 bedrooms
Historic-7BR/4.5BA-Parking+By Metro+Chef's Kitchen
Entire Place • 7 bedrooms

Luxury 5BR DC Townhome + Private Outdoor Patio
Entire Place • 5 bedrooms
Note: Performance varies based on location, size, amenities, seasonality, and management quality. Data reflects the past 12 months.
Who Are the Top Airbnb Hosts in Washington?
Learn from the best! This table showcases top-performing Airbnb hosts in Washington based on the number of properties managed and estimated total revenue over the past year. Analyze their scale and performance metrics.
| Host Name | Properties | Grossing Revenue | Stay Reviews | Avg Rating |
|---|---|---|---|---|
| Sojourn | 197 | $6,593,309 | 11876 | 4.75/5.0 |
| Home Sweet City | 82 | $4,826,175 | 9352 | 4.85/5.0 |
| Stay Bubo Vacation Rentals | 37 | $2,262,094 | 4923 | 4.76/5.0 |
| Douglas | 23 | $1,714,836 | 3811 | 4.75/5.0 |
| Jay | 23 | $1,534,293 | 1671 | 4.71/5.0 |
| Travel Luxe | 8 | $1,487,412 | 612 | 4.93/5.0 |
| Marsh | 17 | $1,283,308 | 4242 | 4.87/5.0 |
| Adam | 7 | $1,197,103 | 1074 | 4.89/5.0 |
| Stephen | 13 | $1,065,323 | 1321 | 4.85/5.0 |
| Corporate Housing | 14 | $1,000,664 | 357 | 4.70/5.0 |
Analyzing the strategies of top hosts, such as their property selection, pricing, and guest communication, can offer valuable lessons for optimizing your own Airbnb operations in Washington.
Who Are the Airbnb Hosts in Washington?
Washington is a quality-focused market, with a high Superhost share and fairly mature operating standards.
Host Profile Insights for Washington
- With 53.4% Superhosts, Washington has an experienced host base that sets high guest expectations. New entrants should plan for competitive quality standards.
- 13.5% of listings are professionally managed, reflecting a market still dominated by individual hosts.
- 5.4% of listings have Instant Book enabled. Lower Instant Book adoption means many guests must request approval, which can slow conversions.
- 69.9% of listings use Airbnb's simplified pricing (host-only fee), where the host pays the entire platform service fee and the guest sees one all-in price with no separate Airbnb service charge. High adoption signals a professional, PMS-connected host base — Airbnb mandates simplified pricing for software-connected listings.
Recommendations for Hosts
- Consider enabling Instant Book — it reduces booking friction and Airbnb's algorithm tends to favor Instant Book listings in search results.
- With 35.3% cohosted listings, there may be a growing local market for property management services.
- Benchmark your host metrics against these Washington averages regularly and adjust your hosting strategy based on what top performers do differently.
Top Professional Management Companies in Washington
These are the highest-grossing professional property management operations in Washington, ranked by total revenue across their portfolio. Their performance metrics offer a benchmark for what institutional-level hosting looks like in this market.
| Company | Listings | Revenue | ADR | Occ. | Rating |
|---|---|---|---|---|---|
| Sojourn | 197 | $6,593,309 | $264 | 42.5% | 4.75/5 |
| Home Sweet City | 82 | $4,826,175 | $313 | 55.9% | 4.85/5 |
| Douglas | 23 | $1,714,836 | $589 | 58.3% | 4.75/5 |
| Travel Luxe | 8 | $1,487,412 | $717 | 63.9% | 4.93/5 |
| Marsh | 17 | $1,283,308 | $286 | 72.9% | 4.87/5 |
| Adam | 7 | $1,197,103 | $673 | 57.4% | 4.89/5 |
| Corporate Housing | 14 | $1,000,664 | $511 | 43.6% | 4.70/5 |
| Evolve | 29 | $874,823 | $298 | 38.7% | 4.62/5 |
| Tahmeed | 15 | $838,445 | $405 | 46.4% | 4.51/5 |
| David | 16 | $799,453 | $306 | 49.9% | 4.81/5 |
Management Company Insights for Washington
- The leading management company, Sojourn, operates 197 listings with $6,593,309 in gross revenue — a useful benchmark for what scale looks like in Washington.
- Top managers average 41 properties each, pointing to a market where portfolio scale is a meaningful competitive factor.
- Professionally managed listings in the top tier average 4.77/5 in guest ratings — demonstrating that scale and quality can coexist.
Recommendations
- With only 13.5% of listings professionally managed, there may be an opportunity to differentiate through more structured operations and consistent guest experiences.
- Study how top management companies price, position, and maintain their portfolios — their ADR and occupancy rates reflect strategies refined across dozens of listings.
- If you're considering hiring a property manager, compare their portfolio performance against these benchmarks before committing.
How Does Washington's Airbnb Market Compare to Nearby Cities?
How does the Washington Airbnb market stack up against its neighbors? Compare key performance metrics like average monthly revenue, ADR, and occupancy rates in surrounding areas to understand the broader regional STR landscape.
Compared with Shannondale, Washington has 5 percentage points lower occupancy and about $111 lower ADR. That helps frame whether this market is winning more on demand, pricing, or both.
| Market | Active Properties | Monthly Revenue | Daily Rate | Avg. Occupancy |
|---|---|---|---|---|
| Centreville | 17 | $5,700 | $572.48 | 41% |
| Shannondale | 45 | $5,500 | $342.45 | 51% |
| Stevensville | 78 | $5,341 | $579.65 | 41% |
| Lower Windsor Township | 13 | $5,258 | $456.61 | 45% |
| Easton | 41 | $5,222 | $654.02 | 40% |
| Mineral | 229 | $4,799 | $488.61 | 35% |
| Weems | 11 | $4,794 | $435.46 | 47% |
| Queenstown | 24 | $4,622 | $632.95 | 36% |
| Middleburg | 39 | $4,518 | $491.19 | 40% |
| Hague | 12 | $4,517 | $445.66 | 36% |
Frequently Asked Questions About Airbnb in Washington
These quick answers summarize the most common investor and operator questions using AirROI's latest market data for Washington.
How much do Airbnb hosts make in Washington?
Washington hosts earn about $30,710 per year on average, with an average nightly rate of $232 and RevPAR of $107. Those figures describe the typical revenue environment for active listings in Washington, District of Columbia, not the ceiling for the best operators. Source: AirROI 2026 data, Washington market, May 2025 to April 2026.
What is the average Airbnb occupancy rate in Washington?
The average Airbnb occupancy rate in Washington is 45.7%. June is the strongest month and February is the softest, so hosts should expect demand to move meaningfully throughout the year rather than stay flat.
What is the average Airbnb daily rate in Washington?
Listings in Washington average $232 per night. The broader pricing spread also matters: lower-performing listings cluster closer to the lower quartiles, while premium homes can price materially above the city average when demand spikes or listing quality stands out.
How many Airbnb listings are active in Washington?
Washington currently has about 4,352 active Airbnb listings in AirROI's market dataset. That supply count helps explain how competitive the market is, how much depth there is for benchmarking, and whether the market behaves like a niche destination or a scaled urban market.
How strict are short-term rental regulations in Washington?
AirROI currently classifies the short-term rental regulation level in Washington as High. The dataset also shows about 83.4% of listings with registration evidence. That is a market signal, not legal advice, so hosts should still confirm current licensing and compliance rules locally before listing.
What is the RevPAR for Airbnb in Washington?
RevPAR in Washington is about $107. That metric combines pricing and occupancy into one efficiency number, so it is often a better quick benchmark than ADR alone when investors want to compare how well listings convert nightly rates into realized revenue.
Is Airbnb profitable in Washington?
At 45.7% occupancy, Washington can be profitable — but margins depend heavily on operating costs, property acquisition price, and how well hosts optimize pricing across seasons. Average annual revenue is $30,710, but individual returns depend on property type, location within the city, and the host's operating efficiency.
How far in advance do guests book Airbnb in Washington?
The average booking lead time in Washington is about 41 days — a moderate lead time that gives hosts planning visibility while still benefiting from last-minute bookings. Hosts who understand their market's booking cadence can adjust minimum stays and pricing windows accordingly.
What are the best neighborhoods for Airbnb in Washington?
Based on AirROI's analysis, some of the top neighborhoods for short-term rentals in Washington include Adams Morgan, Georgetown, Capitol Hill. Each area attracts different guest profiles — from business travelers to leisure visitors — so the best location depends on the property type and target audience a host is aiming for. See the full neighborhood breakdown above.
What type of property performs best on Airbnb in Washington?
entire_home listings make up 84.1% of the active supply in Washington. The most common configuration does not always mean the most profitable — operators who identify underserved property types or bedroom counts can sometimes outperform the market average by filling a gap in local supply.
How does Washington compare to nearby Airbnb markets?
Among neighboring markets, Centreville posts $68,396 in average annual revenue with 40.6% occupancy, compared to Washington's $30,710 and 45.7%. Comparing nearby markets helps investors understand whether a destination's performance reflects local demand or broader regional trends.
What is the average length of stay in Washington?
The average Airbnb stay length in Washington is about 7.4 nights. That matters for turnover, cleaning operations, and pricing strategy because shorter stays increase changeovers while longer stays can smooth occupancy and reduce operational friction.
What is the average Airbnb guest rating in Washington?
Airbnb listings in Washington average 4.78 out of 5 overall. About 38.5% of listings carry the guest favorite badge, which suggests a meaningful share of inventory is competing on review quality rather than price alone.
Which amenities boost Airbnb revenue in Washington?
Bowling alley and TV are among the strongest revenue-linked amenities in Washington. In AirROI's latest dataset, listings with these amenities outperform those without on average revenue, which makes amenities analysis useful for prioritizing investment and listing upgrades.
Do Airbnb hosts charge cleaning fees in Washington?
Yes. About 85.4% of active Airbnb listings in Washington charge a cleaning fee, and the average fee is $464. The more important operating benchmark is how much of gross revenue that fee consumes, not just the absolute dollar amount.
What percentage of Airbnb hosts are Superhosts in Washington?
A 53.4% Superhost rate signals a highly competitive market where review quality and responsiveness are table stakes, not differentiators.
About AirROI Market Data
AirROI tracks over 20 million properties across 190+ countries and maintains 15+ years of historical performance data, making it one of the deepest Airbnb and STR intelligence platforms available. The analytics pipeline aggregates listing-level data monthly — revenue, occupancy, nightly rates, RevPAR, guest demographics, booking patterns, and competitive supply — so investors and operators can benchmark any market against its own history and against neighboring destinations.
Real estate investors, property managers, financial institutions, hedge funds, tourism boards, hospitality consultants, tech platforms, and academic researchers rely on AirROI data to underwrite acquisitions, optimize pricing, model macro trends, and conduct peer-reviewed research. Data is available through in-depth market reports like this one and the Airbnb API with 22 endpoints and an Airbnb MCP Server for AI agents.
AirROI proprietary analytics as of 2026-04-30. Metrics reflect trailing twelve-month aggregates from active listings. Revenue figures are market averages, not projections. Neighborhood descriptions are AI-generated and reviewed for accuracy. For full methodology, see the data methodology page.