Charlotte Harbor Airbnb Market Analysis 2026: Short Term Rental Data & Vacation Rental Statistics in Florida, United States
Is Airbnb profitable in Charlotte Harbor in 2026? Explore comprehensive Airbnb analytics for Charlotte Harbor, Florida, United States to uncover income potential. This 2026 STR market report for Charlotte Harbor, based on AirROI data from February 2025 to January 2026, reveals key trends in the niche market of 30 active listings.
Whether you're considering an Airbnb investment in Charlotte Harbor, optimizing your existing vacation rental, or exploring rental arbitrage opportunities, understanding the Charlotte Harbor Airbnb data is crucial. Leveraging the low regulation environment is key to maximizing your short term rental income potential. Let's dive into the specifics.
Key Charlotte Harbor Airbnb Performance Metrics Overview
Monthly Airbnb Revenue Variations & Income Potential in Charlotte Harbor (2026)
Understanding the monthly revenue variations for Airbnb listings in Charlotte Harbor is key to maximizing your short term rental income potential. Seasonality significantly impacts earnings. Our analysis, based on data from the past 12 months, shows that the peak revenue month for STRs in Charlotte Harbor is typically February, while September often presents the lowest earnings, highlighting opportunities for strategic pricing adjustments during shoulder and low seasons. Explore the typical Airbnb income in Charlotte Harbor across different performance tiers:
- Best-in-class properties (Top 10%) achieve $7,958+ monthly, often utilizing dynamic pricing and superior guest experiences.
- Strong performing properties (Top 25%) earn $3,160 or more, indicating effective management and desirable locations/amenities.
- Typical properties (Median) generate around $1,665 per month, representing the average market performance.
- Entry-level properties (Bottom 25%) see earnings around $896, often with potential for optimization.
Average Monthly Airbnb Earnings Trend in Charlotte Harbor
Charlotte Harbor Airbnb Occupancy Rate Trends (2026)
Maximize your bookings by understanding the Charlotte Harbor STR occupancy trends. Seasonal demand shifts significantly influence how often properties are booked. Typically, Februarysees the highest demand (peak season occupancy), while November experiences the lowest (low season). Effective strategies, like adjusting minimum stays or offering promotions, can boost occupancy during slower periods. Here's how different property tiers perform in Charlotte Harbor:
- Best-in-class properties (Top 10%) achieve 76%+ occupancy, indicating high desirability and potentially optimized availability.
- Strong performing properties (Top 25%) maintain 56% or higher occupancy, suggesting good market fit and guest satisfaction.
- Typical properties (Median) have an occupancy rate around 31%.
- Entry-level properties (Bottom 25%) average 17% occupancy, potentially facing higher vacancy.
Average Monthly Occupancy Rate Trend in Charlotte Harbor
Average Daily Rate (ADR) Airbnb Trends in Charlotte Harbor (2026)
Effective short term rental pricing strategy in Charlotte Harbor involves understanding monthly ADR fluctuations. The Average Daily Rate (ADR) for Airbnb in Charlotte Harbor typically peaks in January and dips lowest during August. Leveraging Airbnb dynamic pricing tools or strategies based on this seasonality can significantly boost revenue. Here's a look at the typical nightly rates achieved:
- Best-in-class properties (Top 10%) command rates of $422+ per night, often due to premium features or locations.
- Strong performing properties (Top 25%) achieve nightly rates of $220 or more.
- Typical properties (Median) charge around $160 per night.
- Entry-level properties (Bottom 25%) earn around $129 per night.
Average Daily Rate (ADR) Trend by Month in Charlotte Harbor
Get Live Charlotte Harbor Market Intelligence 👇

Explore Real-time Analytics
Airbnb Seasonality Analysis & Trends in Charlotte Harbor (2026)
Peak Season (February, March, July)
- Revenue averages $4,418 per month
- Occupancy rates average 57.1%
- Daily rates average $221
Shoulder Season
- Revenue averages $2,836 per month
- Occupancy maintains around 33.4%
- Daily rates hold near $219
Low Season (May, September, November)
- Revenue drops to average $1,944 per month
- Occupancy decreases to average 27.4%
- Daily rates adjust to average $210
Seasonality Insights for Charlotte Harbor
- The Airbnb seasonality in Charlotte Harbor shows highly seasonal trends requiring careful strategy. While the sections above show seasonal averages, it's also insightful to look at the extremes:
- During the high season, the absolute peak month showcases Charlotte Harbor's highest earning potential, with monthly revenues capable of climbing to $5,002, occupancy reaching a high of 73.4%, and ADRs peaking at $254.
- Conversely, the slowest single month of the year, typically falling within the low season, marks the market's lowest point. In this month, revenue might dip to $1,608, occupancy could drop to 25.8%, and ADRs may adjust down to $193.
- Understanding both the seasonal averages and these monthly peaks and troughs in revenue, occupancy, and ADR is crucial for maximizing your Airbnb profit potential in Charlotte Harbor.
Seasonal Strategies for Maximizing Profit
- Peak Season: Maximize revenue through premium pricing and potentially longer minimum stays. Ensure high availability.
- Low Season: Offer competitive pricing, special promotions (e.g., extended stay discounts), and flexible cancellation policies. Target off-season travelers like remote workers or budget-conscious guests.
- Shoulder Seasons: Implement dynamic pricing that balances peak and low rates. Target weekend travelers or specific events. Offer slightly more flexible terms than peak season.
- Regularly analyze your own performance against these Charlotte Harbor seasonality benchmarks and adjust your pricing and availability strategy accordingly.
Best Areas for Airbnb Investment in Charlotte Harbor (2026)
Exploring the top neighborhoods for short-term rentals in Charlotte Harbor? This section highlights key areas, outlining why they are attractive for hosts and guests, along with notable local attractions. Consider these locations based on your target guest profile and investment strategy.
| Neighborhood / Area | Why Host Here? (Target Guests & Appeal) | Key Attractions & Landmarks |
|---|---|---|
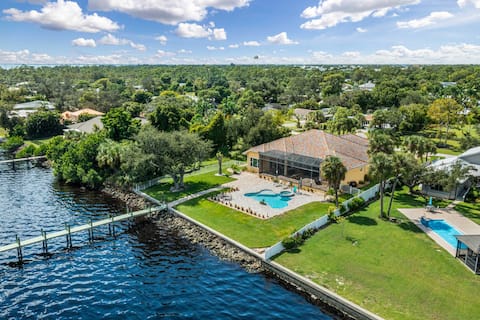
| Punta Gorda | Charming waterfront town known for its historic district and scenic harbor views. Ideal for travelers looking for a relaxing getaway with beautiful parks and outdoor activities. | Punta Gorda Harbor, Fishermen's Village, Punta Gorda History Park, Charlotte Harbor Preserve State Park, Peace River Wildlife Center |
| Port Charlotte | Family-friendly community with access to beaches and recreational activities. Perfect for longer-stay guests and families wanting to explore the Gulf Coast. | Port Charlotte Beach Park, Cultural Center of Charlotte County, Charlotte Sports Park, Twin Isles Country Club, Eagle Point Park |
| Englewood | Quaint coastal community known for its beautiful beaches and relaxed atmosphere. Attracts those seeking a beach vacation without the crowds. | Englewood Beach, Stump Pass Beach State Park, Manasota Key, Blind Pass Beach, Chadwick Park |
| Rotonda West | Residential area with a focus on outdoor activities like golfing and fishing. Great for guests looking to unwind in a peaceful environment. | Rotonda Golf & Country Club, Bocilla Island, Wildflower Preserve, Don Pedro Island State Park, Lemon Bay Park |
| Babcock Ranch | Innovative eco-community designed for sustainability and outdoor lifestyle. Appeals to eco-conscious travelers and nature lovers. | Babcock Ranch Eco Tours, Babcock Ranch Preserve, Lake Babcock, Cypress Dome Preserve, Charlotte Harbor Preserve State Park |
| Englewood Isles | Peaceful neighborhood situated near the water, perfect for families and retirees looking for a calm retreat. Close proximity to beaches and amenities. | Englewood Isles Marina, Stump Pass Beach State Park, Fishing on the Gulf, Parks and Nature Trails, Local Shops and Restaurants |
| Cape Haze | A serene area known for its barrier islands and nature preserves. Great for those seeking a tranquil vacation with beach access. | Cape Haze Pioneer Trail, Don Pedro Island State Park, Gasparilla Island State Park, Boca Grande Lighthouse, Pine Island Sound |
| Boca Grande | Upscale destination known for its beautiful beaches and exclusivity. Attracts affluent travelers seeking luxury and relaxation. | Boca Grande Beach, Gasparilla Island State Park, Boca Grande Lighthouse Museum, Historic Boca Grande, Local Fine Dining Options |
Understanding Airbnb License Requirements & STR Laws in Charlotte Harbor (2026)
While Charlotte Harbor, Florida, United States currently shows low STR regulations, specific Airbnb license requirements might still exist or change. Always verify the latest short term rental regulations and Airbnb license requirements directly with local government authorities for Charlotte Harbor to ensure full compliance before hosting.
(Source: AirROI data, 2026, finding no licensed listings among those analyzed)
Top Performing Airbnb Properties in Charlotte Harbor (2026)
Benchmark your potential! Explore examples of top-performing Airbnb properties in Charlotte Harborbased on Trailing Twelve Month (TTM) revenue. Analyze their characteristics, revenue, occupancy rate, and ADR to understand what drives success in this market.
Peace River Waterfront Luxury Living - 5-BD w Pool
Entire Place • 5 bedrooms
Luxury modern waterfront 4BR/3.5BA pool beach
Entire Place • 4 bedrooms

Amazing Peace River Views
Entire Place • 2 bedrooms

Luxurious Mangoe 4 bed 2 bath, heated pool & spa
Entire Place • 4 bedrooms
Peaceful Waterfront Orchard 2
Entire Place • 2 bedrooms
Peaceful Waterfront Orchard 1
Entire Place • 2 bedrooms
Note: Performance varies based on location, size, amenities, seasonality, and management quality. Data reflects the past 12 months.
Top Performing Airbnb Hosts in Charlotte Harbor (2026)
Learn from the best! This table showcases top-performing Airbnb hosts in Charlotte Harbor based on the number of properties managed and estimated total revenue over the past year. Analyze their scale and performance metrics.
| Host Name | Properties | Grossing Revenue | Stay Reviews | Avg Rating |
|---|---|---|---|---|
| Goldnest | 1 | $158,045 | 23 | 4.74/5.0 |
| Beata | 1 | $88,105 | 77 | 5.00/5.0 |
| Nathan | 1 | $75,887 | 59 | 4.95/5.0 |
| Scott | 2 | $70,419 | 157 | 4.98/5.0 |
| Margaret | 1 | $58,107 | 30 | 5.00/5.0 |
| Sarah | 4 | $25,905 | 81 | 4.81/5.0 |
| Hiliany | 2 | $24,302 | 24 | 4.76/5.0 |
| Sunseeker | 2 | $22,695 | 17 | 4.89/5.0 |
| Sunset Inn | 7 | $21,775 | 256 | 4.86/5.0 |
| Anthony | 1 | $21,483 | 104 | 4.92/5.0 |
Analyzing the strategies of top hosts, such as their property selection, pricing, and guest communication, can offer valuable lessons for optimizing your own Airbnb operations in Charlotte Harbor.
Dive Deeper: Advanced Charlotte Harbor STR Market Data (2026)
Ready to unlock more insights? AirROI provides access to advanced metrics and comprehensive Airbnb data for Charlotte Harbor. Explore detailed analytics beyond this report to refine your investment strategy, optimize pricing, and maximize your vacation rental profits.
Explore Advanced MetricsCharlotte Harbor Short-Term Rental Market Composition (2026): Property & Room Types
Room Type Distribution
Property Type Distribution
Market Composition Insights for Charlotte Harbor
- The Charlotte Harbor Airbnb market composition is heavily skewed towards Entire Home/Apt listings, which make up 100% of the 30 active rentals. This indicates strong guest preference for privacy and space.
- Looking at the property type distribution in Charlotte Harbor, Apartment/Condo properties are the most common (50%), reflecting the local real estate landscape.
- Houses represent a significant 40% portion, catering likely to families or larger groups.
- Smaller segments like others (combined 3.3%) offer potential for unique stay experiences.
Charlotte Harbor Airbnb Room Capacity Analysis (2026): Bedroom Distribution
Distribution of Listings by Number of Bedrooms
Room Capacity Insights for Charlotte Harbor
- The dominant room capacity in Charlotte Harbor is 2 bedrooms listings, making up 46.7% of the market. This suggests a strong demand for properties suitable for couples or solo travelers.
- Together, 2 bedrooms and 1 bedroom properties represent 80.0% of the active Airbnb listings in Charlotte Harbor, indicating a high concentration in these sizes.
Charlotte Harbor Vacation Rental Guest Capacity Trends (2026)
Distribution of Listings by Guest Capacity
Guest Capacity Insights for Charlotte Harbor
- The most common guest capacity trend in Charlotte Harbor vacation rentals is listings accommodating 4 guests (30%). This suggests the primary traveler segment is likely small families or groups.
- Properties designed for 4 guests and 2 guests dominate the Charlotte Harbor STR market, accounting for 56.7% of listings.
- 33.3% of properties accommodate 6+ guests, serving the market segment for larger families or group travel in Charlotte Harbor.
- On average, properties in Charlotte Harbor are equipped to host 4.6 guests.
Charlotte Harbor Airbnb Booking Patterns (2026): Available vs. Booked Days
Available Days Distribution
Booked Days Distribution
Booking Pattern Insights for Charlotte Harbor
- The most common availability pattern in Charlotte Harbor falls within the 271-366 days range, representing 73.3% of listings. This suggests many properties have significant open periods on their calendars.
- Approximately 93.3% of listings show high availability (181+ days open annually), indicating potential for increased bookings or specific owner usage patterns.
- For booked days, the 31-90 days range is most frequent in Charlotte Harbor (36.7%), reflecting common guest stay durations or potential owner blocking patterns.
- A notable 10.0% of properties secure long booking periods (181+ days booked per year), highlighting successful long-term rental strategies or significant owner usage.
Charlotte Harbor Airbnb Minimum Stay Requirements Analysis
Distribution of Listings by Minimum Night Requirement
1 Night
13 listings
43.3% of total
2 Nights
5 listings
16.7% of total
3 Nights
7 listings
23.3% of total
30+ Nights
5 listings
16.7% of total
Key Insights
- The most prevalent minimum stay requirement in Charlotte Harbor is 1 Night, adopted by 43.3% of listings. This highlights the market's preference for shorter, flexible bookings.
- A significant segment (16.7%) caters to monthly stays (30+ nights) in Charlotte Harbor, pointing to opportunities in the extended-stay market.
Recommendations
- Align with the market by considering a 1 Night minimum stay, as 43.3% of Charlotte Harbor hosts use this setting.
- Explore offering discounts for stays of 30+ nights to attract the 16.7% of the market seeking extended stays.
- Adjust minimum nights based on seasonality – potentially shorter during low season and longer during peak demand periods in Charlotte Harbor.
Charlotte Harbor Airbnb Cancellation Policy Trends Analysis (2026)
Super Strict 30 Days
1 listings
3.3% of total
Flexible
7 listings
23.3% of total
Moderate
12 listings
40% of total
Firm
6 listings
20% of total
Strict
4 listings
13.3% of total
Cancellation Policy Insights for Charlotte Harbor
- The prevailing Airbnb cancellation policy trend in Charlotte Harbor is Moderate, used by 40% of listings.
- There's a relatively balanced mix between guest-friendly (63.3%) and stricter (33.3%) policies, offering choices for different guest needs.
Recommendations for Hosts
- Consider adopting a Moderate policy to align with the 40% market standard in Charlotte Harbor.
- Using a Strict policy might deter some guests, as only 13.3% of listings use it. Evaluate if potential revenue protection outweighs possible lower booking rates.
- Regularly review your cancellation policy against competitors and market demand shifts in Charlotte Harbor.
Charlotte Harbor STR Booking Lead Time Analysis (2026)
Average Booking Lead Time by Month
Booking Lead Time Insights for Charlotte Harbor
- The overall average booking lead time for vacation rentals in Charlotte Harbor is 42 days.
- Guests book furthest in advance for stays during January (average 77 days), likely coinciding with peak travel demand or local events.
- The shortest booking windows occur for stays in September (average 3 days), indicating more last-minute travel plans during this time.
- Seasonally, Winter (64 days avg.) sees the longest lead times, while Fall (19 days avg.) has the shortest, reflecting typical travel planning cycles.
Recommendations for Hosts
- Use the overall average lead time (42 days) as a baseline for your pricing and availability strategy in Charlotte Harbor.
- For January stays, consider implementing length-of-stay discounts or slightly higher rates for bookings made less than 77 days out to capitalize on advance planning.
- During September, focus on last-minute booking availability and promotions, as guests book with very short notice (3 days avg.).
- Target marketing efforts for the Winter season well in advance (at least 64 days) to capture early planners.
- Monitor your own booking lead times against these Charlotte Harbor averages to identify opportunities for dynamic pricing adjustments.
Popular & Essential Airbnb Amenities in Charlotte Harbor (2026)
Amenity Prevalence
Amenity Insights for Charlotte Harbor
- Essential amenities in Charlotte Harbor that guests expect include: Heating, Hair dryer, Air conditioning, Smoke alarm, TV, Wifi, Refrigerator, Dryer, Bed linens, Washer. Lacking these (any) could significantly impact bookings.
Recommendations for Hosts
- Ensure your listing includes all essential amenities for Charlotte Harbor: Heating, Hair dryer, Air conditioning, Smoke alarm, TV, Wifi, Refrigerator, Dryer, Bed linens, Washer.
- Prioritize adding missing essentials: Refrigerator, Dryer, Bed linens, Washer.
- Highlight unique or less common amenities you offer (e.g., hot tub, dedicated workspace, EV charger) in your listing description and photos.
- Regularly check competitor amenities in Charlotte Harbor to stay competitive.
Charlotte Harbor Airbnb Guest Demographics & Profile Analysis (2026)
Guest Profile Summary for Charlotte Harbor
- The typical guest profile for Airbnb in Charlotte Harbor consists of primarily domestic travelers (97%), often arriving from nearby New York, typically belonging to the Post-2000s (Gen Z/Alpha) group (50%), primarily speaking English or Spanish.
- Domestic travelers account for 97.0% of guests.
- Key international markets include United States (97%) and Canada (1%).
- Top languages spoken are English (84.6%) followed by Spanish (7.7%).
- A significant demographic segment is the Post-2000s (Gen Z/Alpha) group, representing 50% of guests.
Recommendations for Hosts
- Target domestic marketing efforts towards travelers from New York and Panama City Beach.
- Tailor amenities and listing descriptions to appeal to the dominant Post-2000s (Gen Z/Alpha) demographic (e.g., highlight fast WiFi, smart home features, local guides).
- Highlight unique local experiences or amenities relevant to the primary guest profile.
- Consider seasonal promotions aligned with peak travel times for key origin markets.
Nearby Short-Term Rental Market Comparison
How does the Charlotte Harbor Airbnb market stack up against its neighbors? Compare key performance metrics like average monthly revenue, ADR, and occupancy rates in surrounding areas to understand the broader regional STR landscape.
| Market | Active Properties | Monthly Revenue | Daily Rate | Avg. Occupancy |
|---|---|---|---|---|
| Anna Maria island | 587 | $7,996 | $823.96 | 41% |
| Anna Maria | 56 | $6,434 | $692.96 | 52% |
| Boca Grande | 31 | $6,128 | $787.07 | 37% |
| Indian Rocks Beach | 842 | $5,560 | $419.63 | 49% |
| Captiva | 291 | $5,443 | $667.40 | 36% |
| Siesta Key | 1,175 | $5,206 | $518.91 | 42% |
| Belleair Beach | 94 | $5,086 | $339.65 | 53% |
| Bradenton Beach | 122 | $4,977 | $507.12 | 42% |
| Seminole | 519 | $4,223 | $316.69 | 52% |
| Brandenton Beach | 481 | $4,172 | $496.62 | 37% |