Goodland Airbnb Market Analysis 2026: Short Term Rental Data & Vacation Rental Statistics in Florida, United States
Is Airbnb profitable in Goodland in 2026? Explore comprehensive Airbnb analytics for Goodland, Florida, United States to uncover income potential. This 2026 STR market report for Goodland, based on AirROI data from February 2025 to January 2026, reveals key trends in the niche market of 20 active listings.
Whether you're considering an Airbnb investment in Goodland, optimizing your existing vacation rental, or exploring rental arbitrage opportunities, understanding the Goodland Airbnb data is crucial. Leveraging the low regulation environment is key to maximizing your short term rental income potential. Let's dive into the specifics.
Key Goodland Airbnb Performance Metrics Overview
Monthly Airbnb Revenue Variations & Income Potential in Goodland (2026)
Understanding the monthly revenue variations for Airbnb listings in Goodland is key to maximizing your short term rental income potential. Seasonality significantly impacts earnings. Our analysis, based on data from the past 12 months, shows that the peak revenue month for STRs in Goodland is typically February, while September often presents the lowest earnings, highlighting opportunities for strategic pricing adjustments during shoulder and low seasons. Explore the typical Airbnb income in Goodland across different performance tiers:
- Best-in-class properties (Top 10%) achieve $5,611+ monthly, often utilizing dynamic pricing and superior guest experiences.
- Strong performing properties (Top 25%) earn $4,613 or more, indicating effective management and desirable locations/amenities.
- Typical properties (Median) generate around $2,981 per month, representing the average market performance.
- Entry-level properties (Bottom 25%) see earnings around $1,780, often with potential for optimization.
Average Monthly Airbnb Earnings Trend in Goodland
Goodland Airbnb Occupancy Rate Trends (2026)
Maximize your bookings by understanding the Goodland STR occupancy trends. Seasonal demand shifts significantly influence how often properties are booked. Typically, Marchsees the highest demand (peak season occupancy), while September experiences the lowest (low season). Effective strategies, like adjusting minimum stays or offering promotions, can boost occupancy during slower periods. Here's how different property tiers perform in Goodland:
- Best-in-class properties (Top 10%) achieve 67%+ occupancy, indicating high desirability and potentially optimized availability.
- Strong performing properties (Top 25%) maintain 54% or higher occupancy, suggesting good market fit and guest satisfaction.
- Typical properties (Median) have an occupancy rate around 37%.
- Entry-level properties (Bottom 25%) average 23% occupancy, potentially facing higher vacancy.
Average Monthly Occupancy Rate Trend in Goodland
Average Daily Rate (ADR) Airbnb Trends in Goodland (2026)
Effective short term rental pricing strategy in Goodland involves understanding monthly ADR fluctuations. The Average Daily Rate (ADR) for Airbnb in Goodland typically peaks in January and dips lowest during August. Leveraging Airbnb dynamic pricing tools or strategies based on this seasonality can significantly boost revenue. Here's a look at the typical nightly rates achieved:
- Best-in-class properties (Top 10%) command rates of $365+ per night, often due to premium features or locations.
- Strong performing properties (Top 25%) achieve nightly rates of $310 or more.
- Typical properties (Median) charge around $267 per night.
- Entry-level properties (Bottom 25%) earn around $231 per night.
Average Daily Rate (ADR) Trend by Month in Goodland
Get Live Goodland Market Intelligence 👇

Explore Real-time Analytics
Airbnb Seasonality Analysis & Trends in Goodland (2026)
Peak Season (February, March, January)
- Revenue averages $5,678 per month
- Occupancy rates average 57.0%
- Daily rates average $325
Shoulder Season
- Revenue averages $2,985 per month
- Occupancy maintains around 37.7%
- Daily rates hold near $276
Low Season (June, August, September)
- Revenue drops to average $1,738 per month
- Occupancy decreases to average 26.7%
- Daily rates adjust to average $251
Seasonality Insights for Goodland
- The Airbnb seasonality in Goodland shows highly seasonal trends requiring careful strategy. While the sections above show seasonal averages, it's also insightful to look at the extremes:
- During the high season, the absolute peak month showcases Goodland's highest earning potential, with monthly revenues capable of climbing to $6,756, occupancy reaching a high of 70.3%, and ADRs peaking at $331.
- Conversely, the slowest single month of the year, typically falling within the low season, marks the market's lowest point. In this month, revenue might dip to $1,251, occupancy could drop to 21.7%, and ADRs may adjust down to $240.
- Understanding both the seasonal averages and these monthly peaks and troughs in revenue, occupancy, and ADR is crucial for maximizing your Airbnb profit potential in Goodland.
Seasonal Strategies for Maximizing Profit
- Peak Season: Maximize revenue through premium pricing and potentially longer minimum stays. Ensure high availability.
- Low Season: Offer competitive pricing, special promotions (e.g., extended stay discounts), and flexible cancellation policies. Target off-season travelers like remote workers or budget-conscious guests.
- Shoulder Seasons: Implement dynamic pricing that balances peak and low rates. Target weekend travelers or specific events. Offer slightly more flexible terms than peak season.
- Regularly analyze your own performance against these Goodland seasonality benchmarks and adjust your pricing and availability strategy accordingly.
Best Areas for Airbnb Investment in Goodland (2026)
Exploring the top neighborhoods for short-term rentals in Goodland? This section highlights key areas, outlining why they are attractive for hosts and guests, along with notable local attractions. Consider these locations based on your target guest profile and investment strategy.
| Neighborhood / Area | Why Host Here? (Target Guests & Appeal) | Key Attractions & Landmarks |
|---|---|---|
| Marco Island | A popular destination for beach lovers and families looking for a tropical getaway, Marco Island offers beautiful beaches and water activities, making it an attractive location for Airbnb hosts. | Tigertail Beach, South Marco Beach, Marco Island Historical Museum, Caxambas Park, Waterskiing and swimming activities, Kayaking and paddleboarding |
| Naples | Known for its upscale shopping, dining, and pristine beaches, Naples attracts a wealthier clientele and is perfect for luxury vacation rentals. | Naples Pier, Fifth Avenue South, Clam Pass Park, Naples Botanical Garden, Lowdermilk Beach Park, The Baker Museum |
| Fort Myers Beach | This vibrant beach town is famous for its nightlife and family-friendly environment, catering to a wide range of tourists looking for beachside accommodations. | Times Square, Lovers Key State Park, Fort Myers Beach Fishing Pier, Estero Island Historic Society, Water sports and fishing tours, Shelling on the beach |
| Sanibel Island | Renowned for its shell-strewn beaches and natural beauty, Sanibel Island is popular among nature lovers and those seeking a tranquil escape. | J.N. Ding Darling National Wildlife Refuge, Sanibel Lighthouse, Bowman's Beach, Shell Museum, Kayaking through mangroves, Biking on Sanibel's bike trails |
| Captiva Island | This quaint and picturesque island offers a secluded beach experience, making it ideal for romantic getaways and family vacations, drawing travelers looking for peaceful retreats. | Captiva Village, Sunsets at the beach, Andy Rosse Lane, Captiva Cruises, Fishing and boating activities, Relaxing beach atmosphere |
| Estero | A rapidly developing area with a mix of residential and tourist attractions, Estero is becoming increasingly popular among investors for its proximity to Fort Myers and Naples. | Coconut Point Mall, Koreshan State Park, Estero River, Dining and shopping options, Proximity to beaches |
| Lehigh Acres | An affordable and growing community close to Fort Myers, Lehigh Acres offers a range of rental opportunities attracting families and long-term visitors. | Lehigh Acres Community Park, Cypress Preserve, Golfing, Fishing, Family-friendly activities |
| Bonita Springs | Located between Naples and Fort Myers, Bonita Springs features beautiful beaches and is known for outdoor activities, making it attractive for beach-goers and adventure seekers. | Barefoot Beach Preserve, Bonita Beach Park, The Imperial River, Coconut Point Mall, Outdoor recreation activities |
Understanding Airbnb License Requirements & STR Laws in Goodland (2026)
While Goodland, Florida, United States currently shows low STR regulations, specific Airbnb license requirements might still exist or change. Always verify the latest short term rental regulations and Airbnb license requirements directly with local government authorities for Goodland to ensure full compliance before hosting.
(Source: AirROI data, 2026, finding no licensed listings among those analyzed)
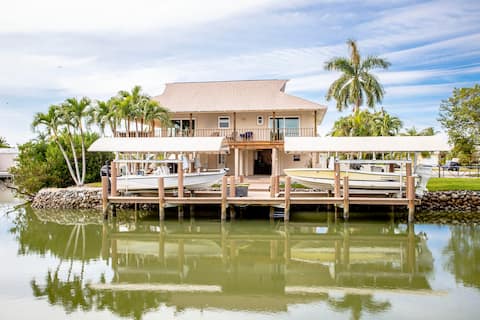
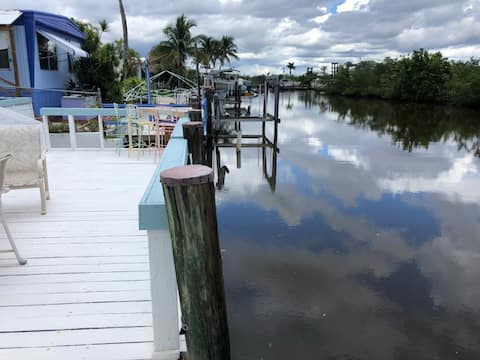
Top Performing Airbnb Properties in Goodland (2026)
Benchmark your potential! Explore examples of top-performing Airbnb properties in Goodlandbased on Trailing Twelve Month (TTM) revenue. Analyze their characteristics, revenue, occupancy rate, and ADR to understand what drives success in this market.

Coastal Paradise! Kayaks+Bikes+Fishing+Boat Dock
Entire Place • 3 bedrooms

Waterfront View Cottage
Entire Place • 1 bedroom
Stilt Home in Paradise
Entire Place • 2 bedrooms
SWFl waterfront home with direct Gulf access
Entire Place • 2 bedrooms

Navy Flamingo
Entire Place • 2 bedrooms

Expansive Waterfront Views with screened in Porch
Entire Place • 2 bedrooms
Note: Performance varies based on location, size, amenities, seasonality, and management quality. Data reflects the past 12 months.
Top Performing Airbnb Hosts in Goodland (2026)
Learn from the best! This table showcases top-performing Airbnb hosts in Goodland based on the number of properties managed and estimated total revenue over the past year. Analyze their scale and performance metrics.
| Host Name | Properties | Grossing Revenue | Stay Reviews | Avg Rating |
|---|---|---|---|---|
| Amanda | 6 | $214,456 | 660 | 4.96/5.0 |
| Jaesen | 1 | $70,764 | 123 | 4.97/5.0 |
| Amanda | 1 | $50,739 | 60 | 4.95/5.0 |
| Tonya | 1 | $47,091 | 416 | 4.90/5.0 |
| Andy And Monica | 1 | $40,936 | 26 | 5.00/5.0 |
| Caryn | 1 | $33,363 | 315 | 4.86/5.0 |
| Ramia | 1 | $26,319 | 127 | 4.81/5.0 |
| Marco Island Vacation Properti | 1 | $25,210 | 7 | 4.71/5.0 |
| HōMZ | 1 | $24,365 | 10 | 4.90/5.0 |
| Bob And Edwina | 1 | $17,074 | 48 | 4.90/5.0 |
Analyzing the strategies of top hosts, such as their property selection, pricing, and guest communication, can offer valuable lessons for optimizing your own Airbnb operations in Goodland.
Dive Deeper: Advanced Goodland STR Market Data (2026)
Ready to unlock more insights? AirROI provides access to advanced metrics and comprehensive Airbnb data for Goodland. Explore detailed analytics beyond this report to refine your investment strategy, optimize pricing, and maximize your vacation rental profits.
Explore Advanced MetricsGoodland Short-Term Rental Market Composition (2026): Property & Room Types
Room Type Distribution
Property Type Distribution
Market Composition Insights for Goodland
- The Goodland Airbnb market composition is heavily skewed towards Entire Home/Apt listings, which make up 100% of the 20 active rentals. This indicates strong guest preference for privacy and space.
- Looking at the property type distribution in Goodland, House properties are the most common (95%), reflecting the local real estate landscape.
- Houses represent a significant 95% portion, catering likely to families or larger groups.
Goodland Airbnb Room Capacity Analysis (2026): Bedroom Distribution
Distribution of Listings by Number of Bedrooms
Room Capacity Insights for Goodland
- The dominant room capacity in Goodland is 2 bedrooms listings, making up 50% of the market. This suggests a strong demand for properties suitable for couples or solo travelers.
- Together, 2 bedrooms and 3 bedrooms properties represent 75.0% of the active Airbnb listings in Goodland, indicating a high concentration in these sizes.
- A significant 25.0% of listings offer 3+ bedrooms, catering to larger groups and families seeking more space in Goodland.
Goodland Vacation Rental Guest Capacity Trends (2026)
Distribution of Listings by Guest Capacity
Guest Capacity Insights for Goodland
- The most common guest capacity trend in Goodland vacation rentals is listings accommodating 4 guests (25%). This suggests the primary traveler segment is likely small families or groups.
- Properties designed for 4 guests and 2 guests dominate the Goodland STR market, accounting for 50.0% of listings.
- 45.0% of properties accommodate 6+ guests, serving the market segment for larger families or group travel in Goodland.
- On average, properties in Goodland are equipped to host 4.8 guests.
Goodland Airbnb Booking Patterns (2026): Available vs. Booked Days
Available Days Distribution
Booked Days Distribution
Booking Pattern Insights for Goodland
- The most common availability pattern in Goodland falls within the 271-366 days range, representing 50% of listings. This suggests many properties have significant open periods on their calendars.
- Approximately 80.0% of listings show high availability (181+ days open annually), indicating potential for increased bookings or specific owner usage patterns.
- For booked days, the 91-180 days range is most frequent in Goodland (40%), reflecting common guest stay durations or potential owner blocking patterns.
- A notable 20.0% of properties secure long booking periods (181+ days booked per year), highlighting successful long-term rental strategies or significant owner usage.
Goodland Airbnb Minimum Stay Requirements Analysis
Distribution of Listings by Minimum Night Requirement
1 Night
3 listings
15% of total
2 Nights
4 listings
20% of total
3 Nights
5 listings
25% of total
4-6 Nights
2 listings
10% of total
30+ Nights
6 listings
30% of total
Key Insights
- The most prevalent minimum stay requirement in Goodland is 30+ Nights, adopted by 30% of listings. This highlights the market's preference for longer commitments.
- A significant segment (30%) caters to monthly stays (30+ nights) in Goodland, pointing to opportunities in the extended-stay market.
Recommendations
- Align with the market by considering a 30+ Nights minimum stay, as 30% of Goodland hosts use this setting.
- If feasible, allowing 1-night stays, especially midweek or during low season, could capture last-minute bookings, as only 15% currently do.
- Explore offering discounts for stays of 30+ nights to attract the 30% of the market seeking extended stays.
- Adjust minimum nights based on seasonality – potentially shorter during low season and longer during peak demand periods in Goodland.
Goodland Airbnb Cancellation Policy Trends Analysis (2026)
Super Strict 30 Days
2 listings
10% of total
Super Strict 60 Days
1 listings
5% of total
Flexible
1 listings
5% of total
Moderate
2 listings
10% of total
Firm
8 listings
40% of total
Strict
6 listings
30% of total
Cancellation Policy Insights for Goodland
- The prevailing Airbnb cancellation policy trend in Goodland is Firm, used by 40% of listings.
- A majority (70.0%) of hosts in Goodland utilize Firm or Strict policies, indicating a market where hosts prioritize booking security.
Recommendations for Hosts
- Consider adopting a Firm policy to align with the 40% market standard in Goodland.
- Regularly review your cancellation policy against competitors and market demand shifts in Goodland.
Goodland STR Booking Lead Time Analysis (2026)
Average Booking Lead Time by Month
Booking Lead Time Insights for Goodland
- The overall average booking lead time for vacation rentals in Goodland is 53 days.
- Guests book furthest in advance for stays during January (average 95 days), likely coinciding with peak travel demand or local events.
- The shortest booking windows occur for stays in September (average 20 days), indicating more last-minute travel plans during this time.
- Seasonally, Winter (88 days avg.) sees the longest lead times, while Summer (34 days avg.) has the shortest, reflecting typical travel planning cycles.
Recommendations for Hosts
- Use the overall average lead time (53 days) as a baseline for your pricing and availability strategy in Goodland.
- For January stays, consider implementing length-of-stay discounts or slightly higher rates for bookings made less than 95 days out to capitalize on advance planning.
- Target marketing efforts for the Winter season well in advance (at least 88 days) to capture early planners.
- Monitor your own booking lead times against these Goodland averages to identify opportunities for dynamic pricing adjustments.
Popular & Essential Airbnb Amenities in Goodland (2026)
Amenity Prevalence
Amenity Insights for Goodland
- Essential amenities in Goodland that guests expect include: TV, Wifi, Kitchen, Air conditioning, Washer, Dishes and silverware, Bed linens, Coffee maker. Lacking these (any) could significantly impact bookings.
- Popular amenities like Free parking on premises, Microwave are common but not universal. Offering these can provide a competitive edge.
Recommendations for Hosts
- Ensure your listing includes all essential amenities for Goodland: TV, Wifi, Kitchen, Air conditioning, Washer, Dishes and silverware, Bed linens, Coffee maker.
- Prioritize adding missing essentials: Washer, Dishes and silverware, Bed linens, Coffee maker.
- Consider adding popular differentiators like Free parking on premises or Microwave to increase appeal.
- Highlight unique or less common amenities you offer (e.g., hot tub, dedicated workspace, EV charger) in your listing description and photos.
- Regularly check competitor amenities in Goodland to stay competitive.
Goodland Airbnb Guest Demographics & Profile Analysis (2026)
Guest Profile Summary for Goodland
- The typical guest profile for Airbnb in Goodland consists of primarily domestic travelers (96%), often arriving from nearby Fort Myers, typically belonging to the Post-2000s (Gen Z/Alpha) group (50%), primarily speaking English or Spanish.
- Domestic travelers account for 96.1% of guests.
- Key international markets include United States (96.1%) and Canada (1.3%).
- Top languages spoken are English (75.9%) followed by Spanish (11.1%).
- A significant demographic segment is the Post-2000s (Gen Z/Alpha) group, representing 50% of guests.
Recommendations for Hosts
- Target domestic marketing efforts towards travelers from Fort Myers and Naples.
- Tailor amenities and listing descriptions to appeal to the dominant Post-2000s (Gen Z/Alpha) demographic (e.g., highlight fast WiFi, smart home features, local guides).
- Highlight unique local experiences or amenities relevant to the primary guest profile.
- Consider seasonal promotions aligned with peak travel times for key origin markets.
Nearby Short-Term Rental Market Comparison
How does the Goodland Airbnb market stack up against its neighbors? Compare key performance metrics like average monthly revenue, ADR, and occupancy rates in surrounding areas to understand the broader regional STR landscape.
| Market | Active Properties | Monthly Revenue | Daily Rate | Avg. Occupancy |
|---|---|---|---|---|
| Stock Island | 107 | $9,731 | $733.54 | 47% |
| Bal Harbour Village | 37 | $8,846 | $850.63 | 34% |
| Key West | 1,137 | $7,525 | $630.09 | 47% |
| Lake Clarke Shores | 26 | $6,710 | $516.52 | 46% |
| Lighthouse Point | 75 | $6,205 | $472.94 | 51% |
| Boca Grande | 31 | $6,128 | $787.07 | 37% |
| Pinecrest | 11 | $6,117 | $861.24 | 43% |
| North Bay Village | 120 | $6,032 | $561.12 | 44% |
| Captiva | 291 | $5,443 | $667.40 | 36% |
| Duck Key | 60 | $5,308 | $504.94 | 43% |