Hallandale Beach City Center Airbnb Market Analysis 2026: Short Term Rental Data & Vacation Rental Statistics in Florida, United States
Is Airbnb profitable in Hallandale Beach City Center in 2026? Explore comprehensive Airbnb analytics for Hallandale Beach City Center, Florida, United States to uncover income potential. This 2026 STR market report for Hallandale Beach City Center, based on AirROI data from February 2025 to January 2026, reveals key trends in the niche market of 19 active listings.
Whether you're considering an Airbnb investment in Hallandale Beach City Center, optimizing your existing vacation rental, or exploring rental arbitrage opportunities, understanding the Hallandale Beach City Center Airbnb data is crucial. Leveraging the low regulation environment is key to maximizing your short term rental income potential. Let's dive into the specifics.
Key Hallandale Beach City Center Airbnb Performance Metrics Overview
Monthly Airbnb Revenue Variations & Income Potential in Hallandale Beach City Center (2026)
Understanding the monthly revenue variations for Airbnb listings in Hallandale Beach City Center is key to maximizing your short term rental income potential. Seasonality significantly impacts earnings. Our analysis, based on data from the past 12 months, shows that the peak revenue month for STRs in Hallandale Beach City Center is typically December, while September often presents the lowest earnings, highlighting opportunities for strategic pricing adjustments during shoulder and low seasons. Explore the typical Airbnb income in Hallandale Beach City Center across different performance tiers:
- Best-in-class properties (Top 10%) achieve $7,006+ monthly, often utilizing dynamic pricing and superior guest experiences.
- Strong performing properties (Top 25%) earn $5,005 or more, indicating effective management and desirable locations/amenities.
- Typical properties (Median) generate around $2,513 per month, representing the average market performance.
- Entry-level properties (Bottom 25%) see earnings around $995, often with potential for optimization.
Average Monthly Airbnb Earnings Trend in Hallandale Beach City Center
Hallandale Beach City Center Airbnb Occupancy Rate Trends (2026)
Maximize your bookings by understanding the Hallandale Beach City Center STR occupancy trends. Seasonal demand shifts significantly influence how often properties are booked. Typically, Decembersees the highest demand (peak season occupancy), while September experiences the lowest (low season). Effective strategies, like adjusting minimum stays or offering promotions, can boost occupancy during slower periods. Here's how different property tiers perform in Hallandale Beach City Center:
- Best-in-class properties (Top 10%) achieve 81%+ occupancy, indicating high desirability and potentially optimized availability.
- Strong performing properties (Top 25%) maintain 64% or higher occupancy, suggesting good market fit and guest satisfaction.
- Typical properties (Median) have an occupancy rate around 37%.
- Entry-level properties (Bottom 25%) average 22% occupancy, potentially facing higher vacancy.
Average Monthly Occupancy Rate Trend in Hallandale Beach City Center
Average Daily Rate (ADR) Airbnb Trends in Hallandale Beach City Center (2026)
Effective short term rental pricing strategy in Hallandale Beach City Center involves understanding monthly ADR fluctuations. The Average Daily Rate (ADR) for Airbnb in Hallandale Beach City Center typically peaks in September and dips lowest during August. Leveraging Airbnb dynamic pricing tools or strategies based on this seasonality can significantly boost revenue. Here's a look at the typical nightly rates achieved:
- Best-in-class properties (Top 10%) command rates of $676+ per night, often due to premium features or locations.
- Strong performing properties (Top 25%) achieve nightly rates of $287 or more.
- Typical properties (Median) charge around $183 per night.
- Entry-level properties (Bottom 25%) earn around $125 per night.
Average Daily Rate (ADR) Trend by Month in Hallandale Beach City Center
Get Live Hallandale Beach City Center Market Intelligence 👇
Explore Real-time Analytics
Airbnb Seasonality Analysis & Trends in Hallandale Beach City Center (2026)
Peak Season (December, January, October)
- Revenue averages $4,680 per month
- Occupancy rates average 45.8%
- Daily rates average $256
Shoulder Season
- Revenue averages $2,295 per month
- Occupancy maintains around 27.1%
- Daily rates hold near $250
Low Season (April, May, June)
- Revenue drops to average $0 per month
- Occupancy decreases to average 0.0%
- Daily rates adjust to average $252
Seasonality Insights for Hallandale Beach City Center
- The Airbnb seasonality in Hallandale Beach City Center shows highly seasonal trends requiring careful strategy. While the sections above show seasonal averages, it's also insightful to look at the extremes:
- During the high season, the absolute peak month showcases Hallandale Beach City Center's highest earning potential, with monthly revenues capable of climbing to $5,382, occupancy reaching a high of 50.5%, and ADRs peaking at $278.
- Conversely, the slowest single month of the year, typically falling within the low season, marks the market's lowest point. In this month, revenue might dip to $0, occupancy could drop to 0.0%, and ADRs may adjust down to $219.
- Understanding both the seasonal averages and these monthly peaks and troughs in revenue, occupancy, and ADR is crucial for maximizing your Airbnb profit potential in Hallandale Beach City Center.
Seasonal Strategies for Maximizing Profit
- Peak Season: Maximize revenue through premium pricing and potentially longer minimum stays. Ensure high availability.
- Low Season: Offer competitive pricing, special promotions (e.g., extended stay discounts), and flexible cancellation policies. Target off-season travelers like remote workers or budget-conscious guests.
- Shoulder Seasons: Implement dynamic pricing that balances peak and low rates. Target weekend travelers or specific events. Offer slightly more flexible terms than peak season.
- Regularly analyze your own performance against these Hallandale Beach City Center seasonality benchmarks and adjust your pricing and availability strategy accordingly.
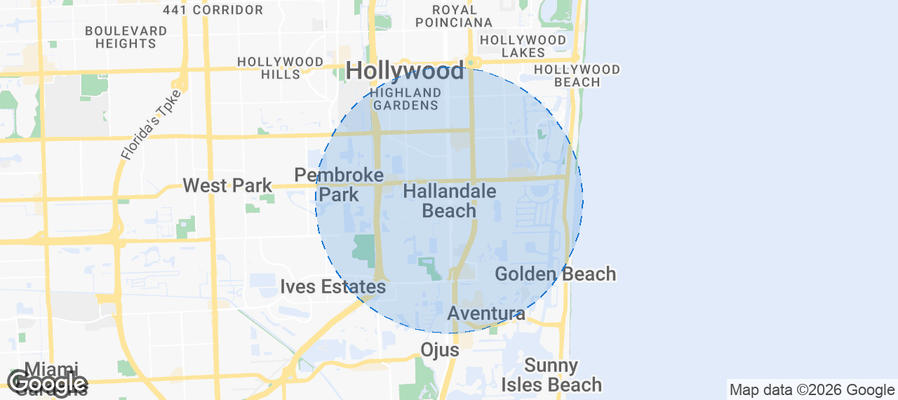
Best Areas for Airbnb Investment in Hallandale Beach City Center (2026)
Exploring the top neighborhoods for short-term rentals in Hallandale Beach City Center? This section highlights key areas, outlining why they are attractive for hosts and guests, along with notable local attractions. Consider these locations based on your target guest profile and investment strategy.
| Neighborhood / Area | Why Host Here? (Target Guests & Appeal) | Key Attractions & Landmarks |
|---|---|---|
| Hallandale Beach | A beautiful coastal city known for its stunning beaches, vibrant nightlife, and proximity to Miami and Fort Lauderdale. It's a prime location for vacationers seeking sun and entertainment. | Hallandale Beach, Gulfstream Park Racing & Casino, The Village at Gulfstream Park, Aventura Mall, Dania Beach, Hollywood Beach Broadwalk |
| Golden Isles | A serene residential neighborhood surrounded by waterways and luxury homes. Ideal for travelers seeking a peaceful getaway combined with easy beach access. | Golden Isles Community Center, Waterway Park, Intracoastal Waterway, Beaches nearby |
| Aquapark at Hallandale | A popular water park destination that attracts families with children, making it a fantastic choice for hosts looking to cater to family vacations. | Aquapark, Parks and Playgrounds, Family-friendly restaurants |
| The Diplomat Beach Resort | Exclusive beachfront hotel that attracts high-end guests and vacationers, creating potential for Airbnb hosts to offer luxury stays. | Diplomat Beach Resort, Spa Services, Dining Options, Beach Access |
| Westin Diplomat | Another luxury hotel with fantastic amenities, drawing in visitors seeking a premium vacation experience. Great for hosts offering high-end accommodations. | Westin Diplomat Resort, Fine Dining, Golf Course |
| Hollywood Beach | Just south of Hallandale Beach, known for its beautiful boardwalk and beach bars. A vibrant location attracting a diverse crowd. | Hollywood Beach Boardwalk, Hollywood Beach, Restaurants and Bars, Entertainment Venues |
| Aventura | Upscale shopping area and residential community nearby, appealing to families and tourists looking for retail experiences and luxury living. | Aventura Mall, Founders Park, Aventura Arts & Cultural Center |
| Sunny Isles Beach | Lively beach town just north of Hallandale, known for its high-rise resorts and stunning ocean views, appealing to vacationers from around the world. | Sunny Isles Beach, Oleta River State Park, Restaurants and Nightlife, Shopping Centers |
Understanding Airbnb License Requirements & STR Laws in Hallandale Beach City Center (2026)
While Hallandale Beach City Center, Florida, United States currently shows low STR regulations, specific Airbnb license requirements might still exist or change. Always verify the latest short term rental regulations and Airbnb license requirements directly with local government authorities for Hallandale Beach City Center to ensure full compliance before hosting.
(Source: AirROI data, 2026, finding no licensed listings among those analyzed)
Top Performing Airbnb Properties in Hallandale Beach City Center (2026)
Benchmark your potential! Explore examples of top-performing Airbnb properties in Hallandale Beach City Centerbased on Trailing Twelve Month (TTM) revenue. Analyze their characteristics, revenue, occupancy rate, and ADR to understand what drives success in this market.

Hallendale Beach Waterfront Modern Home, Pool &BBQ
Entire Place • 5 bedrooms

Waterfront Luxe Condo | Walking Distance to Beach
Entire Place • 3 bedrooms

Luxury 3BR/3BA Ocean View – Beachwalk Resort
Entire Place • 3 bedrooms

{Seashell} Lux Design ~ II King Beds ~ Beach
Entire Place • 2 bedrooms

OCEAN Front Luxury 3BR 3BA Condo With Water Views
Entire Place • 3 bedrooms

Amazing 1BR Apartment + Pool + Fitness Center
Entire Place • 1 bedroom
Note: Performance varies based on location, size, amenities, seasonality, and management quality. Data reflects the past 12 months.
Top Performing Airbnb Hosts in Hallandale Beach City Center (2026)
Learn from the best! This table showcases top-performing Airbnb hosts in Hallandale Beach City Center based on the number of properties managed and estimated total revenue over the past year. Analyze their scale and performance metrics.
| Host Name | Properties | Grossing Revenue | Stay Reviews | Avg Rating |
|---|---|---|---|---|
| Dream Villas | 1 | $199,479 | 8 | 4.38/5.0 |
| Victoria Rentals | 6 | $55,734 | 24 | 4.49/5.0 |
| Angel | 1 | $55,689 | 17 | 5.00/5.0 |
| Real Jade Group | 1 | $44,388 | 9 | 4.78/5.0 |
| Jarrett | 1 | $42,310 | 39 | 4.97/5.0 |
| Robert | 1 | $41,194 | 24 | 5.00/5.0 |
| The Beachwalk Resort | 2 | $18,650 | 3 | Not Rated |
| Stay Sol | 1 | $16,018 | 12 | 4.42/5.0 |
| Stay Sol | 1 | $8,603 | 2 | Not Rated |
| Stay Sol | 1 | $7,265 | 1 | Not Rated |
Analyzing the strategies of top hosts, such as their property selection, pricing, and guest communication, can offer valuable lessons for optimizing your own Airbnb operations in Hallandale Beach City Center.
Dive Deeper: Advanced Hallandale Beach City Center STR Market Data (2026)
Ready to unlock more insights? AirROI provides access to advanced metrics and comprehensive Airbnb data for Hallandale Beach City Center. Explore detailed analytics beyond this report to refine your investment strategy, optimize pricing, and maximize your vacation rental profits.
Explore Advanced MetricsHallandale Beach City Center Short-Term Rental Market Composition (2026): Property & Room Types
Room Type Distribution
Property Type Distribution
Market Composition Insights for Hallandale Beach City Center
- The Hallandale Beach City Center Airbnb market composition is heavily skewed towards Entire Home/Apt listings, which make up 100% of the 19 active rentals. This indicates strong guest preference for privacy and space.
- Looking at the property type distribution in Hallandale Beach City Center, Apartment/Condo properties are the most common (94.7%), reflecting the local real estate landscape.
Hallandale Beach City Center Airbnb Room Capacity Analysis (2026): Bedroom Distribution
Distribution of Listings by Number of Bedrooms
Room Capacity Insights for Hallandale Beach City Center
- The dominant room capacity in Hallandale Beach City Center is 1 bedroom listings, making up 52.6% of the market. This suggests a strong demand for properties suitable for couples or solo travelers.
- Together, 1 bedroom and 3 bedrooms properties represent 68.4% of the active Airbnb listings in Hallandale Beach City Center, indicating a high concentration in these sizes.
- With over half the market (52.6%) consisting of studios or 1-bedroom units, Hallandale Beach City Center is particularly well-suited for individuals or couples.
- A significant 21.1% of listings offer 3+ bedrooms, catering to larger groups and families seeking more space in Hallandale Beach City Center.
Hallandale Beach City Center Vacation Rental Guest Capacity Trends (2026)
Distribution of Listings by Guest Capacity
Guest Capacity Insights for Hallandale Beach City Center
- The most common guest capacity trend in Hallandale Beach City Center vacation rentals is listings accommodating 4 guests (57.9%). This suggests the primary traveler segment is likely small families or groups.
- Properties designed for 4 guests and 8+ guests dominate the Hallandale Beach City Center STR market, accounting for 73.7% of listings.
- 31.6% of properties accommodate 6+ guests, serving the market segment for larger families or group travel in Hallandale Beach City Center.
- On average, properties in Hallandale Beach City Center are equipped to host 4.8 guests.
Hallandale Beach City Center Airbnb Booking Patterns (2026): Available vs. Booked Days
Available Days Distribution
Booked Days Distribution
Booking Pattern Insights for Hallandale Beach City Center
- The most common availability pattern in Hallandale Beach City Center falls within the 271-366 days range, representing 68.4% of listings. This suggests many properties have significant open periods on their calendars.
- Approximately 94.7% of listings show high availability (181+ days open annually), indicating potential for increased bookings or specific owner usage patterns.
- For booked days, the 31-90 days range is most frequent in Hallandale Beach City Center (36.8%), reflecting common guest stay durations or potential owner blocking patterns.
- A notable 5.3% of properties secure long booking periods (181+ days booked per year), highlighting successful long-term rental strategies or significant owner usage.
Hallandale Beach City Center Airbnb Minimum Stay Requirements Analysis
Distribution of Listings by Minimum Night Requirement
1 Night
5 listings
26.3% of total
2 Nights
1 listings
5.3% of total
3 Nights
3 listings
15.8% of total
30+ Nights
10 listings
52.6% of total
Key Insights
- The most prevalent minimum stay requirement in Hallandale Beach City Center is 30+ Nights, adopted by 52.6% of listings. This highlights the market's preference for longer commitments.
- A significant segment (52.6%) caters to monthly stays (30+ nights) in Hallandale Beach City Center, pointing to opportunities in the extended-stay market.
Recommendations
- Align with the market by considering a 30+ Nights minimum stay, as 52.6% of Hallandale Beach City Center hosts use this setting.
- If feasible, allowing 1-night stays, especially midweek or during low season, could capture last-minute bookings, as only 26.3% currently do.
- Explore offering discounts for stays of 30+ nights to attract the 52.6% of the market seeking extended stays.
- Adjust minimum nights based on seasonality – potentially shorter during low season and longer during peak demand periods in Hallandale Beach City Center.
Hallandale Beach City Center Airbnb Cancellation Policy Trends Analysis (2026)
Limited
1 listings
5.3% of total
Flexible
2 listings
10.5% of total
Moderate
2 listings
10.5% of total
Firm
12 listings
63.2% of total
Strict
2 listings
10.5% of total
Cancellation Policy Insights for Hallandale Beach City Center
- The prevailing Airbnb cancellation policy trend in Hallandale Beach City Center is Firm, used by 63.2% of listings.
- A majority (73.7%) of hosts in Hallandale Beach City Center utilize Firm or Strict policies, indicating a market where hosts prioritize booking security.
Recommendations for Hosts
- Consider adopting a Firm policy to align with the 63.2% market standard in Hallandale Beach City Center.
- Using a Strict policy might deter some guests, as only 10.5% of listings use it. Evaluate if potential revenue protection outweighs possible lower booking rates.
- Regularly review your cancellation policy against competitors and market demand shifts in Hallandale Beach City Center.
Hallandale Beach City Center STR Booking Lead Time Analysis (2026)
Average Booking Lead Time by Month
Booking Lead Time Insights for Hallandale Beach City Center
- The overall average booking lead time for vacation rentals in Hallandale Beach City Center is 28 days.
- Guests book furthest in advance for stays during November (average 42 days), likely coinciding with peak travel demand or local events.
- The shortest booking windows occur for stays in June (average 0 days), indicating more last-minute travel plans during this time.
- Seasonally, Fall (29 days avg.) sees the longest lead times, while Spring (0 days avg.) has the shortest, reflecting typical travel planning cycles.
Recommendations for Hosts
- Use the overall average lead time (28 days) as a baseline for your pricing and availability strategy in Hallandale Beach City Center.
- For November stays, consider implementing length-of-stay discounts or slightly higher rates for bookings made less than 42 days out to capitalize on advance planning.
- During June, focus on last-minute booking availability and promotions, as guests book with very short notice (0 days avg.).
- Target marketing efforts for the Fall season well in advance (at least 29 days) to capture early planners.
- Monitor your own booking lead times against these Hallandale Beach City Center averages to identify opportunities for dynamic pricing adjustments.
Popular & Essential Airbnb Amenities in Hallandale Beach City Center (2026)
Amenity Prevalence
Amenity Insights for Hallandale Beach City Center
- Essential amenities in Hallandale Beach City Center that guests expect include: Air conditioning, TV. Lacking these (any) could significantly impact bookings.
- Popular amenities like Smoke alarm, Wifi, Pool are common but not universal. Offering these can provide a competitive edge.
- A pool is a highly desired but not standard amenity, making it a key feature for attracting guests seeking leisure in Hallandale Beach City Center.
- Warning: Wifi is not universally provided but is considered essential globally. Ensure reliable Wifi is offered.
Recommendations for Hosts
- Ensure your listing includes all essential amenities for Hallandale Beach City Center: Air conditioning, TV.
- Consider adding popular differentiators like Smoke alarm or Wifi to increase appeal.
- Highlight unique or less common amenities you offer (e.g., hot tub, dedicated workspace, EV charger) in your listing description and photos.
- Regularly check competitor amenities in Hallandale Beach City Center to stay competitive.
Hallandale Beach City Center Airbnb Guest Demographics & Profile Analysis (2026)
Guest Profile Summary for Hallandale Beach City Center
- The typical guest profile for Airbnb in Hallandale Beach City Center consists of primarily domestic travelers (71%), often arriving from nearby New York, typically belonging to the Post-2000s (Gen Z/Alpha) group (50%), primarily speaking English or Spanish.
- Domestic travelers account for 70.9% of guests.
- Key international markets include United States (70.9%) and Canada (5.5%).
- Top languages spoken are English (66.7%) followed by Spanish (15.2%).
- A significant demographic segment is the Post-2000s (Gen Z/Alpha) group, representing 50% of guests.
Recommendations for Hosts
- Target domestic marketing efforts towards travelers from New York and Miami.
- Tailor amenities and listing descriptions to appeal to the dominant Post-2000s (Gen Z/Alpha) demographic (e.g., highlight fast WiFi, smart home features, local guides).
- Highlight unique local experiences or amenities relevant to the primary guest profile.
- Consider seasonal promotions aligned with peak travel times for key origin markets.
Nearby Short-Term Rental Market Comparison
How does the Hallandale Beach City Center Airbnb market stack up against its neighbors? Compare key performance metrics like average monthly revenue, ADR, and occupancy rates in surrounding areas to understand the broader regional STR landscape.
| Market | Active Properties | Monthly Revenue | Daily Rate | Avg. Occupancy |
|---|---|---|---|---|
| Stock Island | 107 | $9,731 | $733.54 | 47% |
| Bal Harbour Village | 37 | $8,846 | $850.63 | 34% |
| Key West | 1,137 | $7,525 | $630.09 | 47% |
| Lake Clarke Shores | 26 | $6,710 | $516.52 | 46% |
| Lighthouse Point | 75 | $6,205 | $472.94 | 51% |
| Pinecrest | 11 | $6,117 | $861.24 | 43% |
| North Bay Village | 120 | $6,032 | $561.12 | 44% |
| Duck Key | 60 | $5,308 | $504.94 | 43% |
| Little Torch Key | 20 | $5,131 | $701.83 | 29% |
| Tequesta | 43 | $4,920 | $376.96 | 50% |