Inglis Airbnb Market Analysis 2026: Short Term Rental Data & Vacation Rental Statistics in Florida, United States
Is Airbnb profitable in Inglis in 2026? Explore comprehensive Airbnb analytics for Inglis, Florida, United States to uncover income potential. This 2026 STR market report for Inglis, based on AirROI data from February 2025 to January 2026, reveals key trends in the niche market of 36 active listings.
Whether you're considering an Airbnb investment in Inglis, optimizing your existing vacation rental, or exploring rental arbitrage opportunities, understanding the Inglis Airbnb data is crucial. Leveraging the low regulation environment is key to maximizing your short term rental income potential. Let's dive into the specifics.
Key Inglis Airbnb Performance Metrics Overview
Monthly Airbnb Revenue Variations & Income Potential in Inglis (2026)
Understanding the monthly revenue variations for Airbnb listings in Inglis is key to maximizing your short term rental income potential. Seasonality significantly impacts earnings. Our analysis, based on data from the past 12 months, shows that the peak revenue month for STRs in Inglis is typically March, while December often presents the lowest earnings, highlighting opportunities for strategic pricing adjustments during shoulder and low seasons. Explore the typical Airbnb income in Inglis across different performance tiers:
- Best-in-class properties (Top 10%) achieve $4,304+ monthly, often utilizing dynamic pricing and superior guest experiences.
- Strong performing properties (Top 25%) earn $2,580 or more, indicating effective management and desirable locations/amenities.
- Typical properties (Median) generate around $1,603 per month, representing the average market performance.
- Entry-level properties (Bottom 25%) see earnings around $828, often with potential for optimization.
Average Monthly Airbnb Earnings Trend in Inglis
Inglis Airbnb Occupancy Rate Trends (2026)
Maximize your bookings by understanding the Inglis STR occupancy trends. Seasonal demand shifts significantly influence how often properties are booked. Typically, Marchsees the highest demand (peak season occupancy), while December experiences the lowest (low season). Effective strategies, like adjusting minimum stays or offering promotions, can boost occupancy during slower periods. Here's how different property tiers perform in Inglis:
- Best-in-class properties (Top 10%) achieve 65%+ occupancy, indicating high desirability and potentially optimized availability.
- Strong performing properties (Top 25%) maintain 46% or higher occupancy, suggesting good market fit and guest satisfaction.
- Typical properties (Median) have an occupancy rate around 31%.
- Entry-level properties (Bottom 25%) average 16% occupancy, potentially facing higher vacancy.
Average Monthly Occupancy Rate Trend in Inglis
Average Daily Rate (ADR) Airbnb Trends in Inglis (2026)
Effective short term rental pricing strategy in Inglis involves understanding monthly ADR fluctuations. The Average Daily Rate (ADR) for Airbnb in Inglis typically peaks in January and dips lowest during April. Leveraging Airbnb dynamic pricing tools or strategies based on this seasonality can significantly boost revenue. Here's a look at the typical nightly rates achieved:
- Best-in-class properties (Top 10%) command rates of $252+ per night, often due to premium features or locations.
- Strong performing properties (Top 25%) achieve nightly rates of $205 or more.
- Typical properties (Median) charge around $166 per night.
- Entry-level properties (Bottom 25%) earn around $132 per night.
Average Daily Rate (ADR) Trend by Month in Inglis
Get Live Inglis Market Intelligence 👇

Explore Real-time Analytics
Airbnb Seasonality Analysis & Trends in Inglis (2026)
Peak Season (March, February, April)
- Revenue averages $2,840 per month
- Occupancy rates average 50.6%
- Daily rates average $167
Shoulder Season
- Revenue averages $1,976 per month
- Occupancy maintains around 31.1%
- Daily rates hold near $183
Low Season (May, September, December)
- Revenue drops to average $1,344 per month
- Occupancy decreases to average 22.9%
- Daily rates adjust to average $183
Seasonality Insights for Inglis
- The Airbnb seasonality in Inglis shows highly seasonal trends requiring careful strategy. While the sections above show seasonal averages, it's also insightful to look at the extremes:
- During the high season, the absolute peak month showcases Inglis's highest earning potential, with monthly revenues capable of climbing to $3,522, occupancy reaching a high of 64.1%, and ADRs peaking at $195.
- Conversely, the slowest single month of the year, typically falling within the low season, marks the market's lowest point. In this month, revenue might dip to $1,187, occupancy could drop to 20.9%, and ADRs may adjust down to $164.
- Understanding both the seasonal averages and these monthly peaks and troughs in revenue, occupancy, and ADR is crucial for maximizing your Airbnb profit potential in Inglis.
Seasonal Strategies for Maximizing Profit
- Peak Season: Maximize revenue through premium pricing and potentially longer minimum stays. Ensure high availability.
- Low Season: Offer competitive pricing, special promotions (e.g., extended stay discounts), and flexible cancellation policies. Target off-season travelers like remote workers or budget-conscious guests.
- Shoulder Seasons: Implement dynamic pricing that balances peak and low rates. Target weekend travelers or specific events. Offer slightly more flexible terms than peak season.
- Regularly analyze your own performance against these Inglis seasonality benchmarks and adjust your pricing and availability strategy accordingly.
Best Areas for Airbnb Investment in Inglis (2026)
Exploring the top neighborhoods for short-term rentals in Inglis? This section highlights key areas, outlining why they are attractive for hosts and guests, along with notable local attractions. Consider these locations based on your target guest profile and investment strategy.
| Neighborhood / Area | Why Host Here? (Target Guests & Appeal) | Key Attractions & Landmarks |
|---|---|---|
| Lake Tsala Apopka | A beautiful natural lake known for its recreational activities such as fishing, boating, and kayaking. This area attracts nature lovers and those looking to escape to a serene environment. | Lake Tsala Apopka, Fishing spots, Boating facilities, Nature trails, Wildlife observation |
| Homosassa Springs | Famous for its wildlife park and scenic springs. A family-friendly destination that draws visitors interested in wildlife and outdoor activities. | Homosassa Springs Wildlife State Park, Scalloping, Manatee tours, River tours, Nature trails |
| Crystal River | Known for its stunning river and manatee populations, ideal for eco-tourism and outdoor adventures. A great spot for families and nature enthusiasts. | Crystal River Manatee Tours, Kayaking in Crystal River, Three Sisters Springs, Withlacoochee State Forest, Fishing charters |
| Inglis State Park | A natural preserve that offers hiking, fishing and outdoor recreation. A perfect getaway for those looking to enjoy Florida's natural beauty. | Inglis River, Fishing spots, Hiking trails, Wildlife viewing, Picnic areas |
| Chassahowitzka National Wildlife Refuge | A natural refuge offering a rich ecosystem and a chance to see diverse wildlife. Attracts visitors for eco-tourism and outdoor adventures. | Kayaking, Bird watching, Wildlife trails, Scenic viewpoints, Fishing spots |
| Citrus Springs | A peaceful residential community known for its natural springs and golf courses. Appeals to those seeking a quiet retreat with outdoor activities. | Citrus Springs Golf & Country Club, Citrus Springs community parks, Nature trails, Nearby springs, Kayaking opportunities |
| Yankeetown | A charming small town with access to the Withlacoochee River and coastal waters. Ideal for visitors looking for a quaint, relaxing atmosphere. | Withlacoochee River, Fishing, Boating, Historic downtown, Nature parks |
| Beverly Hills | Located near plenty of outdoor activities, this area is popular for its proximity to parks and recreational facilities, appealing to families and nature fans alike. | Beverly Hills neighbors parks, Golf courses, Biking trails, Nature walks, Community events |
Understanding Airbnb License Requirements & STR Laws in Inglis (2026)
While Inglis, Florida, United States currently shows low STR regulations, specific Airbnb license requirements might still exist or change. Always verify the latest short term rental regulations and Airbnb license requirements directly with local government authorities for Inglis to ensure full compliance before hosting.
(Source: AirROI data, 2026, finding no licensed listings among those analyzed)
Top Performing Airbnb Properties in Inglis (2026)
Benchmark your potential! Explore examples of top-performing Airbnb properties in Inglisbased on Trailing Twelve Month (TTM) revenue. Analyze their characteristics, revenue, occupancy rate, and ADR to understand what drives success in this market.
Three Houses on the River
Entire Place • 5 bedrooms
Riverfront Fisher’s Paradise in Florida w/ Dock!
Entire Place • 2 bedrooms
Old Florida Lodge Riverfront
Entire Place • 4 bedrooms
Withlacoochee River, big wood deck over the water
Entire Place • 2 bedrooms
Country Living with a Twist
Entire Place • 3 bedrooms
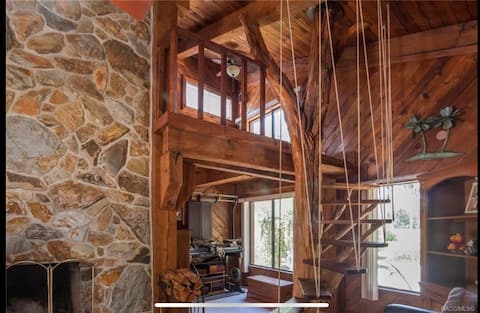
Unique Treehouse on the River
Entire Place • 3 bedrooms
Note: Performance varies based on location, size, amenities, seasonality, and management quality. Data reflects the past 12 months.
Top Performing Airbnb Hosts in Inglis (2026)
Learn from the best! This table showcases top-performing Airbnb hosts in Inglis based on the number of properties managed and estimated total revenue over the past year. Analyze their scale and performance metrics.
| Host Name | Properties | Grossing Revenue | Stay Reviews | Avg Rating |
|---|---|---|---|---|
| Jacqueline | 4 | $128,779 | 122 | 4.96/5.0 |
| Evolve | 10 | $124,417 | 245 | 4.78/5.0 |
| Dave And Ursula | 2 | $43,915 | 86 | 4.97/5.0 |
| Bryan | 1 | $41,886 | 76 | 4.79/5.0 |
| Connie | 9 | $40,197 | 36 | 4.86/5.0 |
| Starla | 1 | $39,826 | 53 | 4.85/5.0 |
| John | 1 | $26,250 | 25 | 5.00/5.0 |
| Dan | 1 | $17,680 | 13 | 5.00/5.0 |
| Tom | 1 | $17,366 | 260 | 4.92/5.0 |
| Scott And Susan | 1 | $16,424 | 40 | 4.98/5.0 |
Analyzing the strategies of top hosts, such as their property selection, pricing, and guest communication, can offer valuable lessons for optimizing your own Airbnb operations in Inglis.
Dive Deeper: Advanced Inglis STR Market Data (2026)
Ready to unlock more insights? AirROI provides access to advanced metrics and comprehensive Airbnb data for Inglis. Explore detailed analytics beyond this report to refine your investment strategy, optimize pricing, and maximize your vacation rental profits.
Explore Advanced MetricsInglis Short-Term Rental Market Composition (2026): Property & Room Types
Room Type Distribution
Property Type Distribution
Market Composition Insights for Inglis
- The Inglis Airbnb market composition is heavily skewed towards Entire Home/Apt listings, which make up 88.9% of the 36 active rentals. This indicates strong guest preference for privacy and space.
- Looking at the property type distribution in Inglis, House properties are the most common (63.9%), reflecting the local real estate landscape.
- Houses represent a significant 63.9% portion, catering likely to families or larger groups.
- The presence of 25% Hotel/Boutique listings indicates integration with traditional hospitality.
- Smaller segments like outdoor/unique (combined 2.8%) offer potential for unique stay experiences.
Inglis Airbnb Room Capacity Analysis (2026): Bedroom Distribution
Distribution of Listings by Number of Bedrooms
Room Capacity Insights for Inglis
- The dominant room capacity in Inglis is 2 bedrooms listings, making up 33.3% of the market. This suggests a strong demand for properties suitable for couples or solo travelers.
- Together, 2 bedrooms and 1 bedroom properties represent 63.9% of the active Airbnb listings in Inglis, indicating a high concentration in these sizes.
- A significant 27.8% of listings offer 3+ bedrooms, catering to larger groups and families seeking more space in Inglis.
Inglis Vacation Rental Guest Capacity Trends (2026)
Distribution of Listings by Guest Capacity
Guest Capacity Insights for Inglis
- The most common guest capacity trend in Inglis vacation rentals is listings accommodating 4 guests (27.8%). This suggests the primary traveler segment is likely small families or groups.
- Properties designed for 4 guests and 6 guests dominate the Inglis STR market, accounting for 50.0% of listings.
- 44.4% of properties accommodate 6+ guests, serving the market segment for larger families or group travel in Inglis.
- On average, properties in Inglis are equipped to host 5.0 guests.
Inglis Airbnb Booking Patterns (2026): Available vs. Booked Days
Available Days Distribution
Booked Days Distribution
Booking Pattern Insights for Inglis
- The most common availability pattern in Inglis falls within the 271-366 days range, representing 61.1% of listings. This suggests many properties have significant open periods on their calendars.
- Approximately 91.7% of listings show high availability (181+ days open annually), indicating potential for increased bookings or specific owner usage patterns.
- For booked days, the 31-90 days range is most frequent in Inglis (36.1%), reflecting common guest stay durations or potential owner blocking patterns.
- A notable 8.3% of properties secure long booking periods (181+ days booked per year), highlighting successful long-term rental strategies or significant owner usage.
Inglis Airbnb Minimum Stay Requirements Analysis
Distribution of Listings by Minimum Night Requirement
1 Night
10 listings
27.8% of total
2 Nights
14 listings
38.9% of total
3 Nights
5 listings
13.9% of total
4-6 Nights
2 listings
5.6% of total
7-29 Nights
1 listings
2.8% of total
30+ Nights
4 listings
11.1% of total
Key Insights
- The most prevalent minimum stay requirement in Inglis is 2 Nights, adopted by 38.9% of listings. This highlights the market's preference for shorter, flexible bookings.
- A strong majority (66.7%) of the Inglis Airbnb data shows acceptance of very short stays (1-2 nights), indicating a dynamic, high-turnover market.
- A significant segment (11.1%) caters to monthly stays (30+ nights) in Inglis, pointing to opportunities in the extended-stay market.
Recommendations
- Align with the market by considering a 2 Nights minimum stay, as 38.9% of Inglis hosts use this setting.
- If feasible, allowing 1-night stays, especially midweek or during low season, could capture last-minute bookings, as only 27.8% currently do.
- Explore offering discounts for stays of 30+ nights to attract the 11.1% of the market seeking extended stays.
- Adjust minimum nights based on seasonality – potentially shorter during low season and longer during peak demand periods in Inglis.
Inglis Airbnb Cancellation Policy Trends Analysis (2026)
Limited
1 listings
2.8% of total
Flexible
6 listings
16.7% of total
Moderate
11 listings
30.6% of total
Firm
8 listings
22.2% of total
Strict
10 listings
27.8% of total
Cancellation Policy Insights for Inglis
- The prevailing Airbnb cancellation policy trend in Inglis is Moderate, used by 30.6% of listings.
- There's a relatively balanced mix between guest-friendly (47.3%) and stricter (50.0%) policies, offering choices for different guest needs.
Recommendations for Hosts
- Consider adopting a Moderate policy to align with the 30.6% market standard in Inglis.
- Regularly review your cancellation policy against competitors and market demand shifts in Inglis.
Inglis STR Booking Lead Time Analysis (2026)
Average Booking Lead Time by Month
Booking Lead Time Insights for Inglis
- The overall average booking lead time for vacation rentals in Inglis is 46 days.
- Guests book furthest in advance for stays during February (average 94 days), likely coinciding with peak travel demand or local events.
- The shortest booking windows occur for stays in June (average 19 days), indicating more last-minute travel plans during this time.
- Seasonally, Winter (56 days avg.) sees the longest lead times, while Summer (45 days avg.) has the shortest, reflecting typical travel planning cycles.
Recommendations for Hosts
- Use the overall average lead time (46 days) as a baseline for your pricing and availability strategy in Inglis.
- For February stays, consider implementing length-of-stay discounts or slightly higher rates for bookings made less than 94 days out to capitalize on advance planning.
- Target marketing efforts for the Winter season well in advance (at least 56 days) to capture early planners.
- Monitor your own booking lead times against these Inglis averages to identify opportunities for dynamic pricing adjustments.
Popular & Essential Airbnb Amenities in Inglis (2026)
Amenity Prevalence
Amenity Insights for Inglis
- Essential amenities in Inglis that guests expect include: Air conditioning, Wifi, TV, Free parking on premises, Smoke alarm, Hot water, Coffee maker. Lacking these (any) could significantly impact bookings.
- Popular amenities like Fire extinguisher, Microwave, Refrigerator are common but not universal. Offering these can provide a competitive edge.
Recommendations for Hosts
- Ensure your listing includes all essential amenities for Inglis: Air conditioning, Wifi, TV, Free parking on premises, Smoke alarm, Hot water, Coffee maker.
- Prioritize adding missing essentials: Free parking on premises, Smoke alarm, Hot water, Coffee maker.
- Consider adding popular differentiators like Fire extinguisher or Microwave to increase appeal.
- Highlight unique or less common amenities you offer (e.g., hot tub, dedicated workspace, EV charger) in your listing description and photos.
- Regularly check competitor amenities in Inglis to stay competitive.
Inglis Airbnb Guest Demographics & Profile Analysis (2026)
Guest Profile Summary for Inglis
- The typical guest profile for Airbnb in Inglis consists of primarily domestic travelers (95%), often arriving from nearby Clearwater, typically belonging to the Post-2000s (Gen Z/Alpha) group (50%), primarily speaking English or Spanish.
- Domestic travelers account for 94.6% of guests.
- Key international markets include United States (94.6%) and DC (1.1%).
- Top languages spoken are English (84.8%) followed by Spanish (9.1%).
- A significant demographic segment is the Post-2000s (Gen Z/Alpha) group, representing 50% of guests.
Recommendations for Hosts
- Target domestic marketing efforts towards travelers from Clearwater and Tampa.
- Tailor amenities and listing descriptions to appeal to the dominant Post-2000s (Gen Z/Alpha) demographic (e.g., highlight fast WiFi, smart home features, local guides).
- Highlight unique local experiences or amenities relevant to the primary guest profile.
- Consider seasonal promotions aligned with peak travel times for key origin markets.
Nearby Short-Term Rental Market Comparison
How does the Inglis Airbnb market stack up against its neighbors? Compare key performance metrics like average monthly revenue, ADR, and occupancy rates in surrounding areas to understand the broader regional STR landscape.
| Market | Active Properties | Monthly Revenue | Daily Rate | Avg. Occupancy |
|---|---|---|---|---|
| St. Johns County | 12 | $6,964 | $592.43 | 47% |
| Reunion | 12 | $6,321 | $580.45 | 44% |
| Ponte Vedra Beach | 224 | $5,720 | $574.75 | 43% |
| Vilano Beach | 173 | $5,571 | $442.95 | 45% |
| Thonotosassa | 17 | $4,309 | $347.75 | 50% |
| Jacksonville Beach | 763 | $4,123 | $328.32 | 49% |
| Campbell | 22 | $4,011 | $343.05 | 51% |
| Hernando Beach | 83 | $3,741 | $297.76 | 45% |
| Saint Augustine | 1,749 | $3,586 | $287.24 | 46% |
| Polk County | 57 | $3,517 | $269.99 | 48% |