Lake Buena Vista Airbnb Market Analysis 2026: Short Term Rental Data & Vacation Rental Statistics in Florida, United States
Is Airbnb profitable in Lake Buena Vista in 2026? Explore comprehensive Airbnb analytics for Lake Buena Vista, Florida, United States to uncover income potential. This 2026 STR market report for Lake Buena Vista, based on AirROI data from February 2025 to January 2026, reveals key trends in the niche market of 156 active listings.
Whether you're considering an Airbnb investment in Lake Buena Vista, optimizing your existing vacation rental, or exploring rental arbitrage opportunities, understanding the Lake Buena Vista Airbnb data is crucial. Leveraging the low regulation environment is key to maximizing your short term rental income potential. Let's dive into the specifics.
Key Lake Buena Vista Airbnb Performance Metrics Overview
Monthly Airbnb Revenue Variations & Income Potential in Lake Buena Vista (2026)
Understanding the monthly revenue variations for Airbnb listings in Lake Buena Vista is key to maximizing your short term rental income potential. Seasonality significantly impacts earnings. Our analysis, based on data from the past 12 months, shows that the peak revenue month for STRs in Lake Buena Vista is typically April, while January often presents the lowest earnings, highlighting opportunities for strategic pricing adjustments during shoulder and low seasons. Explore the typical Airbnb income in Lake Buena Vista across different performance tiers:
- Best-in-class properties (Top 10%) achieve $7,304+ monthly, often utilizing dynamic pricing and superior guest experiences.
- Strong performing properties (Top 25%) earn $5,273 or more, indicating effective management and desirable locations/amenities.
- Typical properties (Median) generate around $2,882 per month, representing the average market performance.
- Entry-level properties (Bottom 25%) see earnings around $1,345, often with potential for optimization.
Average Monthly Airbnb Earnings Trend in Lake Buena Vista
Lake Buena Vista Airbnb Occupancy Rate Trends (2026)
Maximize your bookings by understanding the Lake Buena Vista STR occupancy trends. Seasonal demand shifts significantly influence how often properties are booked. Typically, Aprilsees the highest demand (peak season occupancy), while January experiences the lowest (low season). Effective strategies, like adjusting minimum stays or offering promotions, can boost occupancy during slower periods. Here's how different property tiers perform in Lake Buena Vista:
- Best-in-class properties (Top 10%) achieve 78%+ occupancy, indicating high desirability and potentially optimized availability.
- Strong performing properties (Top 25%) maintain 59% or higher occupancy, suggesting good market fit and guest satisfaction.
- Typical properties (Median) have an occupancy rate around 33%.
- Entry-level properties (Bottom 25%) average 15% occupancy, potentially facing higher vacancy.
Average Monthly Occupancy Rate Trend in Lake Buena Vista
Average Daily Rate (ADR) Airbnb Trends in Lake Buena Vista (2026)
Effective short term rental pricing strategy in Lake Buena Vista involves understanding monthly ADR fluctuations. The Average Daily Rate (ADR) for Airbnb in Lake Buena Vista typically peaks in December and dips lowest during September. Leveraging Airbnb dynamic pricing tools or strategies based on this seasonality can significantly boost revenue. Here's a look at the typical nightly rates achieved:
- Best-in-class properties (Top 10%) command rates of $372+ per night, often due to premium features or locations.
- Strong performing properties (Top 25%) achieve nightly rates of $326 or more.
- Typical properties (Median) charge around $277 per night.
- Entry-level properties (Bottom 25%) earn around $224 per night.
Average Daily Rate (ADR) Trend by Month in Lake Buena Vista
Get Live Lake Buena Vista Market Intelligence 👇

Explore Real-time Analytics
Airbnb Seasonality Analysis & Trends in Lake Buena Vista (2026)
Peak Season (April, March, February)
- Revenue averages $4,622 per month
- Occupancy rates average 48.5%
- Daily rates average $278
Shoulder Season
- Revenue averages $3,256 per month
- Occupancy maintains around 36.8%
- Daily rates hold near $279
Low Season (January, September, November)
- Revenue drops to average $2,761 per month
- Occupancy decreases to average 33.3%
- Daily rates adjust to average $277
Seasonality Insights for Lake Buena Vista
- The Airbnb seasonality in Lake Buena Vista shows highly seasonal trends requiring careful strategy. While the sections above show seasonal averages, it's also insightful to look at the extremes:
- During the high season, the absolute peak month showcases Lake Buena Vista's highest earning potential, with monthly revenues capable of climbing to $4,939, occupancy reaching a high of 50.8%, and ADRs peaking at $298.
- Conversely, the slowest single month of the year, typically falling within the low season, marks the market's lowest point. In this month, revenue might dip to $2,455, occupancy could drop to 25.8%, and ADRs may adjust down to $257.
- Understanding both the seasonal averages and these monthly peaks and troughs in revenue, occupancy, and ADR is crucial for maximizing your Airbnb profit potential in Lake Buena Vista.
Seasonal Strategies for Maximizing Profit
- Peak Season: Maximize revenue through premium pricing and potentially longer minimum stays. Ensure high availability.
- Low Season: Offer competitive pricing, special promotions (e.g., extended stay discounts), and flexible cancellation policies. Target off-season travelers like remote workers or budget-conscious guests.
- Shoulder Seasons: Implement dynamic pricing that balances peak and low rates. Target weekend travelers or specific events. Offer slightly more flexible terms than peak season.
- Regularly analyze your own performance against these Lake Buena Vista seasonality benchmarks and adjust your pricing and availability strategy accordingly.
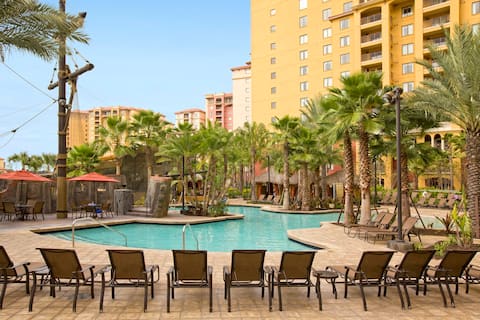
Best Areas for Airbnb Investment in Lake Buena Vista (2026)
Exploring the top neighborhoods for short-term rentals in Lake Buena Vista? This section highlights key areas, outlining why they are attractive for hosts and guests, along with notable local attractions. Consider these locations based on your target guest profile and investment strategy.
| Neighborhood / Area | Why Host Here? (Target Guests & Appeal) | Key Attractions & Landmarks |
|---|---|---|
| Disney Springs | A bustling shopping, dining, and entertainment district connected to the Walt Disney World Resort, making it immensely popular with families and tourists visiting the park. | The LEGO Store, World of Disney, Disney Springs Marketplace, House of Blues, Cirque du Soleil shows |
| Lake Buena Vista Village | A picturesque area with access to both residential and commercial spaces, attraction for visitors seeking a quieter stay close to Disney World. | Golf courses, Lake Buena Vista Factory Stores, nearby hotels and resorts, local dining options |
| Old Key West Resort | A themed Disney resort offering a taste of the Florida Keys ambiance, it attracts families and groups looking to enjoy Disney's amenities but with a relaxed atmosphere. | Olivia's Cafe, themed pools, basketball and tennis courts, walking trails |
| Saratoga Springs Resort | A lavish resort offering a serene environment along Lake Buena Vista, perfect for families and relaxation while being close to the Disney parks. | Saratoga Springs Spa, Lake Buena Vista Golf Course, nearby parks, nature trails |
| Port Orleans Resort | A beautifully themed resort reminiscent of the American South, this area attracts visitors looking for charm and proximity to theme parks. | Boat rental rentals, themed dining experiences, riverboat rides, courtyard pool |
| Hilton Orlando Bonnet Creek | Luxury hotel near Disney World with extensive amenities, a golf course, and large meeting spaces, drawing both families and business travelers. | Lazy river pool, Eight dining options, Spa at Hilton Bonnet Creek, golf course |
| Gaylord Palms Resort & Convention Center | A large resort featuring a water park and meeting spaces, popular with families visiting the nearby theme parks and large groups for events. | Water park, dining options, shopping, year-round events and shows |
| Walt Disney World Resort | The ultimate destination for visitors to Orlando, includes four theme parks and numerous hotels, making it a prime area for Airbnb hosting. | Magic Kingdom, Epcot, Disney's Hollywood Studios, Disney's Animal Kingdom |
Understanding Airbnb License Requirements & STR Laws in Lake Buena Vista (2026)
While Lake Buena Vista, Florida, United States currently shows low STR regulations, specific Airbnb license requirements might still exist or change. Always verify the latest short term rental regulations and Airbnb license requirements directly with local government authorities for Lake Buena Vista to ensure full compliance before hosting.
(Source: AirROI data, 2026, based on 1% licensed listings)
Top Performing Airbnb Properties in Lake Buena Vista (2026)
Benchmark your potential! Explore examples of top-performing Airbnb properties in Lake Buena Vistabased on Trailing Twelve Month (TTM) revenue. Analyze their characteristics, revenue, occupancy rate, and ADR to understand what drives success in this market.

3 Bedroom Deluxe at Bonnet Creek
Private Room • 3 bedrooms

Wyndham Bonnet Creek - 2 Bedroom Condo
Private Room • 2 bedrooms

2 bdrm Wyndham Bonnet Creek inside Disney
Entire Place • 2 bedrooms
2 Bedroom at Bonnet Creek Resort
Private Room • 2 bedrooms

Wyndham Bonnet Creek Resort | 2BR/2BA King Bed
Entire Place • 2 bedrooms

Wyndham Bonnet Creek - 2 Bedroom Condo
Private Room • 2 bedrooms
Note: Performance varies based on location, size, amenities, seasonality, and management quality. Data reflects the past 12 months.
Top Performing Airbnb Hosts in Lake Buena Vista (2026)
Learn from the best! This table showcases top-performing Airbnb hosts in Lake Buena Vista based on the number of properties managed and estimated total revenue over the past year. Analyze their scale and performance metrics.
| Host Name | Properties | Grossing Revenue | Stay Reviews | Avg Rating |
|---|---|---|---|---|
| Jason | 58 | $1,548,538 | 493 | 4.87/5.0 |
| Live Suite | 14 | $267,044 | 102 | 4.93/5.0 |
| ResortShare2 | 3 | $229,370 | 1274 | 4.93/5.0 |
| Katherine | 5 | $206,961 | 88 | 4.96/5.0 |
| Suite Match | 3 | $151,250 | 76 | 4.95/5.0 |
| William | 5 | $108,340 | 119 | 5.00/5.0 |
| Dalton | 5 | $81,664 | 54 | 4.92/5.0 |
| Trbo | 3 | $67,313 | 73 | 4.94/5.0 |
| Cindy | 1 | $61,614 | 18 | 5.00/5.0 |
| Kyle | 1 | $60,080 | 50 | 4.92/5.0 |
Analyzing the strategies of top hosts, such as their property selection, pricing, and guest communication, can offer valuable lessons for optimizing your own Airbnb operations in Lake Buena Vista.
Dive Deeper: Advanced Lake Buena Vista STR Market Data (2026)
Ready to unlock more insights? AirROI provides access to advanced metrics and comprehensive Airbnb data for Lake Buena Vista. Explore detailed analytics beyond this report to refine your investment strategy, optimize pricing, and maximize your vacation rental profits.
Explore Advanced MetricsLake Buena Vista Short-Term Rental Market Composition (2026): Property & Room Types
Room Type Distribution
Property Type Distribution
Market Composition Insights for Lake Buena Vista
- The Lake Buena Vista Airbnb market composition is heavily skewed towards Private Room listings, which make up 51.3% of the 156 active rentals. This indicates strong guest preference for privacy and space.
- Looking at the property type distribution in Lake Buena Vista, Hotel/Boutique properties are the most common (52.6%), reflecting the local real estate landscape.
- The presence of 52.6% Hotel/Boutique listings indicates integration with traditional hospitality.
- Smaller segments like outdoor/unique, house (combined 1.9%) offer potential for unique stay experiences.
Lake Buena Vista Airbnb Room Capacity Analysis (2026): Bedroom Distribution
Distribution of Listings by Number of Bedrooms
Room Capacity Insights for Lake Buena Vista
- The dominant room capacity in Lake Buena Vista is 2 bedrooms listings, making up 54.5% of the market. This suggests a strong demand for properties suitable for couples or solo travelers.
- Together, 2 bedrooms and 1 bedroom properties represent 93.0% of the active Airbnb listings in Lake Buena Vista, indicating a high concentration in these sizes.
- Listings with 3+ bedrooms (6.3%) represent a smaller niche, potentially indicating an underserved market for larger group accommodations in Lake Buena Vista.
Lake Buena Vista Vacation Rental Guest Capacity Trends (2026)
Distribution of Listings by Guest Capacity
Guest Capacity Insights for Lake Buena Vista
- The most common guest capacity trend in Lake Buena Vista vacation rentals is listings accommodating 8+ guests (58.3%). This suggests the primary traveler segment is likely larger groups.
- Properties designed for 8+ guests and 4 guests dominate the Lake Buena Vista STR market, accounting for 94.2% of listings.
- 60.9% of properties accommodate 6+ guests, serving the market segment for larger families or group travel in Lake Buena Vista.
- On average, properties in Lake Buena Vista are equipped to host 6.3 guests.
Lake Buena Vista Airbnb Booking Patterns (2026): Available vs. Booked Days
Available Days Distribution
Booked Days Distribution
Booking Pattern Insights for Lake Buena Vista
- The most common availability pattern in Lake Buena Vista falls within the 271-366 days range, representing 68.6% of listings. This suggests many properties have significant open periods on their calendars.
- Approximately 91.0% of listings show high availability (181+ days open annually), indicating potential for increased bookings or specific owner usage patterns.
- For booked days, the 31-90 days range is most frequent in Lake Buena Vista (33.3%), reflecting common guest stay durations or potential owner blocking patterns.
- A notable 9.6% of properties secure long booking periods (181+ days booked per year), highlighting successful long-term rental strategies or significant owner usage.
Lake Buena Vista Airbnb Minimum Stay Requirements Analysis
Distribution of Listings by Minimum Night Requirement
1 Night
8 listings
5.1% of total
2 Nights
91 listings
58.3% of total
3 Nights
8 listings
5.1% of total
4-6 Nights
14 listings
9% of total
7-29 Nights
2 listings
1.3% of total
30+ Nights
33 listings
21.2% of total
Key Insights
- The most prevalent minimum stay requirement in Lake Buena Vista is 2 Nights, adopted by 58.3% of listings. This highlights the market's preference for shorter, flexible bookings.
- A strong majority (63.4%) of the Lake Buena Vista Airbnb data shows acceptance of very short stays (1-2 nights), indicating a dynamic, high-turnover market.
- A significant segment (21.2%) caters to monthly stays (30+ nights) in Lake Buena Vista, pointing to opportunities in the extended-stay market.
Recommendations
- Align with the market by considering a 2 Nights minimum stay, as 58.3% of Lake Buena Vista hosts use this setting.
- If feasible, allowing 1-night stays, especially midweek or during low season, could capture last-minute bookings, as only 5.1% currently do.
- A 2-night minimum appears standard (58.3%). Consider this for weekends or peak periods.
- Explore offering discounts for stays of 30+ nights to attract the 21.2% of the market seeking extended stays.
- Adjust minimum nights based on seasonality – potentially shorter during low season and longer during peak demand periods in Lake Buena Vista.
Lake Buena Vista Airbnb Cancellation Policy Trends Analysis (2026)
Super Strict 60 Days
1 listings
0.6% of total
Super Strict 30 Days
2 listings
1.3% of total
Flexible
7 listings
4.5% of total
Moderate
5 listings
3.2% of total
Firm
47 listings
30.3% of total
Strict
93 listings
60% of total
Cancellation Policy Insights for Lake Buena Vista
- The prevailing Airbnb cancellation policy trend in Lake Buena Vista is Strict, used by 60% of listings.
- A majority (90.3%) of hosts in Lake Buena Vista utilize Firm or Strict policies, indicating a market where hosts prioritize booking security.
Recommendations for Hosts
- Consider adopting a Strict policy to align with the 60% market standard in Lake Buena Vista.
- With 60% using Strict terms, this is a viable option in Lake Buena Vista, particularly for high-value properties or during peak demand periods.
- Regularly review your cancellation policy against competitors and market demand shifts in Lake Buena Vista.
Lake Buena Vista STR Booking Lead Time Analysis (2026)
Average Booking Lead Time by Month
Booking Lead Time Insights for Lake Buena Vista
- The overall average booking lead time for vacation rentals in Lake Buena Vista is 45 days.
- Guests book furthest in advance for stays during November (average 54 days), likely coinciding with peak travel demand or local events.
- The shortest booking windows occur for stays in July (average 33 days), indicating more last-minute travel plans during this time.
- Seasonally, Fall (47 days avg.) sees the longest lead times, while Summer (39 days avg.) has the shortest, reflecting typical travel planning cycles.
Recommendations for Hosts
- Use the overall average lead time (45 days) as a baseline for your pricing and availability strategy in Lake Buena Vista.
- Target marketing efforts for the Fall season well in advance (at least 47 days) to capture early planners.
- Monitor your own booking lead times against these Lake Buena Vista averages to identify opportunities for dynamic pricing adjustments.
Popular & Essential Airbnb Amenities in Lake Buena Vista (2026)
Amenity Prevalence
Amenity Insights for Lake Buena Vista
- Essential amenities in Lake Buena Vista that guests expect include: Air conditioning, TV, Wifi, Smoke alarm, Pool, Kitchen. Lacking these (any) could significantly impact bookings.
- Popular amenities like Washer, Free parking on premises, Fire extinguisher are common but not universal. Offering these can provide a competitive edge.
Recommendations for Hosts
- Ensure your listing includes all essential amenities for Lake Buena Vista: Air conditioning, TV, Wifi, Smoke alarm, Pool, Kitchen.
- Prioritize adding missing essentials: Wifi, Smoke alarm, Pool, Kitchen.
- Consider adding popular differentiators like Washer or Free parking on premises to increase appeal.
- Highlight unique or less common amenities you offer (e.g., hot tub, dedicated workspace, EV charger) in your listing description and photos.
- Regularly check competitor amenities in Lake Buena Vista to stay competitive.
Lake Buena Vista Airbnb Guest Demographics & Profile Analysis (2026)
Guest Profile Summary for Lake Buena Vista
- The typical guest profile for Airbnb in Lake Buena Vista consists of primarily domestic travelers (88%), often arriving from nearby New York, typically belonging to the Post-2000s (Gen Z/Alpha) group (50%), primarily speaking English or Spanish.
- Domestic travelers account for 87.7% of guests.
- Key international markets include United States (87.7%) and Canada (4.6%).
- Top languages spoken are English (68.3%) followed by Spanish (14.9%).
- A significant demographic segment is the Post-2000s (Gen Z/Alpha) group, representing 50% of guests.
Recommendations for Hosts
- Target domestic marketing efforts towards travelers from New York and Tampa.
- Tailor amenities and listing descriptions to appeal to the dominant Post-2000s (Gen Z/Alpha) demographic (e.g., highlight fast WiFi, smart home features, local guides).
- Highlight unique local experiences or amenities relevant to the primary guest profile.
- Consider seasonal promotions aligned with peak travel times for key origin markets.
Nearby Short-Term Rental Market Comparison
How does the Lake Buena Vista Airbnb market stack up against its neighbors? Compare key performance metrics like average monthly revenue, ADR, and occupancy rates in surrounding areas to understand the broader regional STR landscape.
| Market | Active Properties | Monthly Revenue | Daily Rate | Avg. Occupancy |
|---|---|---|---|---|
| Sailfish Point | 19 | $16,709 | $1587.63 | 48% |
| Anna Maria island | 587 | $7,996 | $823.96 | 41% |
| Anna Maria | 56 | $6,434 | $692.96 | 52% |
| Reunion | 12 | $6,321 | $580.45 | 44% |
| Vilano Beach | 173 | $5,571 | $442.95 | 45% |
| Indian Rocks Beach | 842 | $5,560 | $419.63 | 49% |
| Melbourne Beach | 275 | $5,384 | $488.83 | 43% |
| Siesta Key | 1,175 | $5,206 | $518.91 | 42% |
| Belleair Beach | 94 | $5,086 | $339.65 | 53% |
| Bradenton Beach | 122 | $4,977 | $507.12 | 42% |