Lower Grand Lagoon Airbnb Market Analysis 2025: Short Term Rental Data & Vacation Rental Statistics in Florida, United States
Is Airbnb profitable in Lower Grand Lagoon in 2025? Explore comprehensive Airbnb analytics for Lower Grand Lagoon, Florida, United States to uncover income potential. This 2025 STR market report for Lower Grand Lagoon, based on AirROI data from June 2024 to May 2025, reveals key trends in the niche market of 20 active listings.
Whether you're considering an Airbnb investment in Lower Grand Lagoon, optimizing your existing vacation rental, or exploring rental arbitrage opportunities, understanding the Lower Grand Lagoon Airbnb data is crucial. Navigating the high regulation landscape is key to maximizing your short term rental income potential. Let's dive into the specifics.
Key Lower Grand Lagoon Airbnb Performance Metrics Overview
Monthly Airbnb Revenue Variations & Income Potential in Lower Grand Lagoon (2025)
Understanding the monthly revenue variations for Airbnb listings in Lower Grand Lagoon is key to maximizing your short term rental income potential. Seasonality significantly impacts earnings. Our analysis, based on data from the past 12 months, shows that the peak revenue month for STRs in Lower Grand Lagoon is typically February, while January often presents the lowest earnings, highlighting opportunities for strategic pricing adjustments during shoulder and low seasons. Explore the typical Airbnb income in Lower Grand Lagoon across different performance tiers:
- Best-in-class properties (Top 10%) achieve $3,914+ monthly, often utilizing dynamic pricing and superior guest experiences.
- Strong performing properties (Top 25%) earn $3,455 or more, indicating effective management and desirable locations/amenities.
- Typical properties (Median) generate around $1,747 per month, representing the average market performance.
- Entry-level properties (Bottom 25%) see earnings around $1,355, often with potential for optimization.
Average Monthly Airbnb Earnings Trend in Lower Grand Lagoon
Lower Grand Lagoon Airbnb Occupancy Rate Trends (2025)
Maximize your bookings by understanding the Lower Grand Lagoon STR occupancy trends. Seasonal demand shifts significantly influence how often properties are booked. Typically, Februarysees the highest demand (peak season occupancy), while January experiences the lowest (low season). Effective strategies, like adjusting minimum stays or offering promotions, can boost occupancy during slower periods. Here's how different property tiers perform in Lower Grand Lagoon:
- Best-in-class properties (Top 10%) achieve 74%+ occupancy, indicating high desirability and potentially optimized availability.
- Strong performing properties (Top 25%) maintain 55% or higher occupancy, suggesting good market fit and guest satisfaction.
- Typical properties (Median) have an occupancy rate around 37%.
- Entry-level properties (Bottom 25%) average 28% occupancy, potentially facing higher vacancy.
Average Monthly Occupancy Rate Trend in Lower Grand Lagoon
Average Daily Rate (ADR) Airbnb Trends in Lower Grand Lagoon (2025)
Effective short term rental pricing strategy in Lower Grand Lagoon involves understanding monthly ADR fluctuations. The Average Daily Rate (ADR) for Airbnb in Lower Grand Lagoon typically peaks in May and dips lowest during December. Leveraging Airbnb dynamic pricing tools or strategies based on this seasonality can significantly boost revenue. Here's a look at the typical nightly rates achieved:
- Best-in-class properties (Top 10%) command rates of $304+ per night, often due to premium features or locations.
- Strong performing properties (Top 25%) achieve nightly rates of $249 or more.
- Typical properties (Median) charge around $152 per night.
- Entry-level properties (Bottom 25%) earn around $110 per night.
Average Daily Rate (ADR) Trend by Month in Lower Grand Lagoon
Get Live Lower Grand Lagoon Market Intelligence 👇

Explore Real-time Analytics
Airbnb Seasonality Analysis & Trends in Lower Grand Lagoon (2025)
Peak Season (February, July, August)
- Revenue averages $3,997 per month
- Occupancy rates average 72.2%
- Daily rates average $175
Shoulder Season
- Revenue averages $1,926 per month
- Occupancy maintains around 34.7%
- Daily rates hold near $192
Low Season (January, June, December)
- Revenue drops to average $627 per month
- Occupancy decreases to average 24.5%
- Daily rates adjust to average $162
Seasonality Insights for Lower Grand Lagoon
- The Airbnb seasonality in Lower Grand Lagoon shows highly seasonal trends requiring careful strategy. While the sections above show seasonal averages, it's also insightful to look at the extremes:
- During the high season, the absolute peak month showcases Lower Grand Lagoon's highest earning potential, with monthly revenues capable of climbing to $4,305, occupancy reaching a high of 76.2%, and ADRs peaking at $248.
- Conversely, the slowest single month of the year, typically falling within the low season, marks the market's lowest point. In this month, revenue might dip to $0, occupancy could drop to 0.0%, and ADRs may adjust down to $146.
- Understanding both the seasonal averages and these monthly peaks and troughs in revenue, occupancy, and ADR is crucial for maximizing your Airbnb profit potential in Lower Grand Lagoon.
Seasonal Strategies for Maximizing Profit
- Peak Season: Maximize revenue through premium pricing and potentially longer minimum stays. Ensure high availability.
- Low Season: Offer competitive pricing, special promotions (e.g., extended stay discounts), and flexible cancellation policies. Target off-season travelers like remote workers or budget-conscious guests.
- Shoulder Seasons: Implement dynamic pricing that balances peak and low rates. Target weekend travelers or specific events. Offer slightly more flexible terms than peak season.
- Regularly analyze your own performance against these Lower Grand Lagoon seasonality benchmarks and adjust your pricing and availability strategy accordingly.
Best Areas for Airbnb Investment in Lower Grand Lagoon (2025)
Exploring the top neighborhoods for short-term rentals in Lower Grand Lagoon? This section highlights key areas, outlining why they are attractive for hosts and guests, along with notable local attractions. Consider these locations based on your target guest profile and investment strategy.
| Neighborhood / Area | Why Host Here? (Target Guests & Appeal) | Key Attractions & Landmarks |
|---|---|---|
| Panama City Beach | Known for its stunning beaches and vibrant nightlife, Panama City Beach is a top destination for tourists looking to enjoy sun, sand, and water activities. Its close proximity to attractions makes it appealing for Airbnb investments. | Gulf World Marine Park, Pier Park, St. Andrews State Park, Panama City Beach, Historic St. Andrews |
| Lower Grand Lagoon | A serene beachfront community with access to both the Gulf of Mexico and beautiful local parks. It offers a quieter alternative to the hustle and bustle of Panama City yet remains close to popular attractions. | Rick Seltzer Park, Grand Lagoon, Captain Anderson's Marina, Emerald Falls Family Recreation Center, Shipwreck Island Waterpark |
| Laguna Beach | This charming area boasts a laid-back vibe with beautiful coastal views. It's perfect for families and beach lovers looking for a relaxing getaway, making it an attractive option for Airbnb hosts. | Panhandle Helicopter, Laguna Beach, Nearby nature trails, Local markets, Art galleries |
| Thomas Drive | A popular area filled with family-friendly accommodations, shopping, and dining options. Thomas Drive is highly sought after by tourists, making it an ideal spot for Airbnb hosts to capture vacationers. | WonderWorks, Ripley's Believe It Or Not!, The Grand Theatre, Emerald Coast Zoo, Water sports activities |
| Shell Island | A hidden gem that offers pristine beaches and nature experiences. It's accessible by boat and attracts tourists looking for adventure and natural beauty, providing a niche market for Airbnb rentals. | Scenic views, Dolphin tours, Snorkeling spots, Wildlife viewing, Untouched beaches |
| St. Andrews State Park | A beautiful park offering outdoor activities such as hiking and swimming. This area attracts nature enthusiasts and families looking for outdoor adventures, which can be appealing for Airbnb hosting. | Nature trails, Swimming areas, Picnic spots, Wildlife watching, Beach access |
| West End of PCB | A quieter area of Panama City Beach that offers beautiful beach access without the crowds. Ideal for families and those wanting a peaceful vacation, making it an attractive option for Airbnb rentals. | Quiet beaches, Nearby dining options, Local parks, Fishing spots, Water sports rentals |
| South Lagoon | This area offers a mix of beach access and local amenities, making it a convenient spot for tourists. It's favored by families and groups looking for spacious accommodations close to the beach. | Beach access, Boating options, Restaurants and cafes, Local shops, Parks and recreation areas |
Understanding Airbnb License Requirements & STR Laws in Lower Grand Lagoon (2025)
Yes, Lower Grand Lagoon, Florida, United States enforces high STR regulations. Obtaining a license and ensuring compliance is almost certainly required according to current 2025 STR laws. Always verify the latest short term rental regulations and Airbnb license requirements directly with local government authorities for Lower Grand Lagoon to ensure full compliance before hosting.
(Source: AirROI data, 2025, based on 75% licensed listings)
Top Performing Airbnb Properties in Lower Grand Lagoon (2025)
Benchmark your potential! Explore examples of top-performing Airbnb properties in Lower Grand Lagoonbased on Trailing Twelve Month (TTM) revenue. Analyze their characteristics, revenue, occupancy rate, and ADR to understand what drives success in this market.
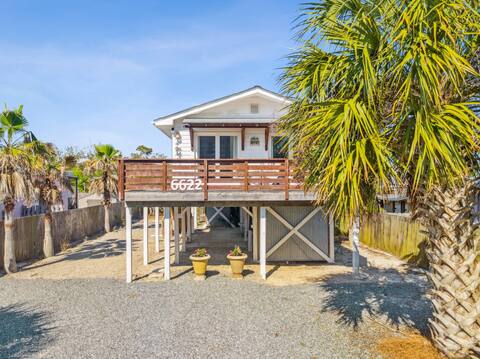
Newly renovated 2 Bedroom Beach House Free Parking
Entire Place • 2 bedrooms

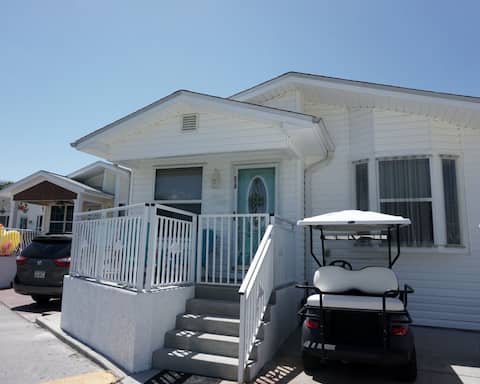
Sunset Dreams TOO -2 Blocks/5 Min Walk to Beach!
Entire Place • 1 bedroom
Venture Out, #402 North Marlin Dr. WITH GOLF CART!
Entire Place • 3 bedrooms
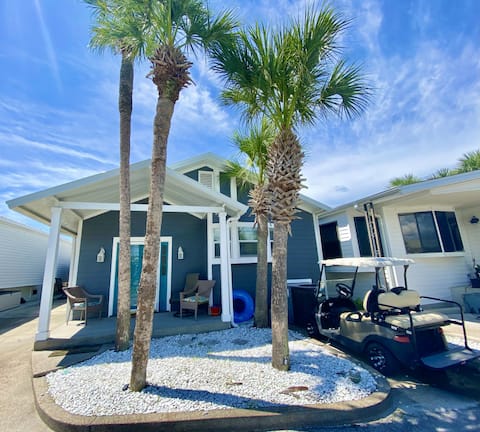
Venture Out, #646 Octopus Dr. WITH GOLF CART!
Entire Place • 2 bedrooms
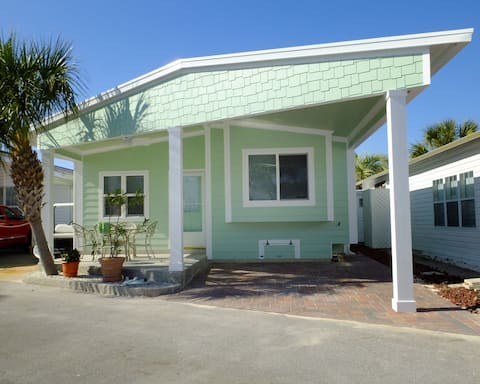
Venture Out # 34 Gulf Loop 3bd 2ba With Golf Cart!
Entire Place • 3 bedrooms

4821A Hispaniola St.
Entire Place • 2 bedrooms
Note: Performance varies based on location, size, amenities, seasonality, and management quality. Data reflects the past 12 months.
Top Performing Airbnb Hosts in Lower Grand Lagoon (2025)
Learn from the best! This table showcases top-performing Airbnb hosts in Lower Grand Lagoon based on the number of properties managed and estimated total revenue over the past year. Analyze their scale and performance metrics.
| Host Name | Properties | Grossing Revenue | Stay Reviews | Avg Rating |
|---|---|---|---|---|
| Randall | 16 | $45,351 | 0 | N/A/5.0 |
| Emerald View Vacations | 1 | $34,146 | 13 | 4.69/5.0 |
| Igor | 1 | $29,836 | 31 | 5.00/5.0 |
| Venture Out Beach Rentals | 1 | $5,782 | 7 | 5.00/5.0 |
| Purple | 1 | $4,129 | 6 | 4.50/5.0 |
Analyzing the strategies of top hosts, such as their property selection, pricing, and guest communication, can offer valuable lessons for optimizing your own Airbnb operations in Lower Grand Lagoon.
Dive Deeper: Advanced Lower Grand Lagoon STR Market Data (2025)
Ready to unlock more insights? AirROI provides access to advanced metrics and comprehensive Airbnb data for Lower Grand Lagoon. Explore detailed analytics beyond this report to refine your investment strategy, optimize pricing, and maximize your vacation rental profits.
Explore Advanced MetricsLower Grand Lagoon Short-Term Rental Market Composition (2025): Property & Room Types
Room Type Distribution
Property Type Distribution
Market Composition Insights for Lower Grand Lagoon
- The Lower Grand Lagoon Airbnb market composition is heavily skewed towards Entire Home/Apt listings, which make up 100% of the 20 active rentals. This indicates strong guest preference for privacy and space.
- Looking at the property type distribution in Lower Grand Lagoon, House properties are the most common (55%), reflecting the local real estate landscape.
- Houses represent a significant 55% portion, catering likely to families or larger groups.
Lower Grand Lagoon Airbnb Room Capacity Analysis (2025): Bedroom Distribution
Distribution of Listings by Number of Bedrooms
Room Capacity Insights for Lower Grand Lagoon
- The dominant room capacity in Lower Grand Lagoon is 1 bedroom listings, making up 55% of the market. This suggests a strong demand for properties suitable for couples or solo travelers.
- Together, 1 bedroom and 2 bedrooms properties represent 85.0% of the active Airbnb listings in Lower Grand Lagoon, indicating a high concentration in these sizes.
- With over half the market (55%) consisting of studios or 1-bedroom units, Lower Grand Lagoon is particularly well-suited for individuals or couples.
Lower Grand Lagoon Vacation Rental Guest Capacity Trends (2025)
Distribution of Listings by Guest Capacity
Guest Capacity Insights for Lower Grand Lagoon
- The most common guest capacity trend in Lower Grand Lagoon vacation rentals is listings accommodating 6 guests (75%). This suggests the primary traveler segment is likely larger groups.
- Properties designed for 6 guests and 4 guests dominate the Lower Grand Lagoon STR market, accounting for 95.0% of listings.
- 75.0% of properties accommodate 6+ guests, serving the market segment for larger families or group travel in Lower Grand Lagoon.
- On average, properties in Lower Grand Lagoon are equipped to host 5.5 guests.
Lower Grand Lagoon Airbnb Booking Patterns (2025): Available vs. Booked Days
Available Days Distribution
Booked Days Distribution
Booking Pattern Insights for Lower Grand Lagoon
- The most common availability pattern in Lower Grand Lagoon falls within the 271-366 days range, representing 90% of listings. This suggests many properties have significant open periods on their calendars.
- Approximately 95.0% of listings show high availability (181+ days open annually), indicating potential for increased bookings or specific owner usage patterns.
- For booked days, the 1-30 days range is most frequent in Lower Grand Lagoon (85%), reflecting common guest stay durations or potential owner blocking patterns.
- A notable 5.0% of properties secure long booking periods (181+ days booked per year), highlighting successful long-term rental strategies or significant owner usage.
Lower Grand Lagoon Airbnb Minimum Stay Requirements Analysis
Distribution of Listings by Minimum Night Requirement
1 Night
1 listings
5% of total
2 Nights
2 listings
10% of total
3 Nights
14 listings
70% of total
30+ Nights
3 listings
15% of total
Key Insights
- The most prevalent minimum stay requirement in Lower Grand Lagoon is 3 Nights, adopted by 70% of listings. This highlights the market's preference for longer commitments.
- Very short stays (1-2 nights) are less common (15.0%), suggesting hosts prefer slightly longer bookings to optimize turnover.
- A significant segment (15%) caters to monthly stays (30+ nights) in Lower Grand Lagoon, pointing to opportunities in the extended-stay market.
Recommendations
- Align with the market by considering a 3 Nights minimum stay, as 70% of Lower Grand Lagoon hosts use this setting.
- If feasible, allowing 1-night stays, especially midweek or during low season, could capture last-minute bookings, as only 5% currently do.
- Explore offering discounts for stays of 30+ nights to attract the 15% of the market seeking extended stays.
- Adjust minimum nights based on seasonality – potentially shorter during low season and longer during peak demand periods in Lower Grand Lagoon.
Lower Grand Lagoon Airbnb Cancellation Policy Trends Analysis (2025)
Super Strict 30 Days
16 listings
80% of total
Flexible
1 listings
5% of total
Moderate
1 listings
5% of total
Firm
1 listings
5% of total
Strict
1 listings
5% of total
Cancellation Policy Insights for Lower Grand Lagoon
- The prevailing Airbnb cancellation policy trend in Lower Grand Lagoon is Super Strict 30 Days, used by 80% of listings.
- There's a relatively balanced mix between guest-friendly (10.0%) and stricter (10.0%) policies, offering choices for different guest needs.
- Strict cancellation policies are quite rare (5%), potentially making listings with this policy less competitive unless justified by high demand or property type.
Recommendations for Hosts
- Consider adopting a Super Strict 30 Days policy to align with the 80% market standard in Lower Grand Lagoon.
- Using a Strict policy might deter some guests, as only 5% of listings use it. Evaluate if potential revenue protection outweighs possible lower booking rates.
- Regularly review your cancellation policy against competitors and market demand shifts in Lower Grand Lagoon.
Lower Grand Lagoon STR Booking Lead Time Analysis (2025)
Average Booking Lead Time by Month
Booking Lead Time Insights for Lower Grand Lagoon
- The overall average booking lead time for vacation rentals in Lower Grand Lagoon is 44 days.
- Guests book furthest in advance for stays during May (average 80 days), likely coinciding with peak travel demand or local events.
- The shortest booking windows occur for stays in June (average 0 days), indicating more last-minute travel plans during this time.
- Seasonally, Spring (49 days avg.) sees the longest lead times, while Summer (12 days avg.) has the shortest, reflecting typical travel planning cycles.
Recommendations for Hosts
- Use the overall average lead time (44 days) as a baseline for your pricing and availability strategy in Lower Grand Lagoon.
- For May stays, consider implementing length-of-stay discounts or slightly higher rates for bookings made less than 80 days out to capitalize on advance planning.
- During June, focus on last-minute booking availability and promotions, as guests book with very short notice (0 days avg.).
- Target marketing efforts for the Spring season well in advance (at least 49 days) to capture early planners.
- Monitor your own booking lead times against these Lower Grand Lagoon averages to identify opportunities for dynamic pricing adjustments.
Popular & Essential Airbnb Amenities in Lower Grand Lagoon (2025)
Amenity Prevalence
Amenity Insights for Lower Grand Lagoon
- Essential amenities in Lower Grand Lagoon that guests expect include: Heating, Air conditioning, TV, Wifi, Washer, Essentials, Dryer. Lacking these (any) could significantly impact bookings.
- Popular amenities like Hot water, Kitchen, Smoke alarm are common but not universal. Offering these can provide a competitive edge.
Recommendations for Hosts
- Ensure your listing includes all essential amenities for Lower Grand Lagoon: Heating, Air conditioning, TV, Wifi, Washer, Essentials, Dryer.
- Prioritize adding missing essentials: Heating, Air conditioning, TV, Wifi, Washer, Essentials, Dryer.
- Consider adding popular differentiators like Hot water or Kitchen to increase appeal.
- Highlight unique or less common amenities you offer (e.g., hot tub, dedicated workspace, EV charger) in your listing description and photos.
- Regularly check competitor amenities in Lower Grand Lagoon to stay competitive.
Lower Grand Lagoon Airbnb Guest Demographics & Profile Analysis (2025)
Guest Profile Summary for Lower Grand Lagoon
- The typical guest profile for Airbnb in Lower Grand Lagoon consists of primarily domestic travelers (100%), often arriving from nearby Atlanta, typically belonging to the Post-2000s (Gen Z/Alpha) group (50%), primarily speaking English or Spanish.
- Domestic travelers account for 100.0% of guests.
- Top languages spoken are English (69%) followed by Spanish (24.1%).
- A significant demographic segment is the Post-2000s (Gen Z/Alpha) group, representing 50% of guests.
Recommendations for Hosts
- Target domestic marketing efforts towards travelers from Atlanta and Asheville.
- Tailor amenities and listing descriptions to appeal to the dominant Post-2000s (Gen Z/Alpha) demographic (e.g., highlight fast WiFi, smart home features, local guides).
- Highlight unique local experiences or amenities relevant to the primary guest profile.
- Consider seasonal promotions aligned with peak travel times for key origin markets.
Nearby Short-Term Rental Market Comparison
How does the Lower Grand Lagoon Airbnb market stack up against its neighbors? Compare key performance metrics like average monthly revenue, ADR, and occupancy rates in surrounding areas to understand the broader regional STR landscape.
| Market | Active Properties | Monthly Revenue | Daily Rate | Avg. Occupancy |
|---|---|---|---|---|
| Seaside | 593 | $5,247 | $723.07 | 35% |
| Seacrest Beach | 368 | $5,004 | $547.18 | 39% |
| Alys Beach | 459 | $4,939 | $607.94 | 38% |
| Inlet Beach | 75 | $4,392 | $470.95 | 41% |
| Rosemary Beach | 540 | $4,228 | $570.72 | 37% |
| Gulf County | 10 | $3,971 | $432.91 | 37% |
| Saint George Island | 144 | $3,961 | $442.31 | 40% |
| Santa Rosa Beach | 2,922 | $3,671 | $466.03 | 37% |
| Cape San Blas | 85 | $3,617 | $459.11 | 36% |
| Alligator Point | 54 | $3,559 | $279.14 | 46% |