Lynn Haven Airbnb Market Analysis 2026: Short Term Rental Data & Vacation Rental Statistics in Florida, United States
Is Airbnb profitable in Lynn Haven in 2026? Explore comprehensive Airbnb analytics for Lynn Haven, Florida, United States to uncover income potential. This 2026 STR market report for Lynn Haven, based on AirROI data from February 2025 to January 2026, reveals key trends in the niche market of 38 active listings.
Whether you're considering an Airbnb investment in Lynn Haven, optimizing your existing vacation rental, or exploring rental arbitrage opportunities, understanding the Lynn Haven Airbnb data is crucial. Leveraging the low regulation environment is key to maximizing your short term rental income potential. Let's dive into the specifics.
Key Lynn Haven Airbnb Performance Metrics Overview
Monthly Airbnb Revenue Variations & Income Potential in Lynn Haven (2026)
Understanding the monthly revenue variations for Airbnb listings in Lynn Haven is key to maximizing your short term rental income potential. Seasonality significantly impacts earnings. Our analysis, based on data from the past 12 months, shows that the peak revenue month for STRs in Lynn Haven is typically June, while January often presents the lowest earnings, highlighting opportunities for strategic pricing adjustments during shoulder and low seasons. Explore the typical Airbnb income in Lynn Haven across different performance tiers:
- Best-in-class properties (Top 10%) achieve $6,705+ monthly, often utilizing dynamic pricing and superior guest experiences.
- Strong performing properties (Top 25%) earn $4,377 or more, indicating effective management and desirable locations/amenities.
- Typical properties (Median) generate around $2,785 per month, representing the average market performance.
- Entry-level properties (Bottom 25%) see earnings around $1,848, often with potential for optimization.
Average Monthly Airbnb Earnings Trend in Lynn Haven
Lynn Haven Airbnb Occupancy Rate Trends (2026)
Maximize your bookings by understanding the Lynn Haven STR occupancy trends. Seasonal demand shifts significantly influence how often properties are booked. Typically, Junesees the highest demand (peak season occupancy), while January experiences the lowest (low season). Effective strategies, like adjusting minimum stays or offering promotions, can boost occupancy during slower periods. Here's how different property tiers perform in Lynn Haven:
- Best-in-class properties (Top 10%) achieve 80%+ occupancy, indicating high desirability and potentially optimized availability.
- Strong performing properties (Top 25%) maintain 68% or higher occupancy, suggesting good market fit and guest satisfaction.
- Typical properties (Median) have an occupancy rate around 51%.
- Entry-level properties (Bottom 25%) average 36% occupancy, potentially facing higher vacancy.
Average Monthly Occupancy Rate Trend in Lynn Haven
Average Daily Rate (ADR) Airbnb Trends in Lynn Haven (2026)
Effective short term rental pricing strategy in Lynn Haven involves understanding monthly ADR fluctuations. The Average Daily Rate (ADR) for Airbnb in Lynn Haven typically peaks in June and dips lowest during February. Leveraging Airbnb dynamic pricing tools or strategies based on this seasonality can significantly boost revenue. Here's a look at the typical nightly rates achieved:
- Best-in-class properties (Top 10%) command rates of $389+ per night, often due to premium features or locations.
- Strong performing properties (Top 25%) achieve nightly rates of $291 or more.
- Typical properties (Median) charge around $196 per night.
- Entry-level properties (Bottom 25%) earn around $123 per night.
Average Daily Rate (ADR) Trend by Month in Lynn Haven
Get Live Lynn Haven Market Intelligence 👇

Explore Real-time Analytics
Airbnb Seasonality Analysis & Trends in Lynn Haven (2026)
Peak Season (June, July, May)
- Revenue averages $5,043 per month
- Occupancy rates average 64.7%
- Daily rates average $242
Shoulder Season
- Revenue averages $3,191 per month
- Occupancy maintains around 51.2%
- Daily rates hold near $229
Low Season (January, February, November)
- Revenue drops to average $2,098 per month
- Occupancy decreases to average 39.7%
- Daily rates adjust to average $218
Seasonality Insights for Lynn Haven
- The Airbnb seasonality in Lynn Haven shows highly seasonal trends requiring careful strategy. While the sections above show seasonal averages, it's also insightful to look at the extremes:
- During the high season, the absolute peak month showcases Lynn Haven's highest earning potential, with monthly revenues capable of climbing to $6,048, occupancy reaching a high of 74.0%, and ADRs peaking at $257.
- Conversely, the slowest single month of the year, typically falling within the low season, marks the market's lowest point. In this month, revenue might dip to $1,714, occupancy could drop to 26.9%, and ADRs may adjust down to $177.
- Understanding both the seasonal averages and these monthly peaks and troughs in revenue, occupancy, and ADR is crucial for maximizing your Airbnb profit potential in Lynn Haven.
Seasonal Strategies for Maximizing Profit
- Peak Season: Maximize revenue through premium pricing and potentially longer minimum stays. Ensure high availability.
- Low Season: Offer competitive pricing, special promotions (e.g., extended stay discounts), and flexible cancellation policies. Target off-season travelers like remote workers or budget-conscious guests.
- Shoulder Seasons: Implement dynamic pricing that balances peak and low rates. Target weekend travelers or specific events. Offer slightly more flexible terms than peak season.
- Regularly analyze your own performance against these Lynn Haven seasonality benchmarks and adjust your pricing and availability strategy accordingly.
Best Areas for Airbnb Investment in Lynn Haven (2026)
Exploring the top neighborhoods for short-term rentals in Lynn Haven? This section highlights key areas, outlining why they are attractive for hosts and guests, along with notable local attractions. Consider these locations based on your target guest profile and investment strategy.
| Neighborhood / Area | Why Host Here? (Target Guests & Appeal) | Key Attractions & Landmarks |
|---|---|---|
| Lynn Haven Beach | A serene beach area popular with families and vacationers looking for a relaxing getaway. Proximity to the water makes it a prime location for those seeking leisure and recreation. | Cove Park Beach, Lynn Haven Nature Park, Hugh S. Branyan Park, Panama City Beach, St. Andrews State Park |
| North Lynn Haven | A quiet residential area that offers convenience and accessibility. Ideal for guests wanting a peaceful atmosphere while being close to local amenities and attractions. | Lynn Haven Sports Complex, Local restaurants, Shopping centers, Nature trails |
| Downtown Lynn Haven | The heart of Lynn Haven with a charming small-town vibe. Close to local shops and eateries, making it attractive for guests looking for a local experience. | Lynn Haven Historical Museum, Local art shops, Community events, Parks and recreation areas |
| Panama City Beach | Famous for its beautiful sandy beaches and vibrant nightlife. A top destination for tourists, especially during the summer months, making it a lucrative area for Airbnb. | Gulf World Marine Park, Pier Park, Frank Brown Park, St. Andrews State Park |
| Southport | A quieter area near Lynn Haven, appealing to visitors looking for a peaceful retreat while still being close to the excitement of Panama City Beach. | Bay Point Golf Club, Nearby marinas, Nature parks, Water sports activities |
| Woodlawn | A suburban neighborhood that offers tranquility and easy access to both Lynn Haven and nearby attractions, making it suitable for family vacations and longer stays. | Local park areas, Shopping centers, Restaurants, Community activities |
| East Lynn Haven | This area provides a mix of residential comfort and access to local commuting routes, making it convenient for guests seeking to explore the wider region. | Local markets, Host events, Nearby parks, Nature trails |
| Lynn Haven Marina | Close proximity to the water and boating activities makes this area appealing for those interested in aquatic adventures and waterfront experiences. | Fishing and boating, Marina services, Waterfront dining, Wildlife observation |
Understanding Airbnb License Requirements & STR Laws in Lynn Haven (2026)
While Lynn Haven, Florida, United States currently shows low STR regulations, specific Airbnb license requirements might still exist or change. Always verify the latest short term rental regulations and Airbnb license requirements directly with local government authorities for Lynn Haven to ensure full compliance before hosting.
(Source: AirROI data, 2026, finding no licensed listings among those analyzed)
Top Performing Airbnb Properties in Lynn Haven (2026)
Benchmark your potential! Explore examples of top-performing Airbnb properties in Lynn Havenbased on Trailing Twelve Month (TTM) revenue. Analyze their characteristics, revenue, occupancy rate, and ADR to understand what drives success in this market.
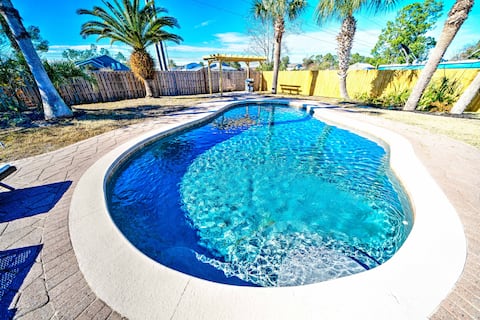
Sunshine Stay! Pool + Game room in Lynn Haven
Entire Place • 3 bedrooms
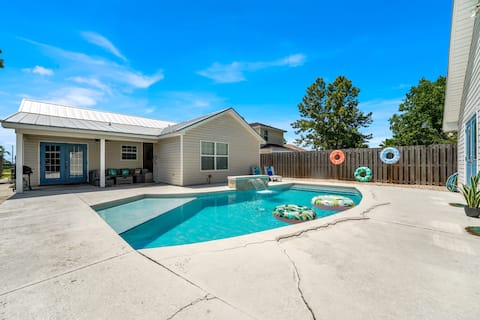
The Splash Pad Sleeps 13 w Pool Patio and Garage
Entire Place • 4 bedrooms
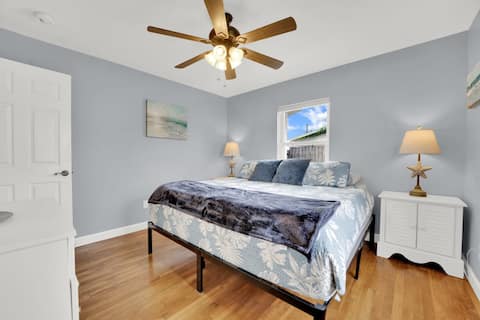
Loaded House and Guest House w Game Room Gym
Entire Place • 5 bedrooms
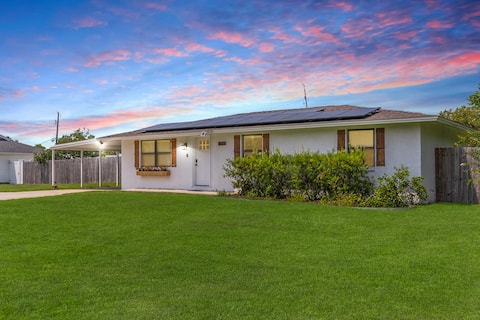
20 Mins PCB | Snowbirds | 4 BDRM| GameRM |2 Kings
Entire Place • 4 bedrooms

Two Spaces in One Main House and Guest House 25 Mi
Entire Place • 4 bedrooms
Luxury Bathroom Home with Game Room 25 Mins to PCB
Entire Place • 4 bedrooms
Note: Performance varies based on location, size, amenities, seasonality, and management quality. Data reflects the past 12 months.
Top Performing Airbnb Hosts in Lynn Haven (2026)
Learn from the best! This table showcases top-performing Airbnb hosts in Lynn Haven based on the number of properties managed and estimated total revenue over the past year. Analyze their scale and performance metrics.
| Host Name | Properties | Grossing Revenue | Stay Reviews | Avg Rating |
|---|---|---|---|---|
| Blake | 9 | $422,361 | 651 | 4.78/5.0 |
| Carrie | 1 | $78,657 | 53 | 4.87/5.0 |
| Evolve | 3 | $56,485 | 47 | 4.49/5.0 |
| Crystal | 1 | $53,907 | 35 | 4.77/5.0 |
| CJ @ Select Rentals | 1 | $50,697 | 10 | 5.00/5.0 |
| Trey | 1 | $46,761 | 239 | 4.94/5.0 |
| Hayden | 1 | $45,596 | 59 | 4.85/5.0 |
| Shawn | 1 | $42,895 | 63 | 4.73/5.0 |
| Humza | 1 | $39,844 | 63 | 4.78/5.0 |
| Kelly | 1 | $34,322 | 109 | 4.97/5.0 |
Analyzing the strategies of top hosts, such as their property selection, pricing, and guest communication, can offer valuable lessons for optimizing your own Airbnb operations in Lynn Haven.
Dive Deeper: Advanced Lynn Haven STR Market Data (2026)
Ready to unlock more insights? AirROI provides access to advanced metrics and comprehensive Airbnb data for Lynn Haven. Explore detailed analytics beyond this report to refine your investment strategy, optimize pricing, and maximize your vacation rental profits.
Explore Advanced MetricsLynn Haven Short-Term Rental Market Composition (2026): Property & Room Types
Room Type Distribution
Property Type Distribution
Market Composition Insights for Lynn Haven
- The Lynn Haven Airbnb market composition is heavily skewed towards Entire Home/Apt listings, which make up 97.4% of the 38 active rentals. This indicates strong guest preference for privacy and space.
- Looking at the property type distribution in Lynn Haven, House properties are the most common (81.6%), reflecting the local real estate landscape.
- Houses represent a significant 81.6% portion, catering likely to families or larger groups.
- The presence of 5.3% Hotel/Boutique listings indicates integration with traditional hospitality.
Lynn Haven Airbnb Room Capacity Analysis (2026): Bedroom Distribution
Distribution of Listings by Number of Bedrooms
Room Capacity Insights for Lynn Haven
- The dominant room capacity in Lynn Haven is 3 bedrooms listings, making up 39.5% of the market. This suggests a strong demand for properties suitable for families or small groups.
- Together, 3 bedrooms and 4 bedrooms properties represent 60.6% of the active Airbnb listings in Lynn Haven, indicating a high concentration in these sizes.
- A significant 65.9% of listings offer 3+ bedrooms, catering to larger groups and families seeking more space in Lynn Haven.
Lynn Haven Vacation Rental Guest Capacity Trends (2026)
Distribution of Listings by Guest Capacity
Guest Capacity Insights for Lynn Haven
- The most common guest capacity trend in Lynn Haven vacation rentals is listings accommodating 8+ guests (47.4%). This suggests the primary traveler segment is likely larger groups.
- Properties designed for 8+ guests and 6 guests dominate the Lynn Haven STR market, accounting for 71.1% of listings.
- 71.1% of properties accommodate 6+ guests, serving the market segment for larger families or group travel in Lynn Haven.
- On average, properties in Lynn Haven are equipped to host 6.2 guests.
Lynn Haven Airbnb Booking Patterns (2026): Available vs. Booked Days
Available Days Distribution
Booked Days Distribution
Booking Pattern Insights for Lynn Haven
- The most common availability pattern in Lynn Haven falls within the 91-180 days range, representing 50% of listings. This suggests many properties have significant open periods on their calendars.
- Approximately 50.0% of listings show high availability (181+ days open annually), indicating potential for increased bookings or specific owner usage patterns.
- For booked days, the 181-270 days range is most frequent in Lynn Haven (47.4%), reflecting common guest stay durations or potential owner blocking patterns.
- A notable 50.0% of properties secure long booking periods (181+ days booked per year), highlighting successful long-term rental strategies or significant owner usage.
Lynn Haven Airbnb Minimum Stay Requirements Analysis
Distribution of Listings by Minimum Night Requirement
1 Night
10 listings
26.3% of total
2 Nights
4 listings
10.5% of total
3 Nights
7 listings
18.4% of total
4-6 Nights
1 listings
2.6% of total
7-29 Nights
1 listings
2.6% of total
30+ Nights
15 listings
39.5% of total
Key Insights
- The most prevalent minimum stay requirement in Lynn Haven is 30+ Nights, adopted by 39.5% of listings. This highlights the market's preference for longer commitments.
- A significant segment (39.5%) caters to monthly stays (30+ nights) in Lynn Haven, pointing to opportunities in the extended-stay market.
Recommendations
- Align with the market by considering a 30+ Nights minimum stay, as 39.5% of Lynn Haven hosts use this setting.
- If feasible, allowing 1-night stays, especially midweek or during low season, could capture last-minute bookings, as only 26.3% currently do.
- Explore offering discounts for stays of 30+ nights to attract the 39.5% of the market seeking extended stays.
- Adjust minimum nights based on seasonality – potentially shorter during low season and longer during peak demand periods in Lynn Haven.
Lynn Haven Airbnb Cancellation Policy Trends Analysis (2026)
Flexible
3 listings
7.9% of total
Moderate
10 listings
26.3% of total
Firm
15 listings
39.5% of total
Strict
10 listings
26.3% of total
Cancellation Policy Insights for Lynn Haven
- The prevailing Airbnb cancellation policy trend in Lynn Haven is Firm, used by 39.5% of listings.
- A majority (65.8%) of hosts in Lynn Haven utilize Firm or Strict policies, indicating a market where hosts prioritize booking security.
Recommendations for Hosts
- Consider adopting a Firm policy to align with the 39.5% market standard in Lynn Haven.
- Regularly review your cancellation policy against competitors and market demand shifts in Lynn Haven.
Lynn Haven STR Booking Lead Time Analysis (2026)
Average Booking Lead Time by Month
Booking Lead Time Insights for Lynn Haven
- The overall average booking lead time for vacation rentals in Lynn Haven is 42 days.
- Guests book furthest in advance for stays during June (average 58 days), likely coinciding with peak travel demand or local events.
- The shortest booking windows occur for stays in January (average 11 days), indicating more last-minute travel plans during this time.
- Seasonally, Summer (54 days avg.) sees the longest lead times, while Winter (25 days avg.) has the shortest, reflecting typical travel planning cycles.
Recommendations for Hosts
- Use the overall average lead time (42 days) as a baseline for your pricing and availability strategy in Lynn Haven.
- For June stays, consider implementing length-of-stay discounts or slightly higher rates for bookings made less than 58 days out to capitalize on advance planning.
- During January, focus on last-minute booking availability and promotions, as guests book with very short notice (11 days avg.).
- Target marketing efforts for the Summer season well in advance (at least 54 days) to capture early planners.
- Monitor your own booking lead times against these Lynn Haven averages to identify opportunities for dynamic pricing adjustments.
Popular & Essential Airbnb Amenities in Lynn Haven (2026)
Amenity Prevalence
Amenity Insights for Lynn Haven
- Essential amenities in Lynn Haven that guests expect include: Free parking on premises, Air conditioning, TV, Refrigerator, Kitchen, Smoke alarm, Wifi. Lacking these (any) could significantly impact bookings.
- Popular amenities like Heating, Cooking basics, Coffee maker are common but not universal. Offering these can provide a competitive edge.
Recommendations for Hosts
- Ensure your listing includes all essential amenities for Lynn Haven: Free parking on premises, Air conditioning, TV, Refrigerator, Kitchen, Smoke alarm, Wifi.
- Prioritize adding missing essentials: Kitchen, Smoke alarm, Wifi.
- Consider adding popular differentiators like Heating or Cooking basics to increase appeal.
- Highlight unique or less common amenities you offer (e.g., hot tub, dedicated workspace, EV charger) in your listing description and photos.
- Regularly check competitor amenities in Lynn Haven to stay competitive.
Lynn Haven Airbnb Guest Demographics & Profile Analysis (2026)
Guest Profile Summary for Lynn Haven
- The typical guest profile for Airbnb in Lynn Haven consists of primarily domestic travelers (98%), often arriving from nearby Pensacola, typically belonging to the Post-2000s (Gen Z/Alpha) group (50%), primarily speaking English or Spanish.
- Domestic travelers account for 97.8% of guests.
- Key international markets include United States (97.8%) and Canada (0.9%).
- Top languages spoken are English (77.1%) followed by Spanish (20.1%).
- A significant demographic segment is the Post-2000s (Gen Z/Alpha) group, representing 50% of guests.
Recommendations for Hosts
- Target domestic marketing efforts towards travelers from Pensacola and Coral Springs.
- Tailor amenities and listing descriptions to appeal to the dominant Post-2000s (Gen Z/Alpha) demographic (e.g., highlight fast WiFi, smart home features, local guides).
- Highlight unique local experiences or amenities relevant to the primary guest profile.
- Consider seasonal promotions aligned with peak travel times for key origin markets.
Nearby Short-Term Rental Market Comparison
How does the Lynn Haven Airbnb market stack up against its neighbors? Compare key performance metrics like average monthly revenue, ADR, and occupancy rates in surrounding areas to understand the broader regional STR landscape.
| Market | Active Properties | Monthly Revenue | Daily Rate | Avg. Occupancy |
|---|---|---|---|---|
| Alys Beach | 441 | $6,989 | $682.56 | 43% |
| Seaside | 669 | $6,696 | $783.03 | 38% |
| Seacrest Beach | 350 | $6,613 | $593.69 | 44% |
| Rosemary Beach | 533 | $6,251 | $659.86 | 42% |
| Santa Rosa Beach | 3,191 | $5,047 | $539.15 | 41% |
| Seacrest | 28 | $4,993 | $635.35 | 39% |
| Inlet Beach | 98 | $4,870 | $534.43 | 41% |
| Saint George Island | 153 | $4,832 | $490.02 | 43% |
| Walton County | 134 | $4,764 | $592.07 | 38% |
| Watersound | 126 | $4,640 | $495.06 | 40% |