Miami Shores Airbnb Market Analysis 2026: Short Term Rental Data & Vacation Rental Statistics in Florida, United States
Is Airbnb profitable in Miami Shores in 2026? Explore comprehensive Airbnb analytics for Miami Shores, Florida, United States to uncover income potential. This 2026 STR market report for Miami Shores, based on AirROI data from February 2025 to January 2026, reveals key trends in the niche market of 90 active listings.
Whether you're considering an Airbnb investment in Miami Shores, optimizing your existing vacation rental, or exploring rental arbitrage opportunities, understanding the Miami Shores Airbnb data is crucial. Navigating the high regulation landscape is key to maximizing your short term rental income potential. Let's dive into the specifics.
Key Miami Shores Airbnb Performance Metrics Overview
Monthly Airbnb Revenue Variations & Income Potential in Miami Shores (2026)
Understanding the monthly revenue variations for Airbnb listings in Miami Shores is key to maximizing your short term rental income potential. Seasonality significantly impacts earnings. Our analysis, based on data from the past 12 months, shows that the peak revenue month for STRs in Miami Shores is typically March, while November often presents the lowest earnings, highlighting opportunities for strategic pricing adjustments during shoulder and low seasons. Explore the typical Airbnb income in Miami Shores across different performance tiers:
- Best-in-class properties (Top 10%) achieve $11,708+ monthly, often utilizing dynamic pricing and superior guest experiences.
- Strong performing properties (Top 25%) earn $6,518 or more, indicating effective management and desirable locations/amenities.
- Typical properties (Median) generate around $3,515 per month, representing the average market performance.
- Entry-level properties (Bottom 25%) see earnings around $1,799, often with potential for optimization.
Average Monthly Airbnb Earnings Trend in Miami Shores
Miami Shores Airbnb Occupancy Rate Trends (2026)
Maximize your bookings by understanding the Miami Shores STR occupancy trends. Seasonal demand shifts significantly influence how often properties are booked. Typically, Marchsees the highest demand (peak season occupancy), while November experiences the lowest (low season). Effective strategies, like adjusting minimum stays or offering promotions, can boost occupancy during slower periods. Here's how different property tiers perform in Miami Shores:
- Best-in-class properties (Top 10%) achieve 82%+ occupancy, indicating high desirability and potentially optimized availability.
- Strong performing properties (Top 25%) maintain 70% or higher occupancy, suggesting good market fit and guest satisfaction.
- Typical properties (Median) have an occupancy rate around 51%.
- Entry-level properties (Bottom 25%) average 29% occupancy, potentially facing higher vacancy.
Average Monthly Occupancy Rate Trend in Miami Shores
Average Daily Rate (ADR) Airbnb Trends in Miami Shores (2026)
Effective short term rental pricing strategy in Miami Shores involves understanding monthly ADR fluctuations. The Average Daily Rate (ADR) for Airbnb in Miami Shores typically peaks in December and dips lowest during September. Leveraging Airbnb dynamic pricing tools or strategies based on this seasonality can significantly boost revenue. Here's a look at the typical nightly rates achieved:
- Best-in-class properties (Top 10%) command rates of $1,136+ per night, often due to premium features or locations.
- Strong performing properties (Top 25%) achieve nightly rates of $484 or more.
- Typical properties (Median) charge around $260 per night.
- Entry-level properties (Bottom 25%) earn around $143 per night.
Average Daily Rate (ADR) Trend by Month in Miami Shores
Get Live Miami Shores Market Intelligence 👇

Explore Real-time Analytics
Airbnb Seasonality Analysis & Trends in Miami Shores (2026)
Peak Season (March, December, February)
- Revenue averages $7,403 per month
- Occupancy rates average 61.2%
- Daily rates average $531
Shoulder Season
- Revenue averages $5,694 per month
- Occupancy maintains around 47.6%
- Daily rates hold near $486
Low Season (August, September, November)
- Revenue drops to average $4,462 per month
- Occupancy decreases to average 42.8%
- Daily rates adjust to average $468
Seasonality Insights for Miami Shores
- The Airbnb seasonality in Miami Shores shows highly seasonal trends requiring careful strategy. While the sections above show seasonal averages, it's also insightful to look at the extremes:
- During the high season, the absolute peak month showcases Miami Shores's highest earning potential, with monthly revenues capable of climbing to $8,323, occupancy reaching a high of 70.1%, and ADRs peaking at $560.
- Conversely, the slowest single month of the year, typically falling within the low season, marks the market's lowest point. In this month, revenue might dip to $4,250, occupancy could drop to 40.9%, and ADRs may adjust down to $452.
- Understanding both the seasonal averages and these monthly peaks and troughs in revenue, occupancy, and ADR is crucial for maximizing your Airbnb profit potential in Miami Shores.
Seasonal Strategies for Maximizing Profit
- Peak Season: Maximize revenue through premium pricing and potentially longer minimum stays. Ensure high availability.
- Low Season: Offer competitive pricing, special promotions (e.g., extended stay discounts), and flexible cancellation policies. Target off-season travelers like remote workers or budget-conscious guests.
- Shoulder Seasons: Implement dynamic pricing that balances peak and low rates. Target weekend travelers or specific events. Offer slightly more flexible terms than peak season.
- Regularly analyze your own performance against these Miami Shores seasonality benchmarks and adjust your pricing and availability strategy accordingly.
Best Areas for Airbnb Investment in Miami Shores (2026)
Exploring the top neighborhoods for short-term rentals in Miami Shores? This section highlights key areas, outlining why they are attractive for hosts and guests, along with notable local attractions. Consider these locations based on your target guest profile and investment strategy.
| Neighborhood / Area | Why Host Here? (Target Guests & Appeal) | Key Attractions & Landmarks |
|---|---|---|
| Miami Shores | A charming suburban community known for its lush green landscapes and family-friendly atmosphere. This area is popular with both tourists and locals seeking a peaceful getaway while being close to Miami's vibrant attractions. | Miami Shores Country Club, Biscayne Bay, Arch Creek Park, MiMo Historic District, Shops at Bal Harbour |
| North Miami Beach | An up-and-coming area with a mix of cultures and a diverse dining scene. It attracts families and tourists looking for budget-friendly stays without compromising on access to beaches and city life. | Haulover Park, Oleta River State Park, Aventura Mall, Sunny Isles Beach, Greynolds Park |
| Aventura | A luxury neighborhood known for shopping and dining. Aventura Mall is one of the biggest shopping centers in the US, drawing visitors for high-end retail and entertainment. | Aventura Mall, Founders Park, Gulfstream Park Racing and Casino, Waterways Park, Biscayne Boulevard |
| Sunny Isles Beach | A beautiful beach destination with high-rise hotels and family-friendly resorts. Ideal for tourists looking to enjoy the sun and beach activities. | Sunny Isles Beach, Newport Fishing Pier, Oleta River State Park, Intracoastal Mall, Heritage Park |
| Downtown Miami | The bustling urban core of Miami with attractions, nightlife, and cultural venues. Great for urban explorers wanting to experience Miami's vibrant city life. | Bayside Marketplace, Frost Museum of Science, Pérez Art Museum Miami, Miami Heat games at FTX Arena, Donna E. Shalala Student Center |
| Coconut Grove | Known for its historic homes, lush greenery, and artsy vibe. Attracts tourists looking for a laid-back yet sophisticated atmosphere. | Vizcaya Museum and Gardens, CocoWalk, Coconut Grove Arts Festival, Barnacle Historic State Park, Bayshore Drive |
| Coral Gables | Renowned for its Mediterranean-style architecture and upscale shopping. Ideal for those looking for elegance and beauty in an urban setting. | Miracle Mile, Venetian Pool, Fairchild Tropical Botanic Garden, Coral Gables Museum, Biltmore Hotel |
| South Beach | Iconic Miami Beach neighborhood known for its Art Deco architecture and vibrant nightlife. Prime location for tourists seeking the quintessential Miami experience with direct beach access and endless entertainment options. | Art Deco Historic District, Ocean Drive, Lummus Park Beach, Lincoln Road Mall, Española Way, Miami Beach Boardwalk |
Understanding Airbnb License Requirements & STR Laws in Miami Shores (2026)
Yes, Miami Shores, Florida, United States enforces high STR regulations. Obtaining a license and ensuring compliance is almost certainly required according to current 2026 STR laws. Always verify the latest short term rental regulations and Airbnb license requirements directly with local government authorities for Miami Shores to ensure full compliance before hosting.
(Source: AirROI data, 2026, based on 52% licensed listings)
Top Performing Airbnb Properties in Miami Shores (2026)
Benchmark your potential! Explore examples of top-performing Airbnb properties in Miami Shoresbased on Trailing Twelve Month (TTM) revenue. Analyze their characteristics, revenue, occupancy rate, and ADR to understand what drives success in this market.
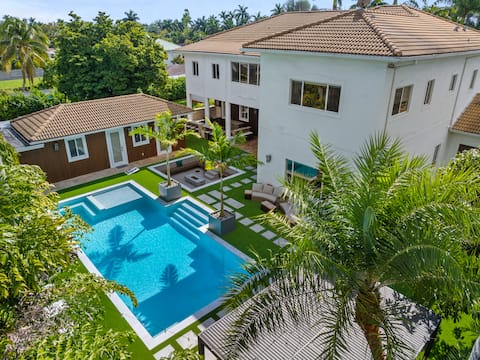
Villa Tortuga Miami | 10BR Pool, Gym & Theater
Entire Place • 10 bedrooms
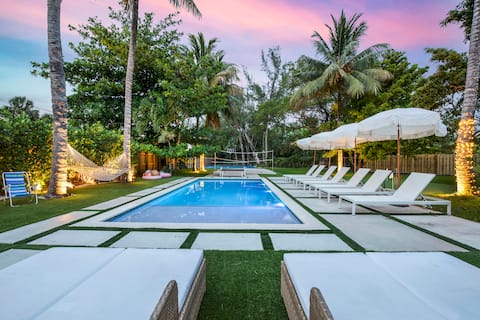
Villa Parque*Pickleball/Volleyball/Basketball/MiniGolf*
Entire Place • 7 bedrooms

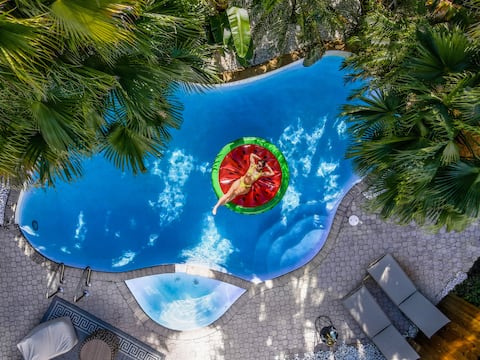
Huge Miami Villa | Heated Pool HotTub | Game Room
Entire Place • 8 bedrooms
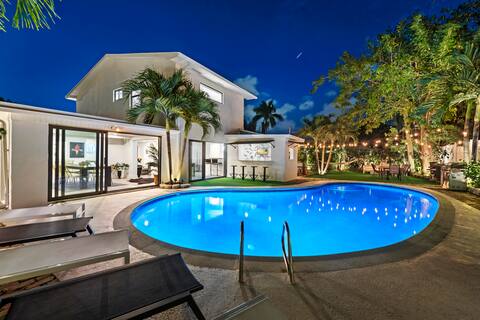
Diamond Estates: 305 Miami
Entire Place • 4 bedrooms
Villa Azur 8BR *Outdoor Oasis with Poolside Bar*
Entire Place • 8 bedrooms

Hot Tub, Pool, Billiards, BBQ, Games, Miami Shores
Entire Place • 6 bedrooms
Note: Performance varies based on location, size, amenities, seasonality, and management quality. Data reflects the past 12 months.
Top Performing Airbnb Hosts in Miami Shores (2026)
Learn from the best! This table showcases top-performing Airbnb hosts in Miami Shores based on the number of properties managed and estimated total revenue over the past year. Analyze their scale and performance metrics.
| Host Name | Properties | Grossing Revenue | Stay Reviews | Avg Rating |
|---|---|---|---|---|
| David | 1 | $569,014 | 34 | 5.00/5.0 |
| George | 2 | $537,079 | 176 | 4.94/5.0 |
| Mimo Realty LLC | 1 | $278,258 | 139 | 4.86/5.0 |
| Neal | 4 | $217,654 | 125 | 4.28/5.0 |
| Charlottes Home | 1 | $210,242 | 50 | 4.92/5.0 |
| Laura | 2 | $161,046 | 1156 | 4.67/5.0 |
| Newman Hospitality | 2 | $158,327 | 68 | 4.75/5.0 |
| Dream Villas | 1 | $157,992 | 10 | 4.20/5.0 |
| Michelle | 4 | $126,573 | 347 | 4.82/5.0 |
| Dzyn Haus | 2 | $115,688 | 26 | 4.65/5.0 |
Analyzing the strategies of top hosts, such as their property selection, pricing, and guest communication, can offer valuable lessons for optimizing your own Airbnb operations in Miami Shores.
Dive Deeper: Advanced Miami Shores STR Market Data (2026)
Ready to unlock more insights? AirROI provides access to advanced metrics and comprehensive Airbnb data for Miami Shores. Explore detailed analytics beyond this report to refine your investment strategy, optimize pricing, and maximize your vacation rental profits.
Explore Advanced MetricsMiami Shores Short-Term Rental Market Composition (2026): Property & Room Types
Room Type Distribution
Property Type Distribution
Market Composition Insights for Miami Shores
- The Miami Shores Airbnb market composition is heavily skewed towards Entire Home/Apt listings, which make up 87.8% of the 90 active rentals. This indicates strong guest preference for privacy and space.
- Looking at the property type distribution in Miami Shores, House properties are the most common (74.4%), reflecting the local real estate landscape.
- Houses represent a significant 74.4% portion, catering likely to families or larger groups.
- Smaller segments like hotel/boutique, others (combined 7.7%) offer potential for unique stay experiences.
Miami Shores Airbnb Room Capacity Analysis (2026): Bedroom Distribution
Distribution of Listings by Number of Bedrooms
Room Capacity Insights for Miami Shores
- The dominant room capacity in Miami Shores is 1 bedroom listings, making up 25.6% of the market. This suggests a strong demand for properties suitable for couples or solo travelers.
- Together, 1 bedroom and 5+ bedrooms properties represent 44.5% of the active Airbnb listings in Miami Shores, indicating a high concentration in these sizes.
- A significant 45.6% of listings offer 3+ bedrooms, catering to larger groups and families seeking more space in Miami Shores.
Miami Shores Vacation Rental Guest Capacity Trends (2026)
Distribution of Listings by Guest Capacity
Guest Capacity Insights for Miami Shores
- The most common guest capacity trend in Miami Shores vacation rentals is listings accommodating 8+ guests (32.2%). This suggests the primary traveler segment is likely larger groups.
- Properties designed for 8+ guests and 4 guests dominate the Miami Shores STR market, accounting for 48.9% of listings.
- 48.8% of properties accommodate 6+ guests, serving the market segment for larger families or group travel in Miami Shores.
- On average, properties in Miami Shores are equipped to host 4.9 guests.
Miami Shores Airbnb Booking Patterns (2026): Available vs. Booked Days
Available Days Distribution
Booked Days Distribution
Booking Pattern Insights for Miami Shores
- The most common availability pattern in Miami Shores falls within the 181-270 days range, representing 37.8% of listings. This suggests many properties have significant open periods on their calendars.
- Approximately 67.8% of listings show high availability (181+ days open annually), indicating potential for increased bookings or specific owner usage patterns.
- For booked days, the 91-180 days range is most frequent in Miami Shores (34.4%), reflecting common guest stay durations or potential owner blocking patterns.
- A notable 35.6% of properties secure long booking periods (181+ days booked per year), highlighting successful long-term rental strategies or significant owner usage.
Miami Shores Airbnb Minimum Stay Requirements Analysis
Distribution of Listings by Minimum Night Requirement
1 Night
21 listings
23.3% of total
2 Nights
10 listings
11.1% of total
3 Nights
10 listings
11.1% of total
4-6 Nights
8 listings
8.9% of total
7-29 Nights
4 listings
4.4% of total
30+ Nights
37 listings
41.1% of total
Key Insights
- The most prevalent minimum stay requirement in Miami Shores is 30+ Nights, adopted by 41.1% of listings. This highlights the market's preference for longer commitments.
- A significant segment (41.1%) caters to monthly stays (30+ nights) in Miami Shores, pointing to opportunities in the extended-stay market.
Recommendations
- Align with the market by considering a 30+ Nights minimum stay, as 41.1% of Miami Shores hosts use this setting.
- If feasible, allowing 1-night stays, especially midweek or during low season, could capture last-minute bookings, as only 23.3% currently do.
- Explore offering discounts for stays of 30+ nights to attract the 41.1% of the market seeking extended stays.
- Adjust minimum nights based on seasonality – potentially shorter during low season and longer during peak demand periods in Miami Shores.
Miami Shores Airbnb Cancellation Policy Trends Analysis (2026)
Limited
2 listings
2.2% of total
Flexible
7 listings
7.9% of total
Moderate
22 listings
24.7% of total
Firm
33 listings
37.1% of total
Strict
25 listings
28.1% of total
Cancellation Policy Insights for Miami Shores
- The prevailing Airbnb cancellation policy trend in Miami Shores is Firm, used by 37.1% of listings.
- A majority (65.2%) of hosts in Miami Shores utilize Firm or Strict policies, indicating a market where hosts prioritize booking security.
Recommendations for Hosts
- Consider adopting a Firm policy to align with the 37.1% market standard in Miami Shores.
- Regularly review your cancellation policy against competitors and market demand shifts in Miami Shores.
Miami Shores STR Booking Lead Time Analysis (2026)
Average Booking Lead Time by Month
Booking Lead Time Insights for Miami Shores
- The overall average booking lead time for vacation rentals in Miami Shores is 37 days.
- Guests book furthest in advance for stays during January (average 49 days), likely coinciding with peak travel demand or local events.
- The shortest booking windows occur for stays in September (average 28 days), indicating more last-minute travel plans during this time.
- Seasonally, Winter (45 days avg.) sees the longest lead times, while Spring (34 days avg.) has the shortest, reflecting typical travel planning cycles.
Recommendations for Hosts
- Use the overall average lead time (37 days) as a baseline for your pricing and availability strategy in Miami Shores.
- For January stays, consider implementing length-of-stay discounts or slightly higher rates for bookings made less than 49 days out to capitalize on advance planning.
- Target marketing efforts for the Winter season well in advance (at least 45 days) to capture early planners.
- Monitor your own booking lead times against these Miami Shores averages to identify opportunities for dynamic pricing adjustments.
Popular & Essential Airbnb Amenities in Miami Shores (2026)
Amenity Prevalence
Amenity Insights for Miami Shores
- Essential amenities in Miami Shores that guests expect include: Wifi, Free parking on premises, Air conditioning. Lacking these (any) could significantly impact bookings.
- Popular amenities like TV, Hangers, Hot water are common but not universal. Offering these can provide a competitive edge.
Recommendations for Hosts
- Ensure your listing includes all essential amenities for Miami Shores: Wifi, Free parking on premises, Air conditioning.
- Consider adding popular differentiators like TV or Hangers to increase appeal.
- Highlight unique or less common amenities you offer (e.g., hot tub, dedicated workspace, EV charger) in your listing description and photos.
- Regularly check competitor amenities in Miami Shores to stay competitive.
Miami Shores Airbnb Guest Demographics & Profile Analysis (2026)
Guest Profile Summary for Miami Shores
- The typical guest profile for Airbnb in Miami Shores consists of primarily domestic travelers (79%), often arriving from nearby New York, typically belonging to the Post-2000s (Gen Z/Alpha) group (50%), primarily speaking English or Spanish.
- Domestic travelers account for 78.8% of guests.
- Key international markets include United States (78.8%) and Canada (3.6%).
- Top languages spoken are English (57.5%) followed by Spanish (22%).
- A significant demographic segment is the Post-2000s (Gen Z/Alpha) group, representing 50% of guests.
Recommendations for Hosts
- Target domestic marketing efforts towards travelers from New York and Miami.
- Tailor amenities and listing descriptions to appeal to the dominant Post-2000s (Gen Z/Alpha) demographic (e.g., highlight fast WiFi, smart home features, local guides).
- Highlight unique local experiences or amenities relevant to the primary guest profile.
- Consider seasonal promotions aligned with peak travel times for key origin markets.
Nearby Short-Term Rental Market Comparison
How does the Miami Shores Airbnb market stack up against its neighbors? Compare key performance metrics like average monthly revenue, ADR, and occupancy rates in surrounding areas to understand the broader regional STR landscape.
| Market | Active Properties | Monthly Revenue | Daily Rate | Avg. Occupancy |
|---|---|---|---|---|
| Stock Island | 107 | $9,731 | $733.54 | 47% |
| Bal Harbour Village | 37 | $8,846 | $850.63 | 34% |
| Key West | 1,137 | $7,525 | $630.09 | 47% |
| Lake Clarke Shores | 26 | $6,710 | $516.52 | 46% |
| Lighthouse Point | 75 | $6,205 | $472.94 | 51% |
| Pinecrest | 11 | $6,117 | $861.24 | 43% |
| North Bay Village | 120 | $6,032 | $561.12 | 44% |
| Duck Key | 60 | $5,308 | $504.94 | 43% |
| Little Torch Key | 20 | $5,131 | $701.83 | 29% |
| Tequesta | 43 | $4,920 | $376.96 | 50% |