Miami Springs Airbnb Market Analysis 2026: Short Term Rental Data & Vacation Rental Statistics in Florida, United States
Is Airbnb profitable in Miami Springs in 2026? Explore comprehensive Airbnb analytics for Miami Springs, Florida, United States to uncover income potential. This 2026 STR market report for Miami Springs, based on AirROI data from February 2025 to January 2026, reveals key trends in the niche market of 72 active listings.
Whether you're considering an Airbnb investment in Miami Springs, optimizing your existing vacation rental, or exploring rental arbitrage opportunities, understanding the Miami Springs Airbnb data is crucial. Leveraging the low regulation environment is key to maximizing your short term rental income potential. Let's dive into the specifics.
Key Miami Springs Airbnb Performance Metrics Overview
Monthly Airbnb Revenue Variations & Income Potential in Miami Springs (2026)
Understanding the monthly revenue variations for Airbnb listings in Miami Springs is key to maximizing your short term rental income potential. Seasonality significantly impacts earnings. Our analysis, based on data from the past 12 months, shows that the peak revenue month for STRs in Miami Springs is typically March, while September often presents the lowest earnings, highlighting opportunities for strategic pricing adjustments during shoulder and low seasons. Explore the typical Airbnb income in Miami Springs across different performance tiers:
- Best-in-class properties (Top 10%) achieve $9,500+ monthly, often utilizing dynamic pricing and superior guest experiences.
- Strong performing properties (Top 25%) earn $4,878 or more, indicating effective management and desirable locations/amenities.
- Typical properties (Median) generate around $1,881 per month, representing the average market performance.
- Entry-level properties (Bottom 25%) see earnings around $717, often with potential for optimization.
Average Monthly Airbnb Earnings Trend in Miami Springs
Miami Springs Airbnb Occupancy Rate Trends (2026)
Maximize your bookings by understanding the Miami Springs STR occupancy trends. Seasonal demand shifts significantly influence how often properties are booked. Typically, Februarysees the highest demand (peak season occupancy), while September experiences the lowest (low season). Effective strategies, like adjusting minimum stays or offering promotions, can boost occupancy during slower periods. Here's how different property tiers perform in Miami Springs:
- Best-in-class properties (Top 10%) achieve 83%+ occupancy, indicating high desirability and potentially optimized availability.
- Strong performing properties (Top 25%) maintain 68% or higher occupancy, suggesting good market fit and guest satisfaction.
- Typical properties (Median) have an occupancy rate around 46%.
- Entry-level properties (Bottom 25%) average 25% occupancy, potentially facing higher vacancy.
Average Monthly Occupancy Rate Trend in Miami Springs
Average Daily Rate (ADR) Airbnb Trends in Miami Springs (2026)
Effective short term rental pricing strategy in Miami Springs involves understanding monthly ADR fluctuations. The Average Daily Rate (ADR) for Airbnb in Miami Springs typically peaks in December and dips lowest during August. Leveraging Airbnb dynamic pricing tools or strategies based on this seasonality can significantly boost revenue. Here's a look at the typical nightly rates achieved:
- Best-in-class properties (Top 10%) command rates of $416+ per night, often due to premium features or locations.
- Strong performing properties (Top 25%) achieve nightly rates of $287 or more.
- Typical properties (Median) charge around $118 per night.
- Entry-level properties (Bottom 25%) earn around $75 per night.
Average Daily Rate (ADR) Trend by Month in Miami Springs
Get Live Miami Springs Market Intelligence 👇

Explore Real-time Analytics
Airbnb Seasonality Analysis & Trends in Miami Springs (2026)
Peak Season (March, February, April)
- Revenue averages $4,534 per month
- Occupancy rates average 61.9%
- Daily rates average $198
Shoulder Season
- Revenue averages $3,424 per month
- Occupancy maintains around 42.5%
- Daily rates hold near $208
Low Season (June, September, November)
- Revenue drops to average $2,816 per month
- Occupancy decreases to average 39.3%
- Daily rates adjust to average $207
Seasonality Insights for Miami Springs
- The Airbnb seasonality in Miami Springs shows highly seasonal trends requiring careful strategy. While the sections above show seasonal averages, it's also insightful to look at the extremes:
- During the high season, the absolute peak month showcases Miami Springs's highest earning potential, with monthly revenues capable of climbing to $4,992, occupancy reaching a high of 68.1%, and ADRs peaking at $233.
- Conversely, the slowest single month of the year, typically falling within the low season, marks the market's lowest point. In this month, revenue might dip to $2,159, occupancy could drop to 32.6%, and ADRs may adjust down to $189.
- Understanding both the seasonal averages and these monthly peaks and troughs in revenue, occupancy, and ADR is crucial for maximizing your Airbnb profit potential in Miami Springs.
Seasonal Strategies for Maximizing Profit
- Peak Season: Maximize revenue through premium pricing and potentially longer minimum stays. Ensure high availability.
- Low Season: Offer competitive pricing, special promotions (e.g., extended stay discounts), and flexible cancellation policies. Target off-season travelers like remote workers or budget-conscious guests.
- Shoulder Seasons: Implement dynamic pricing that balances peak and low rates. Target weekend travelers or specific events. Offer slightly more flexible terms than peak season.
- Regularly analyze your own performance against these Miami Springs seasonality benchmarks and adjust your pricing and availability strategy accordingly.
Best Areas for Airbnb Investment in Miami Springs (2026)
Exploring the top neighborhoods for short-term rentals in Miami Springs? This section highlights key areas, outlining why they are attractive for hosts and guests, along with notable local attractions. Consider these locations based on your target guest profile and investment strategy.
| Neighborhood / Area | Why Host Here? (Target Guests & Appeal) | Key Attractions & Landmarks |
|---|---|---|
| Miami Springs | A charming and quiet city with a rich history, Miami Springs offers a suburban feel while being in close proximity to the vibrant attractions of Miami. It's ideal for families and travelers looking for a peaceful retreat with easy access to the city. | Miami Springs Golf & Country Club, Babcock Park, Miami Springs Historical Museum, Spring Park, The Royal Poinciana |
| South Beach | Iconic Miami Beach neighborhood known for its Art Deco architecture and vibrant nightlife. Prime location for tourists seeking the quintessential Miami experience with direct beach access and endless entertainment options. | Art Deco Historic District, Ocean Drive, Lummus Park Beach, Lincoln Road Mall, Española Way, Miami Beach Boardwalk |
| Brickell | Miami's modern financial district with luxury high-rises and upscale amenities. Popular with business travelers and those seeking an urban luxury experience with easy access to downtown. | Brickell City Centre, Mary Brickell Village, Miami River restaurants, Brickell Key, Simpson Park |
| Wynwood | Trendy arts district known for its colorful murals and hipster culture. Attracts young professionals and creative types looking for a unique, cultural experience. | Wynwood Walls, art galleries, craft breweries, Wynwood Art Walk, trendy restaurants and bars |
| Little Havana | Vibrant Cuban neighborhood filled with culture, art, and delicious food. Perfect for visitors wanting to experience the rich Latino heritage of Miami. | Calle Ocho, Domino Park, Ball & Chain, Cuban Memorial Boulevard, Maximo Gomez Park |
| Coconut Grove | Historic neighborhood known for its lush greenery and laid-back vibe. Ideal for families and travelers seeking a scenic and relaxing environment. | Coconut Grove Marina, Vizcaya Museum and Gardens, CocoWalk, Barnacle Historic State Park, Peacock Park |
| Downtown Miami | The bustling heart of Miami filled with skyscrapers, shopping, and dining. Offers travelers a convenient base for exploring the broader Miami area. | Bayfront Park, American Airlines Arena, Perez Art Museum Miami, Frost Museum of Science, Miami Worldcenter |
| North Beach | A quieter, more laid-back alternative to South Beach, North Beach offers beautiful beaches and a more residential atmosphere, attracting families and older travelers. | North Beach Oceanside Park, Collins Avenue, Miami Beach Boardwalk, Haulover Park, Biscayne Point |
Understanding Airbnb License Requirements & STR Laws in Miami Springs (2026)
While Miami Springs, Florida, United States currently shows low STR regulations, specific Airbnb license requirements might still exist or change. Always verify the latest short term rental regulations and Airbnb license requirements directly with local government authorities for Miami Springs to ensure full compliance before hosting.
(Source: AirROI data, 2026, based on 4% licensed listings)
Top Performing Airbnb Properties in Miami Springs (2026)
Benchmark your potential! Explore examples of top-performing Airbnb properties in Miami Springsbased on Trailing Twelve Month (TTM) revenue. Analyze their characteristics, revenue, occupancy rate, and ADR to understand what drives success in this market.

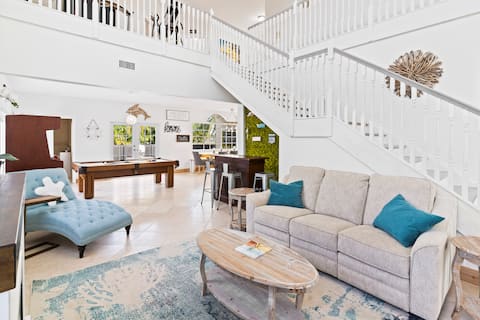
Lakefront Miami/Heated Pool/Mini Golf/Games & Fun
Entire Place • 6 bedrooms
UPSCALE MANSION IN THE HEART OF MIAMI WITH POOL
Entire Place • 7 bedrooms
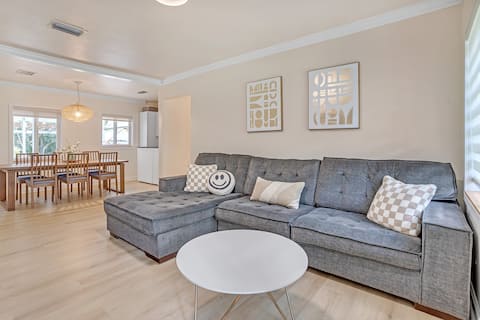
New Listing Cozy Miami Springs | Relaxing Retreat
Entire Place • 4 bedrooms
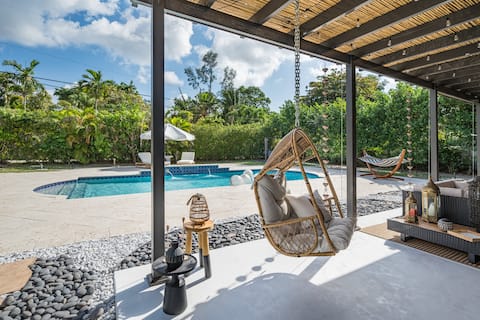
Spanish House 3 Bedroom Pool House
Entire Place • 3 bedrooms
Welcome to Miami
Entire Place • 3 bedrooms
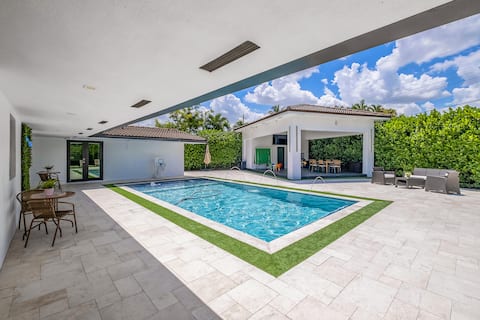
Centrally Located Resort Style Miami home
Entire Place • 3 bedrooms
Note: Performance varies based on location, size, amenities, seasonality, and management quality. Data reflects the past 12 months.
Top Performing Airbnb Hosts in Miami Springs (2026)
Learn from the best! This table showcases top-performing Airbnb hosts in Miami Springs based on the number of properties managed and estimated total revenue over the past year. Analyze their scale and performance metrics.
| Host Name | Properties | Grossing Revenue | Stay Reviews | Avg Rating |
|---|---|---|---|---|
| Nani | 1 | $227,079 | 40 | 4.90/5.0 |
| Top House | 6 | $151,026 | 71 | 4.77/5.0 |
| Rick | 1 | $143,912 | 131 | 4.95/5.0 |
| Steven And Chloé | 1 | $141,100 | 95 | 4.78/5.0 |
| Lesliet | 1 | $124,764 | 192 | 4.97/5.0 |
| Orlando | 1 | $111,239 | 52 | 5.00/5.0 |
| Evelyn | 1 | $105,185 | 301 | 4.90/5.0 |
| Gisela | 1 | $78,789 | 21 | 4.81/5.0 |
| Kimberly | 1 | $75,054 | 167 | 4.95/5.0 |
| Laila | 1 | $69,020 | 130 | 4.71/5.0 |
Analyzing the strategies of top hosts, such as their property selection, pricing, and guest communication, can offer valuable lessons for optimizing your own Airbnb operations in Miami Springs.
Dive Deeper: Advanced Miami Springs STR Market Data (2026)
Ready to unlock more insights? AirROI provides access to advanced metrics and comprehensive Airbnb data for Miami Springs. Explore detailed analytics beyond this report to refine your investment strategy, optimize pricing, and maximize your vacation rental profits.
Explore Advanced MetricsMiami Springs Short-Term Rental Market Composition (2026): Property & Room Types
Room Type Distribution
Property Type Distribution
Market Composition Insights for Miami Springs
- The Miami Springs Airbnb market composition is heavily skewed towards Entire Home/Apt listings, which make up 51.4% of the 72 active rentals. This indicates strong guest preference for privacy and space.
- However, a notable 38.9% share for Private Rooms suggests opportunities for budget-conscious travelers or hosts renting out spare rooms.
- Looking at the property type distribution in Miami Springs, House properties are the most common (58.3%), reflecting the local real estate landscape.
- Houses represent a significant 58.3% portion, catering likely to families or larger groups.
- The presence of 22.2% Hotel/Boutique listings indicates integration with traditional hospitality.
Miami Springs Airbnb Room Capacity Analysis (2026): Bedroom Distribution
Distribution of Listings by Number of Bedrooms
Room Capacity Insights for Miami Springs
- The dominant room capacity in Miami Springs is 1 bedroom listings, making up 30.6% of the market. This suggests a strong demand for properties suitable for couples or solo travelers.
- Together, 1 bedroom and 4 bedrooms properties represent 44.5% of the active Airbnb listings in Miami Springs, indicating a high concentration in these sizes.
- A significant 27.8% of listings offer 3+ bedrooms, catering to larger groups and families seeking more space in Miami Springs.
Miami Springs Vacation Rental Guest Capacity Trends (2026)
Distribution of Listings by Guest Capacity
Guest Capacity Insights for Miami Springs
- The most common guest capacity trend in Miami Springs vacation rentals is listings accommodating 8+ guests (23.6%). This suggests the primary traveler segment is likely larger groups.
- Properties designed for 8+ guests and 2 guests dominate the Miami Springs STR market, accounting for 40.3% of listings.
- 36.1% of properties accommodate 6+ guests, serving the market segment for larger families or group travel in Miami Springs.
- On average, properties in Miami Springs are equipped to host 3.6 guests.
Miami Springs Airbnb Booking Patterns (2026): Available vs. Booked Days
Available Days Distribution
Booked Days Distribution
Booking Pattern Insights for Miami Springs
- The most common availability pattern in Miami Springs falls within the 271-366 days range, representing 52.8% of listings. This suggests many properties have significant open periods on their calendars.
- Approximately 75.0% of listings show high availability (181+ days open annually), indicating potential for increased bookings or specific owner usage patterns.
- For booked days, the 31-90 days range is most frequent in Miami Springs (33.3%), reflecting common guest stay durations or potential owner blocking patterns.
- A notable 25.0% of properties secure long booking periods (181+ days booked per year), highlighting successful long-term rental strategies or significant owner usage.
Miami Springs Airbnb Minimum Stay Requirements Analysis
Distribution of Listings by Minimum Night Requirement
1 Night
37 listings
51.4% of total
2 Nights
5 listings
6.9% of total
3 Nights
8 listings
11.1% of total
4-6 Nights
2 listings
2.8% of total
7-29 Nights
2 listings
2.8% of total
30+ Nights
18 listings
25% of total
Key Insights
- The most prevalent minimum stay requirement in Miami Springs is 1 Night, adopted by 51.4% of listings. This highlights the market's preference for shorter, flexible bookings.
- A significant segment (25%) caters to monthly stays (30+ nights) in Miami Springs, pointing to opportunities in the extended-stay market.
Recommendations
- Align with the market by considering a 1 Night minimum stay, as 51.4% of Miami Springs hosts use this setting.
- Explore offering discounts for stays of 30+ nights to attract the 25% of the market seeking extended stays.
- Adjust minimum nights based on seasonality – potentially shorter during low season and longer during peak demand periods in Miami Springs.
Miami Springs Airbnb Cancellation Policy Trends Analysis (2026)
Limited
4 listings
5.9% of total
Super Strict 30 Days
1 listings
1.5% of total
Flexible
17 listings
25% of total
Moderate
17 listings
25% of total
Firm
16 listings
23.5% of total
Strict
13 listings
19.1% of total
Cancellation Policy Insights for Miami Springs
- The prevailing Airbnb cancellation policy trend in Miami Springs is Flexible, used by 25% of listings.
- There's a relatively balanced mix between guest-friendly (50.0%) and stricter (42.6%) policies, offering choices for different guest needs.
Recommendations for Hosts
- Consider adopting a Flexible policy to align with the 25% market standard in Miami Springs.
- Regularly review your cancellation policy against competitors and market demand shifts in Miami Springs.
Miami Springs STR Booking Lead Time Analysis (2026)
Average Booking Lead Time by Month
Booking Lead Time Insights for Miami Springs
- The overall average booking lead time for vacation rentals in Miami Springs is 34 days.
- Guests book furthest in advance for stays during December (average 58 days), likely coinciding with peak travel demand or local events.
- The shortest booking windows occur for stays in August (average 19 days), indicating more last-minute travel plans during this time.
- Seasonally, Winter (39 days avg.) sees the longest lead times, while Fall (24 days avg.) has the shortest, reflecting typical travel planning cycles.
Recommendations for Hosts
- Use the overall average lead time (34 days) as a baseline for your pricing and availability strategy in Miami Springs.
- For December stays, consider implementing length-of-stay discounts or slightly higher rates for bookings made less than 58 days out to capitalize on advance planning.
- Target marketing efforts for the Winter season well in advance (at least 39 days) to capture early planners.
- Monitor your own booking lead times against these Miami Springs averages to identify opportunities for dynamic pricing adjustments.
Popular & Essential Airbnb Amenities in Miami Springs (2026)
Amenity Prevalence
Amenity Insights for Miami Springs
- Essential amenities in Miami Springs that guests expect include: Wifi, Air conditioning. Lacking these (any) could significantly impact bookings.
- Popular amenities like TV, Free parking on premises, Smoke alarm are common but not universal. Offering these can provide a competitive edge.
Recommendations for Hosts
- Ensure your listing includes all essential amenities for Miami Springs: Wifi, Air conditioning.
- Prioritize adding missing essentials: Air conditioning.
- Consider adding popular differentiators like TV or Free parking on premises to increase appeal.
- Highlight unique or less common amenities you offer (e.g., hot tub, dedicated workspace, EV charger) in your listing description and photos.
- Regularly check competitor amenities in Miami Springs to stay competitive.
Miami Springs Airbnb Guest Demographics & Profile Analysis (2026)
Guest Profile Summary for Miami Springs
- The typical guest profile for Airbnb in Miami Springs consists of primarily domestic travelers (76%), often arriving from nearby Miami, typically belonging to the Post-2000s (Gen Z/Alpha) group (50%), primarily speaking English or Spanish.
- Domestic travelers account for 76.1% of guests.
- Key international markets include United States (76.1%) and Brazil (2.3%).
- Top languages spoken are English (54.3%) followed by Spanish (26%).
- A significant demographic segment is the Post-2000s (Gen Z/Alpha) group, representing 50% of guests.
Recommendations for Hosts
- Target domestic marketing efforts towards travelers from Miami and New York.
- Tailor amenities and listing descriptions to appeal to the dominant Post-2000s (Gen Z/Alpha) demographic (e.g., highlight fast WiFi, smart home features, local guides).
- Highlight unique local experiences or amenities relevant to the primary guest profile.
- Consider seasonal promotions aligned with peak travel times for key origin markets.
Nearby Short-Term Rental Market Comparison
How does the Miami Springs Airbnb market stack up against its neighbors? Compare key performance metrics like average monthly revenue, ADR, and occupancy rates in surrounding areas to understand the broader regional STR landscape.
| Market | Active Properties | Monthly Revenue | Daily Rate | Avg. Occupancy |
|---|---|---|---|---|
| Stock Island | 107 | $9,731 | $733.54 | 47% |
| Bal Harbour Village | 37 | $8,846 | $850.63 | 34% |
| Key West | 1,137 | $7,525 | $630.09 | 47% |
| Lake Clarke Shores | 26 | $6,710 | $516.52 | 46% |
| Lighthouse Point | 75 | $6,205 | $472.94 | 51% |
| Pinecrest | 11 | $6,117 | $861.24 | 43% |
| North Bay Village | 120 | $6,032 | $561.12 | 44% |
| Duck Key | 60 | $5,308 | $504.94 | 43% |
| Little Torch Key | 20 | $5,131 | $701.83 | 29% |
| Tequesta | 43 | $4,920 | $376.96 | 50% |