Naples Manor Airbnb Market Analysis 2025: Short Term Rental Data & Vacation Rental Statistics in Florida, United States
Is Airbnb profitable in Naples Manor in 2025? Explore comprehensive Airbnb analytics for Naples Manor, Florida, United States to uncover income potential. This 2025 STR market report for Naples Manor, based on AirROI data from July 2024 to June 2025, reveals key trends in the niche market of 18 active listings.
Whether you're considering an Airbnb investment in Naples Manor, optimizing your existing vacation rental, or exploring rental arbitrage opportunities, understanding the Naples Manor Airbnb data is crucial. Leveraging the low regulation environment is key to maximizing your short term rental income potential. Let's dive into the specifics.
Key Naples Manor Airbnb Performance Metrics Overview
Monthly Airbnb Revenue Variations & Income Potential in Naples Manor (2025)
Understanding the monthly revenue variations for Airbnb listings in Naples Manor is key to maximizing your short term rental income potential. Seasonality significantly impacts earnings. Our analysis, based on data from the past 12 months, shows that the peak revenue month for STRs in Naples Manor is typically March, while October often presents the lowest earnings, highlighting opportunities for strategic pricing adjustments during shoulder and low seasons. Explore the typical Airbnb income in Naples Manor across different performance tiers:
- Best-in-class properties (Top 10%) achieve $8,206+ monthly, often utilizing dynamic pricing and superior guest experiences.
- Strong performing properties (Top 25%) earn $4,420 or more, indicating effective management and desirable locations/amenities.
- Typical properties (Median) generate around $2,878 per month, representing the average market performance.
- Entry-level properties (Bottom 25%) see earnings around $1,778, often with potential for optimization.
Average Monthly Airbnb Earnings Trend in Naples Manor
Naples Manor Airbnb Occupancy Rate Trends (2025)
Maximize your bookings by understanding the Naples Manor STR occupancy trends. Seasonal demand shifts significantly influence how often properties are booked. Typically, Februarysees the highest demand (peak season occupancy), while June experiences the lowest (low season). Effective strategies, like adjusting minimum stays or offering promotions, can boost occupancy during slower periods. Here's how different property tiers perform in Naples Manor:
- Best-in-class properties (Top 10%) achieve 84%+ occupancy, indicating high desirability and potentially optimized availability.
- Strong performing properties (Top 25%) maintain 73% or higher occupancy, suggesting good market fit and guest satisfaction.
- Typical properties (Median) have an occupancy rate around 53%.
- Entry-level properties (Bottom 25%) average 30% occupancy, potentially facing higher vacancy.
Average Monthly Occupancy Rate Trend in Naples Manor
Average Daily Rate (ADR) Airbnb Trends in Naples Manor (2025)
Effective short term rental pricing strategy in Naples Manor involves understanding monthly ADR fluctuations. The Average Daily Rate (ADR) for Airbnb in Naples Manor typically peaks in February and dips lowest during July. Leveraging Airbnb dynamic pricing tools or strategies based on this seasonality can significantly boost revenue. Here's a look at the typical nightly rates achieved:
- Best-in-class properties (Top 10%) command rates of $408+ per night, often due to premium features or locations.
- Strong performing properties (Top 25%) achieve nightly rates of $292 or more.
- Typical properties (Median) charge around $200 per night.
- Entry-level properties (Bottom 25%) earn around $127 per night.
Average Daily Rate (ADR) Trend by Month in Naples Manor
Get Live Naples Manor Market Intelligence 👇
Explore Real-time Analytics
Airbnb Seasonality Analysis & Trends in Naples Manor (2025)
Peak Season (March, February, May)
- Revenue averages $5,820 per month
- Occupancy rates average 65.6%
- Daily rates average $266
Shoulder Season
- Revenue averages $3,398 per month
- Occupancy maintains around 47.2%
- Daily rates hold near $234
Low Season (August, September, October)
- Revenue drops to average $2,078 per month
- Occupancy decreases to average 48.8%
- Daily rates adjust to average $206
Seasonality Insights for Naples Manor
- The Airbnb seasonality in Naples Manor shows highly seasonal trends requiring careful strategy. While the sections above show seasonal averages, it's also insightful to look at the extremes:
- During the high season, the absolute peak month showcases Naples Manor's highest earning potential, with monthly revenues capable of climbing to $6,672, occupancy reaching a high of 76.4%, and ADRs peaking at $282.
- Conversely, the slowest single month of the year, typically falling within the low season, marks the market's lowest point. In this month, revenue might dip to $1,902, occupancy could drop to 35.0%, and ADRs may adjust down to $203.
- Understanding both the seasonal averages and these monthly peaks and troughs in revenue, occupancy, and ADR is crucial for maximizing your Airbnb profit potential in Naples Manor.
Seasonal Strategies for Maximizing Profit
- Peak Season: Maximize revenue through premium pricing and potentially longer minimum stays. Ensure high availability.
- Low Season: Offer competitive pricing, special promotions (e.g., extended stay discounts), and flexible cancellation policies. Target off-season travelers like remote workers or budget-conscious guests.
- Shoulder Seasons: Implement dynamic pricing that balances peak and low rates. Target weekend travelers or specific events. Offer slightly more flexible terms than peak season.
- Regularly analyze your own performance against these Naples Manor seasonality benchmarks and adjust your pricing and availability strategy accordingly.
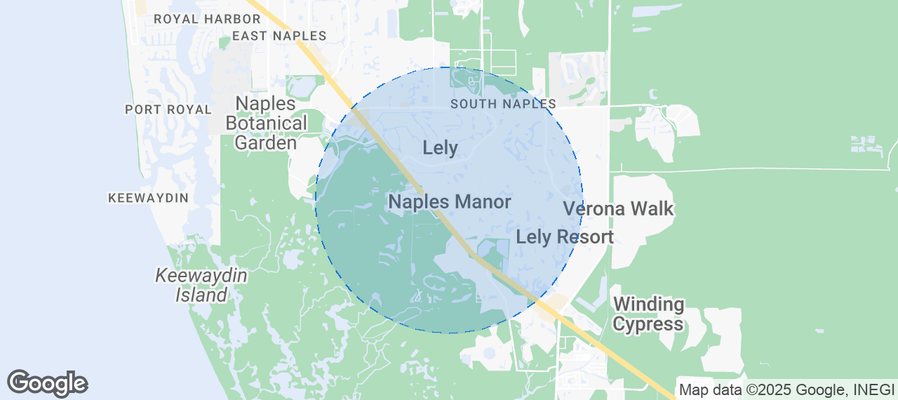
Best Areas for Airbnb Investment in Naples Manor (2025)
Exploring the top neighborhoods for short-term rentals in Naples Manor? This section highlights key areas, outlining why they are attractive for hosts and guests, along with notable local attractions. Consider these locations based on your target guest profile and investment strategy.
| Neighborhood / Area | Why Host Here? (Target Guests & Appeal) | Key Attractions & Landmarks |
|---|---|---|
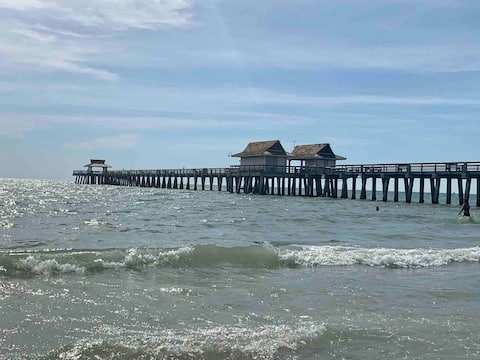
| Naples Beach | A stunning beachfront location known for its beautiful white sand and warm Gulf waters. Popular with tourists seeking relaxation, luxury shopping, and fine dining. | Naples Pier, Clam Pass Park, Fifth Avenue South, Tin City, Lowdermilk Beach Park |
| Old Naples | Historic charm combined with upscale dining and shopping, Old Naples attracts visitors for its unique boutiques and access to beautiful beaches. | Third Street South, Naples Botanical Garden, Cambier Park, Naples Depot Museum, Waterside Shops |
| East Naples | A more affordable area with easy access to restaurants and outdoor activities, appealing to families and budget travelers. | Riviera Golf Club, Naples Zoo, Everglades National Park, Sugden Regional Park, The Naples Preserve |
| North Naples | Popular for its family-friendly neighborhoods, North Naples is close to the beaches and offers various parks and amenities. | Vanderbilt Beach, Delnor-Wiggins Pass State Park, Mercato, Gulfshore Playhouse, Naples Community Park |
| Goodland | A charming and quiet fishing village that captures the essence of old Florida, perfect for those looking to escape the hustle and bustle. | Goodland Boating Park, Stan's Idle Hour, Little Marco Island, Collier Seminole State Park, Rookery Bay National Estuarine Research Reserve |
| Golden Gate | An emerging area that offers newer developments and access to natural parks, great for budget-conscious travelers and families. | Golden Gate Community Park, East Naples Community Park, Big Cypress Preserve, Caloosahatchee National Wildlife Refuge, Naples Botanical Garden |
| Pelican Bay | A luxurious, gated community known for upscale properties and proximity to beautiful beaches and high-end shopping. | Pelican Bay Beach, Artis—Naples, The Baker Museum, The Naples Philharmonic, Pelican Bay Foundation |
| Lely Resort | A resort-style community with a focus on recreation and leisure, making it attractive to both retirees and vacationers. | Lely Resort Golf Club, The Players Club & Spa, Rookery Bay National Estuarine Research Reserve, Treviso Bay Golf Club, Riviera Golf Club |
Understanding Airbnb License Requirements & STR Laws in Naples Manor (2025)
While Naples Manor, Florida, United States currently shows low STR regulations, specific Airbnb license requirements might still exist or change. Always verify the latest short term rental regulations and Airbnb license requirements directly with local government authorities for Naples Manor to ensure full compliance before hosting.
(Source: AirROI data, 2025, finding no licensed listings among those analyzed)
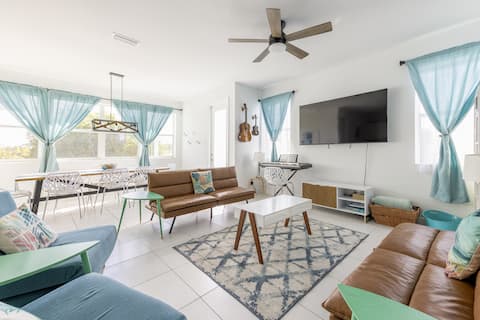
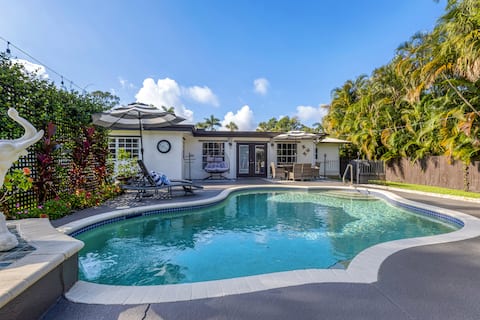
Top Performing Airbnb Properties in Naples Manor (2025)
Benchmark your potential! Explore examples of top-performing Airbnb properties in Naples Manorbased on Trailing Twelve Month (TTM) revenue. Analyze their characteristics, revenue, occupancy rate, and ADR to understand what drives success in this market.
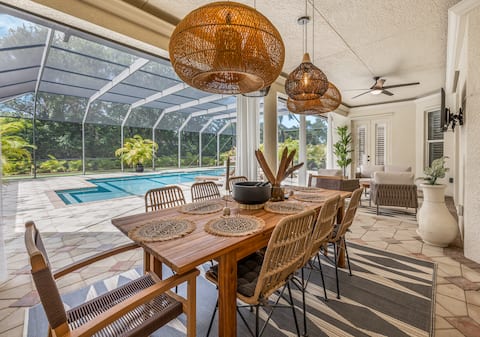
Mediterranean Inspired Villa with Private MiniGolf
Entire Place • 4 bedrooms

Tropical Oasis- Huge Yard/Pool/Tiki Bar/Fire Pit
Entire Place • 3 bedrooms
~Newly Built Home~Private Heated Pool~Sunsets
Entire Place • 3 bedrooms

Lake House where time stops, 15 mins to beach
Entire Place • 1 bedroom
Entire Home w/ Private Heated Pool Sleeps up to 8
Entire Place • 3 bedrooms
Sea Shell Villa 1
Entire Place • 1 bedroom
Note: Performance varies based on location, size, amenities, seasonality, and management quality. Data reflects the past 12 months.
Top Performing Airbnb Hosts in Naples Manor (2025)
Learn from the best! This table showcases top-performing Airbnb hosts in Naples Manor based on the number of properties managed and estimated total revenue over the past year. Analyze their scale and performance metrics.
| Host Name | Properties | Grossing Revenue | Stay Reviews | Avg Rating |
|---|---|---|---|---|
| Kamen | 1 | $86,531 | 24 | 5.00/5.0 |
| Gale | 1 | $83,916 | 51 | 4.98/5.0 |
| Leticia | 2 | $53,321 | 230 | 4.95/5.0 |
| Cheryl | 1 | $51,366 | 61 | 4.90/5.0 |
| Jocelyn | 1 | $46,534 | 45 | 4.87/5.0 |
| Kristin Noel | 1 | $43,554 | 18 | 4.94/5.0 |
| Dovile | 1 | $25,284 | 10 | 5.00/5.0 |
| Lynn | 1 | $23,233 | 8 | 4.13/5.0 |
| Anthony | 1 | $20,326 | 4 | 5.00/5.0 |
| Valerie | 2 | $19,225 | 41 | 4.95/5.0 |
Analyzing the strategies of top hosts, such as their property selection, pricing, and guest communication, can offer valuable lessons for optimizing your own Airbnb operations in Naples Manor.
Dive Deeper: Advanced Naples Manor STR Market Data (2025)
Ready to unlock more insights? AirROI provides access to advanced metrics and comprehensive Airbnb data for Naples Manor. Explore detailed analytics beyond this report to refine your investment strategy, optimize pricing, and maximize your vacation rental profits.
Explore Advanced MetricsNaples Manor Short-Term Rental Market Composition (2025): Property & Room Types
Room Type Distribution
Property Type Distribution
Market Composition Insights for Naples Manor
- The Naples Manor Airbnb market composition is heavily skewed towards Entire Home/Apt listings, which make up 94.4% of the 18 active rentals. This indicates strong guest preference for privacy and space.
- Looking at the property type distribution in Naples Manor, House properties are the most common (66.7%), reflecting the local real estate landscape.
- Houses represent a significant 66.7% portion, catering likely to families or larger groups.
- The presence of 5.6% Hotel/Boutique listings indicates integration with traditional hospitality.
Naples Manor Airbnb Room Capacity Analysis (2025): Bedroom Distribution
Distribution of Listings by Number of Bedrooms
Room Capacity Insights for Naples Manor
- The dominant room capacity in Naples Manor is 3 bedrooms listings, making up 33.3% of the market. This suggests a strong demand for properties suitable for families or small groups.
- Together, 3 bedrooms and 1 bedroom properties represent 61.1% of the active Airbnb listings in Naples Manor, indicating a high concentration in these sizes.
- A significant 44.4% of listings offer 3+ bedrooms, catering to larger groups and families seeking more space in Naples Manor.
Naples Manor Vacation Rental Guest Capacity Trends (2025)
Distribution of Listings by Guest Capacity
Guest Capacity Insights for Naples Manor
- The most common guest capacity trend in Naples Manor vacation rentals is listings accommodating 8+ guests (44.4%). This suggests the primary traveler segment is likely larger groups.
- Properties designed for 8+ guests and 2 guests dominate the Naples Manor STR market, accounting for 66.6% of listings.
- 55.5% of properties accommodate 6+ guests, serving the market segment for larger families or group travel in Naples Manor.
- On average, properties in Naples Manor are equipped to host 5.2 guests.
Naples Manor Airbnb Booking Patterns (2025): Available vs. Booked Days
Available Days Distribution
Booked Days Distribution
Booking Pattern Insights for Naples Manor
- The most common availability pattern in Naples Manor falls within the 271-366 days range, representing 38.9% of listings. This suggests many properties have significant open periods on their calendars.
- Approximately 72.2% of listings show high availability (181+ days open annually), indicating potential for increased bookings or specific owner usage patterns.
- For booked days, the 181-270 days range is most frequent in Naples Manor (33.3%), reflecting common guest stay durations or potential owner blocking patterns.
- A notable 33.3% of properties secure long booking periods (181+ days booked per year), highlighting successful long-term rental strategies or significant owner usage.
Naples Manor Airbnb Minimum Stay Requirements Analysis
Distribution of Listings by Minimum Night Requirement
1 Night
3 listings
16.7% of total
2 Nights
2 listings
11.1% of total
4-6 Nights
1 listings
5.6% of total
7-29 Nights
1 listings
5.6% of total
30+ Nights
11 listings
61.1% of total
Key Insights
- The most prevalent minimum stay requirement in Naples Manor is 30+ Nights, adopted by 61.1% of listings. This highlights the market's preference for longer commitments.
- A significant segment (61.1%) caters to monthly stays (30+ nights) in Naples Manor, pointing to opportunities in the extended-stay market.
Recommendations
- Align with the market by considering a 30+ Nights minimum stay, as 61.1% of Naples Manor hosts use this setting.
- If feasible, allowing 1-night stays, especially midweek or during low season, could capture last-minute bookings, as only 16.7% currently do.
- Explore offering discounts for stays of 30+ nights to attract the 61.1% of the market seeking extended stays.
- Adjust minimum nights based on seasonality – potentially shorter during low season and longer during peak demand periods in Naples Manor.
Naples Manor Airbnb Cancellation Policy Trends Analysis (2025)
Flexible
2 listings
11.8% of total
Moderate
3 listings
17.6% of total
Firm
7 listings
41.2% of total
Strict
5 listings
29.4% of total
Cancellation Policy Insights for Naples Manor
- The prevailing Airbnb cancellation policy trend in Naples Manor is Firm, used by 41.2% of listings.
- A majority (70.6%) of hosts in Naples Manor utilize Firm or Strict policies, indicating a market where hosts prioritize booking security.
Recommendations for Hosts
- Consider adopting a Firm policy to align with the 41.2% market standard in Naples Manor.
- Regularly review your cancellation policy against competitors and market demand shifts in Naples Manor.
Naples Manor STR Booking Lead Time Analysis (2025)
Average Booking Lead Time by Month
Booking Lead Time Insights for Naples Manor
- The overall average booking lead time for vacation rentals in Naples Manor is 60 days.
- Guests book furthest in advance for stays during February (average 121 days), likely coinciding with peak travel demand or local events.
- The shortest booking windows occur for stays in August (average 13 days), indicating more last-minute travel plans during this time.
- Seasonally, Winter (88 days avg.) sees the longest lead times, while Summer (31 days avg.) has the shortest, reflecting typical travel planning cycles.
Recommendations for Hosts
- Use the overall average lead time (60 days) as a baseline for your pricing and availability strategy in Naples Manor.
- For February stays, consider implementing length-of-stay discounts or slightly higher rates for bookings made less than 121 days out to capitalize on advance planning.
- During August, focus on last-minute booking availability and promotions, as guests book with very short notice (13 days avg.).
- Target marketing efforts for the Winter season well in advance (at least 88 days) to capture early planners.
- Monitor your own booking lead times against these Naples Manor averages to identify opportunities for dynamic pricing adjustments.
Popular & Essential Airbnb Amenities in Naples Manor (2025)
Amenity data is currently unavailable for Naples Manor.
Naples Manor Airbnb Guest Demographics & Profile Analysis (2025)
Guest Profile Summary for Naples Manor
- The typical guest profile for Airbnb in Naples Manor consists of primarily domestic travelers (90%), often arriving from nearby Miami, typically belonging to the Post-2000s (Gen Z/Alpha) group (50%), primarily speaking English or Spanish.
- Domestic travelers account for 90.0% of guests.
- Key international markets include United States (90%) and Canada (3%).
- Top languages spoken are English (67.2%) followed by Spanish (23.4%).
- A significant demographic segment is the Post-2000s (Gen Z/Alpha) group, representing 50% of guests.
Recommendations for Hosts
- Target domestic marketing efforts towards travelers from Miami and Fort Lauderdale.
- Tailor amenities and listing descriptions to appeal to the dominant Post-2000s (Gen Z/Alpha) demographic (e.g., highlight fast WiFi, smart home features, local guides).
- Highlight unique local experiences or amenities relevant to the primary guest profile.
- Consider seasonal promotions aligned with peak travel times for key origin markets.
Nearby Short-Term Rental Market Comparison
How does the Naples Manor Airbnb market stack up against its neighbors? Compare key performance metrics like average monthly revenue, ADR, and occupancy rates in surrounding areas to understand the broader regional STR landscape.
| Market | Active Properties | Monthly Revenue | Daily Rate | Avg. Occupancy |
|---|---|---|---|---|
| Sailfish Point | 22 | $20,738 | $1722.53 | 60% |
| Bal Harbour Village | 39 | $9,665 | $856.83 | 39% |
| Lake Clarke Shores | 29 | $7,176 | $490.83 | 51% |
| Anna Maria island | 618 | $6,634 | $761.34 | 41% |
| North Bay Village | 119 | $5,953 | $517.21 | 47% |
| Lighthouse Point | 81 | $5,811 | $454.46 | 52% |
| Pinecrest | 14 | $5,693 | $635.79 | 46% |
| Boca Grande | 36 | $5,480 | $684.31 | 39% |
| Captiva | 257 | $5,223 | $713.64 | 37% |
| Key Biscayne | 117 | $5,142 | $472.14 | 49% |