Orange Park Airbnb Market Analysis 2026: Short Term Rental Data & Vacation Rental Statistics in Florida, United States
Is Airbnb profitable in Orange Park in 2026? Explore comprehensive Airbnb analytics for Orange Park, Florida, United States to uncover income potential. This 2026 STR market report for Orange Park, based on AirROI data from February 2025 to January 2026, reveals key trends in the niche market of 83 active listings.
Whether you're considering an Airbnb investment in Orange Park, optimizing your existing vacation rental, or exploring rental arbitrage opportunities, understanding the Orange Park Airbnb data is crucial. Leveraging the low regulation environment is key to maximizing your short term rental income potential. Let's dive into the specifics.
Key Orange Park Airbnb Performance Metrics Overview
Monthly Airbnb Revenue Variations & Income Potential in Orange Park (2026)
Understanding the monthly revenue variations for Airbnb listings in Orange Park is key to maximizing your short term rental income potential. Seasonality significantly impacts earnings. Our analysis, based on data from the past 12 months, shows that the peak revenue month for STRs in Orange Park is typically July, while January often presents the lowest earnings, highlighting opportunities for strategic pricing adjustments during shoulder and low seasons. Explore the typical Airbnb income in Orange Park across different performance tiers:
- Best-in-class properties (Top 10%) achieve $5,092+ monthly, often utilizing dynamic pricing and superior guest experiences.
- Strong performing properties (Top 25%) earn $3,637 or more, indicating effective management and desirable locations/amenities.
- Typical properties (Median) generate around $2,229 per month, representing the average market performance.
- Entry-level properties (Bottom 25%) see earnings around $1,026, often with potential for optimization.
Average Monthly Airbnb Earnings Trend in Orange Park
Orange Park Airbnb Occupancy Rate Trends (2026)
Maximize your bookings by understanding the Orange Park STR occupancy trends. Seasonal demand shifts significantly influence how often properties are booked. Typically, Junesees the highest demand (peak season occupancy), while January experiences the lowest (low season). Effective strategies, like adjusting minimum stays or offering promotions, can boost occupancy during slower periods. Here's how different property tiers perform in Orange Park:
- Best-in-class properties (Top 10%) achieve 75%+ occupancy, indicating high desirability and potentially optimized availability.
- Strong performing properties (Top 25%) maintain 61% or higher occupancy, suggesting good market fit and guest satisfaction.
- Typical properties (Median) have an occupancy rate around 40%.
- Entry-level properties (Bottom 25%) average 21% occupancy, potentially facing higher vacancy.
Average Monthly Occupancy Rate Trend in Orange Park
Average Daily Rate (ADR) Airbnb Trends in Orange Park (2026)
Effective short term rental pricing strategy in Orange Park involves understanding monthly ADR fluctuations. The Average Daily Rate (ADR) for Airbnb in Orange Park typically peaks in December and dips lowest during February. Leveraging Airbnb dynamic pricing tools or strategies based on this seasonality can significantly boost revenue. Here's a look at the typical nightly rates achieved:
- Best-in-class properties (Top 10%) command rates of $324+ per night, often due to premium features or locations.
- Strong performing properties (Top 25%) achieve nightly rates of $255 or more.
- Typical properties (Median) charge around $161 per night.
- Entry-level properties (Bottom 25%) earn around $69 per night.
Average Daily Rate (ADR) Trend by Month in Orange Park
Get Live Orange Park Market Intelligence 👇

Explore Real-time Analytics
Airbnb Seasonality Analysis & Trends in Orange Park (2026)
Peak Season (July, June, November)
- Revenue averages $2,996 per month
- Occupancy rates average 46.2%
- Daily rates average $180
Shoulder Season
- Revenue averages $2,512 per month
- Occupancy maintains around 40.9%
- Daily rates hold near $178
Low Season (January, February, April)
- Revenue drops to average $2,008 per month
- Occupancy decreases to average 39.3%
- Daily rates adjust to average $167
Seasonality Insights for Orange Park
- The Airbnb seasonality in Orange Park shows moderate seasonality with distinct peak and low periods. While the sections above show seasonal averages, it's also insightful to look at the extremes:
- During the high season, the absolute peak month showcases Orange Park's highest earning potential, with monthly revenues capable of climbing to $3,183, occupancy reaching a high of 49.3%, and ADRs peaking at $200.
- Conversely, the slowest single month of the year, typically falling within the low season, marks the market's lowest point. In this month, revenue might dip to $1,885, occupancy could drop to 28.5%, and ADRs may adjust down to $152.
- Understanding both the seasonal averages and these monthly peaks and troughs in revenue, occupancy, and ADR is crucial for maximizing your Airbnb profit potential in Orange Park.
Seasonal Strategies for Maximizing Profit
- Peak Season: Maximize revenue through premium pricing and potentially longer minimum stays. Ensure high availability.
- Low Season: Offer competitive pricing, special promotions (e.g., extended stay discounts), and flexible cancellation policies. Target off-season travelers like remote workers or budget-conscious guests.
- Shoulder Seasons: Implement dynamic pricing that balances peak and low rates. Target weekend travelers or specific events. Offer slightly more flexible terms than peak season.
- Regularly analyze your own performance against these Orange Park seasonality benchmarks and adjust your pricing and availability strategy accordingly.
Best Areas for Airbnb Investment in Orange Park (2026)
Exploring the top neighborhoods for short-term rentals in Orange Park? This section highlights key areas, outlining why they are attractive for hosts and guests, along with notable local attractions. Consider these locations based on your target guest profile and investment strategy.
| Neighborhood / Area | Why Host Here? (Target Guests & Appeal) | Key Attractions & Landmarks |
|---|---|---|
| Green Cove Springs | Charming historic town located on the banks of the St. Johns River, offering visitors a peaceful retreat and outdoor activities. Great for families and nature lovers. | Cypress Park, Spring Park, St. Johns River, Historic District, Clay County Historical Museum |
| Fruit Cove | Suburban area known for its family-friendly environment and proximity to Jacksonville. Ideal for travelers looking for a quiet stay with easy access to urban amenities. | Julington Durbin Preserve, Fruit Cove Baptist Church, local parks, restaurants, St. Johns River |
| Middleburg | Growing area that provides a mix of suburban and rural charm, with a number of outdoor activities nearby. Perfect for those seeking a slower pace. | Black Creek, Middleburg Park, local farms, nature trails, Augustine's Cafe |
| Doctors Inlet | Quiet community with a variety of outdoor recreational options. A great escape for visitors wanting to enjoy family-friendly activities and nature. | Doctors Lake, local parks, fishing spots, family dining options, nature trails |
| Oakleaf Plantation | Modern planned community with many amenities and family-friendly environments. Attractive for families and business travelers alike. | Oakleaf Town Center, local parks, golf courses, community events, shopping, dining spots |
| Palatka | Quaint town with access to the St. Johns River, rich in history and outdoor activities, making it appealing for visiting nature enthusiasts and history buffs. | Ravine Gardens State Park, St. Johns River, Historic Downtown Palatka, local eateries, Palatka Railroad Bridge Park |
| Saint Augustine | The oldest city in the U.S., rich in history and culture. Highly sought after for tourism, with numerous attractions and a vibrant atmosphere. | Castillo de San Marcos, Historic District, St. Augustine Lighthouse, St. George Street, local restaurants and shops |
| Jacksonville | Located nearby, this is a major city with diverse offerings in business, entertainment, and culture. Excellent for catering to various types of travelers. | Jacksonville Beach, Cummer Museum of Art, St. Johns Town Center, Jacksonville Zoo and Gardens, TIAA Bank Field |
Understanding Airbnb License Requirements & STR Laws in Orange Park (2026)
While Orange Park, Florida, United States currently shows low STR regulations, specific Airbnb license requirements might still exist or change. Always verify the latest short term rental regulations and Airbnb license requirements directly with local government authorities for Orange Park to ensure full compliance before hosting.
(Source: AirROI data, 2026, finding no licensed listings among those analyzed)
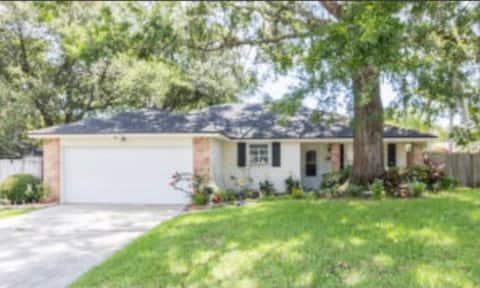
Top Performing Airbnb Properties in Orange Park (2026)
Benchmark your potential! Explore examples of top-performing Airbnb properties in Orange Parkbased on Trailing Twelve Month (TTM) revenue. Analyze their characteristics, revenue, occupancy rate, and ADR to understand what drives success in this market.
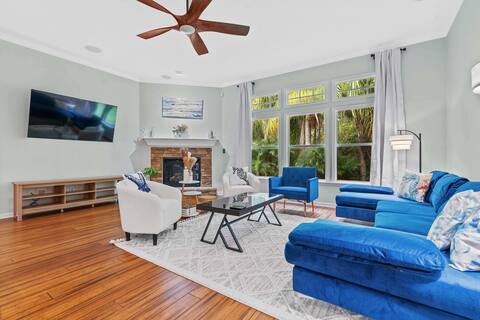
Spacious 5-Bedroom Family Retreat
Entire Place • 5 bedrooms
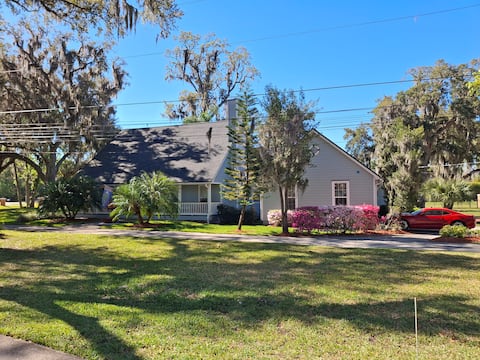
Fleming Island Vacation House
Entire Place • 3 bedrooms
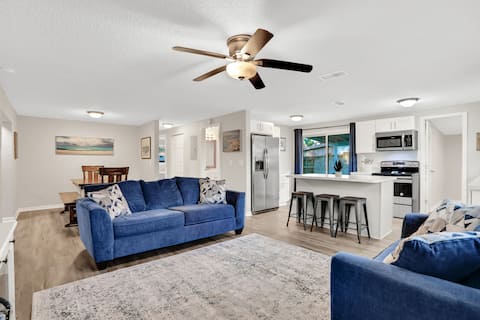
Spacious 5/2 in Orange Park
Entire Place • 5 bedrooms
Cheerful three bedroom home with a pool
Entire Place • 3 bedrooms

Gorgeous circa 1875 Plantation House (in city)
Entire Place • 6 bedrooms
NEW Private OrangePark PoolHome wsh/dry Beach45mn
Entire Place • 3 bedrooms
Note: Performance varies based on location, size, amenities, seasonality, and management quality. Data reflects the past 12 months.
Top Performing Airbnb Hosts in Orange Park (2026)
Learn from the best! This table showcases top-performing Airbnb hosts in Orange Park based on the number of properties managed and estimated total revenue over the past year. Analyze their scale and performance metrics.
| Host Name | Properties | Grossing Revenue | Stay Reviews | Avg Rating |
|---|---|---|---|---|
| John & Andrea | 7 | $192,621 | 352 | 4.95/5.0 |
| Lori | 3 | $115,442 | 627 | 4.91/5.0 |
| Kayla Vong | 4 | $101,070 | 185 | 4.64/5.0 |
| Bunlim | 2 | $79,403 | 317 | 4.81/5.0 |
| Eduard | 2 | $67,819 | 393 | 4.82/5.0 |
| ITrip Florida First Coast | 4 | $65,355 | 81 | 4.70/5.0 |
| Horizon Home | 1 | $65,193 | 103 | 4.71/5.0 |
| Dennis | 1 | $52,536 | 62 | 4.98/5.0 |
| Dawn | 1 | $50,032 | 211 | 4.83/5.0 |
| Mezohn | 2 | $49,642 | 29 | 4.87/5.0 |
Analyzing the strategies of top hosts, such as their property selection, pricing, and guest communication, can offer valuable lessons for optimizing your own Airbnb operations in Orange Park.
Dive Deeper: Advanced Orange Park STR Market Data (2026)
Ready to unlock more insights? AirROI provides access to advanced metrics and comprehensive Airbnb data for Orange Park. Explore detailed analytics beyond this report to refine your investment strategy, optimize pricing, and maximize your vacation rental profits.
Explore Advanced MetricsOrange Park Short-Term Rental Market Composition (2026): Property & Room Types
Room Type Distribution
Property Type Distribution
Market Composition Insights for Orange Park
- The Orange Park Airbnb market composition is heavily skewed towards Entire Home/Apt listings, which make up 81.9% of the 83 active rentals. This indicates strong guest preference for privacy and space.
- Looking at the property type distribution in Orange Park, House properties are the most common (81.9%), reflecting the local real estate landscape.
- Houses represent a significant 81.9% portion, catering likely to families or larger groups.
- Smaller segments like hotel/boutique, others, outdoor/unique (combined 10.8%) offer potential for unique stay experiences.
Orange Park Airbnb Room Capacity Analysis (2026): Bedroom Distribution
Distribution of Listings by Number of Bedrooms
Room Capacity Insights for Orange Park
- The dominant room capacity in Orange Park is 3 bedrooms listings, making up 30.1% of the market. This suggests a strong demand for properties suitable for families or small groups.
- Together, 3 bedrooms and 4 bedrooms properties represent 48.2% of the active Airbnb listings in Orange Park, indicating a high concentration in these sizes.
- A significant 55.4% of listings offer 3+ bedrooms, catering to larger groups and families seeking more space in Orange Park.
Orange Park Vacation Rental Guest Capacity Trends (2026)
Distribution of Listings by Guest Capacity
Guest Capacity Insights for Orange Park
- The most common guest capacity trend in Orange Park vacation rentals is listings accommodating 8+ guests (39.8%). This suggests the primary traveler segment is likely larger groups.
- Properties designed for 8+ guests and 6 guests dominate the Orange Park STR market, accounting for 57.9% of listings.
- 60.3% of properties accommodate 6+ guests, serving the market segment for larger families or group travel in Orange Park.
- On average, properties in Orange Park are equipped to host 5.2 guests.
Orange Park Airbnb Booking Patterns (2026): Available vs. Booked Days
Available Days Distribution
Booked Days Distribution
Booking Pattern Insights for Orange Park
- The most common availability pattern in Orange Park falls within the 271-366 days range, representing 45.8% of listings. This suggests many properties have significant open periods on their calendars.
- Approximately 78.3% of listings show high availability (181+ days open annually), indicating potential for increased bookings or specific owner usage patterns.
- For booked days, the 91-180 days range is most frequent in Orange Park (33.7%), reflecting common guest stay durations or potential owner blocking patterns.
- A notable 22.9% of properties secure long booking periods (181+ days booked per year), highlighting successful long-term rental strategies or significant owner usage.
Orange Park Airbnb Minimum Stay Requirements Analysis
Distribution of Listings by Minimum Night Requirement
1 Night
20 listings
24.1% of total
2 Nights
34 listings
41% of total
3 Nights
6 listings
7.2% of total
7-29 Nights
5 listings
6% of total
30+ Nights
18 listings
21.7% of total
Key Insights
- The most prevalent minimum stay requirement in Orange Park is 2 Nights, adopted by 41% of listings. This highlights the market's preference for shorter, flexible bookings.
- A strong majority (65.1%) of the Orange Park Airbnb data shows acceptance of very short stays (1-2 nights), indicating a dynamic, high-turnover market.
- A significant segment (21.7%) caters to monthly stays (30+ nights) in Orange Park, pointing to opportunities in the extended-stay market.
Recommendations
- Align with the market by considering a 2 Nights minimum stay, as 41% of Orange Park hosts use this setting.
- If feasible, allowing 1-night stays, especially midweek or during low season, could capture last-minute bookings, as only 24.1% currently do.
- Explore offering discounts for stays of 30+ nights to attract the 21.7% of the market seeking extended stays.
- Adjust minimum nights based on seasonality – potentially shorter during low season and longer during peak demand periods in Orange Park.
Orange Park Airbnb Cancellation Policy Trends Analysis (2026)
Limited
1 listings
1.2% of total
Flexible
15 listings
18.1% of total
Moderate
31 listings
37.3% of total
Firm
28 listings
33.7% of total
Strict
8 listings
9.6% of total
Cancellation Policy Insights for Orange Park
- The prevailing Airbnb cancellation policy trend in Orange Park is Moderate, used by 37.3% of listings.
- There's a relatively balanced mix between guest-friendly (55.4%) and stricter (43.3%) policies, offering choices for different guest needs.
- Strict cancellation policies are quite rare (9.6%), potentially making listings with this policy less competitive unless justified by high demand or property type.
Recommendations for Hosts
- Consider adopting a Moderate policy to align with the 37.3% market standard in Orange Park.
- Using a Strict policy might deter some guests, as only 9.6% of listings use it. Evaluate if potential revenue protection outweighs possible lower booking rates.
- Regularly review your cancellation policy against competitors and market demand shifts in Orange Park.
Orange Park STR Booking Lead Time Analysis (2026)
Average Booking Lead Time by Month
Booking Lead Time Insights for Orange Park
- The overall average booking lead time for vacation rentals in Orange Park is 26 days.
- Guests book furthest in advance for stays during November (average 59 days), likely coinciding with peak travel demand or local events.
- The shortest booking windows occur for stays in August (average 18 days), indicating more last-minute travel plans during this time.
- Seasonally, Fall (38 days avg.) sees the longest lead times, while Summer (27 days avg.) has the shortest, reflecting typical travel planning cycles.
Recommendations for Hosts
- Use the overall average lead time (26 days) as a baseline for your pricing and availability strategy in Orange Park.
- For November stays, consider implementing length-of-stay discounts or slightly higher rates for bookings made less than 59 days out to capitalize on advance planning.
- Target marketing efforts for the Fall season well in advance (at least 38 days) to capture early planners.
- Monitor your own booking lead times against these Orange Park averages to identify opportunities for dynamic pricing adjustments.
Popular & Essential Airbnb Amenities in Orange Park (2026)
Amenity Prevalence
Amenity Insights for Orange Park
- Essential amenities in Orange Park that guests expect include: Air conditioning, Wifi, TV, Smoke alarm, Free parking on premises, Kitchen, Hot water. Lacking these (any) could significantly impact bookings.
- Popular amenities like Microwave, Heating, Coffee maker are common but not universal. Offering these can provide a competitive edge.
Recommendations for Hosts
- Ensure your listing includes all essential amenities for Orange Park: Air conditioning, Wifi, TV, Smoke alarm, Free parking on premises, Kitchen, Hot water.
- Prioritize adding missing essentials: Wifi, TV, Smoke alarm, Free parking on premises, Kitchen, Hot water.
- Consider adding popular differentiators like Microwave or Heating to increase appeal.
- Highlight unique or less common amenities you offer (e.g., hot tub, dedicated workspace, EV charger) in your listing description and photos.
- Regularly check competitor amenities in Orange Park to stay competitive.
Orange Park Airbnb Guest Demographics & Profile Analysis (2026)
Guest Profile Summary for Orange Park
- The typical guest profile for Airbnb in Orange Park consists of primarily domestic travelers (98%), often arriving from nearby Jacksonville, typically belonging to the Post-2000s (Gen Z/Alpha) group (50%), primarily speaking English or Spanish.
- Domestic travelers account for 97.8% of guests.
- Key international markets include United States (97.8%) and United Kingdom (0.6%).
- Top languages spoken are English (78.7%) followed by Spanish (15.6%).
- A significant demographic segment is the Post-2000s (Gen Z/Alpha) group, representing 50% of guests.
Recommendations for Hosts
- Target domestic marketing efforts towards travelers from Jacksonville and Orange Park.
- Tailor amenities and listing descriptions to appeal to the dominant Post-2000s (Gen Z/Alpha) demographic (e.g., highlight fast WiFi, smart home features, local guides).
- Highlight unique local experiences or amenities relevant to the primary guest profile.
- Consider seasonal promotions aligned with peak travel times for key origin markets.
Nearby Short-Term Rental Market Comparison
How does the Orange Park Airbnb market stack up against its neighbors? Compare key performance metrics like average monthly revenue, ADR, and occupancy rates in surrounding areas to understand the broader regional STR landscape.
| Market | Active Properties | Monthly Revenue | Daily Rate | Avg. Occupancy |
|---|---|---|---|---|
| St. Johns County | 12 | $6,964 | $592.43 | 47% |
| Ponte Vedra Beach | 224 | $5,720 | $574.75 | 43% |
| Vilano Beach | 173 | $5,571 | $442.95 | 45% |
| St. Simons | 91 | $4,162 | $379.84 | 42% |
| Jacksonville Beach | 763 | $4,123 | $328.32 | 49% |
| Saint Augustine | 1,749 | $3,586 | $287.24 | 46% |
| Montgomery | 11 | $3,557 | $246.45 | 54% |
| Saint Simons | 902 | $3,532 | $375.60 | 38% |
| Isle of Hope | 32 | $3,502 | $271.42 | 46% |
| Hammock Beach | 197 | $3,498 | $441.99 | 39% |