Ponte Vedra Beach Airbnb Market Analysis 2026: Short Term Rental Data & Vacation Rental Statistics in Florida, United States
Is Airbnb profitable in Ponte Vedra Beach in 2026? Explore comprehensive Airbnb analytics for Ponte Vedra Beach, Florida, United States to uncover income potential. This 2026 STR market report for Ponte Vedra Beach, based on AirROI data from February 2025 to January 2026, reveals key trends in the market of 224 active listings.
Whether you're considering an Airbnb investment in Ponte Vedra Beach, optimizing your existing vacation rental, or exploring rental arbitrage opportunities, understanding the Ponte Vedra Beach Airbnb data is crucial. Leveraging the low regulation environment is key to maximizing your short term rental income potential. Let's dive into the specifics.
Key Ponte Vedra Beach Airbnb Performance Metrics Overview
Monthly Airbnb Revenue Variations & Income Potential in Ponte Vedra Beach (2026)
Understanding the monthly revenue variations for Airbnb listings in Ponte Vedra Beach is key to maximizing your short term rental income potential. Seasonality significantly impacts earnings. Our analysis, based on data from the past 12 months, shows that the peak revenue month for STRs in Ponte Vedra Beach is typically July, while January often presents the lowest earnings, highlighting opportunities for strategic pricing adjustments during shoulder and low seasons. Explore the typical Airbnb income in Ponte Vedra Beach across different performance tiers:
- Best-in-class properties (Top 10%) achieve $17,078+ monthly, often utilizing dynamic pricing and superior guest experiences.
- Strong performing properties (Top 25%) earn $11,005 or more, indicating effective management and desirable locations/amenities.
- Typical properties (Median) generate around $5,373 per month, representing the average market performance.
- Entry-level properties (Bottom 25%) see earnings around $2,910, often with potential for optimization.
Average Monthly Airbnb Earnings Trend in Ponte Vedra Beach
Ponte Vedra Beach Airbnb Occupancy Rate Trends (2026)
Maximize your bookings by understanding the Ponte Vedra Beach STR occupancy trends. Seasonal demand shifts significantly influence how often properties are booked. Typically, Junesees the highest demand (peak season occupancy), while January experiences the lowest (low season). Effective strategies, like adjusting minimum stays or offering promotions, can boost occupancy during slower periods. Here's how different property tiers perform in Ponte Vedra Beach:
- Best-in-class properties (Top 10%) achieve 82%+ occupancy, indicating high desirability and potentially optimized availability.
- Strong performing properties (Top 25%) maintain 64% or higher occupancy, suggesting good market fit and guest satisfaction.
- Typical properties (Median) have an occupancy rate around 44%.
- Entry-level properties (Bottom 25%) average 23% occupancy, potentially facing higher vacancy.
Average Monthly Occupancy Rate Trend in Ponte Vedra Beach
Average Daily Rate (ADR) Airbnb Trends in Ponte Vedra Beach (2026)
Effective short term rental pricing strategy in Ponte Vedra Beach involves understanding monthly ADR fluctuations. The Average Daily Rate (ADR) for Airbnb in Ponte Vedra Beach typically peaks in December and dips lowest during February. Leveraging Airbnb dynamic pricing tools or strategies based on this seasonality can significantly boost revenue. Here's a look at the typical nightly rates achieved:
- Best-in-class properties (Top 10%) command rates of $994+ per night, often due to premium features or locations.
- Strong performing properties (Top 25%) achieve nightly rates of $752 or more.
- Typical properties (Median) charge around $485 per night.
- Entry-level properties (Bottom 25%) earn around $259 per night.
Average Daily Rate (ADR) Trend by Month in Ponte Vedra Beach
Get Live Ponte Vedra Beach Market Intelligence 👇

Explore Real-time Analytics
Airbnb Seasonality Analysis & Trends in Ponte Vedra Beach (2026)
Peak Season (July, June, March)
- Revenue averages $10,777 per month
- Occupancy rates average 56.2%
- Daily rates average $576
Shoulder Season
- Revenue averages $7,468 per month
- Occupancy maintains around 44.4%
- Daily rates hold near $551
Low Season (January, September, October)
- Revenue drops to average $5,617 per month
- Occupancy decreases to average 34.8%
- Daily rates adjust to average $552
Seasonality Insights for Ponte Vedra Beach
- The Airbnb seasonality in Ponte Vedra Beach shows highly seasonal trends requiring careful strategy. While the sections above show seasonal averages, it's also insightful to look at the extremes:
- During the high season, the absolute peak month showcases Ponte Vedra Beach's highest earning potential, with monthly revenues capable of climbing to $11,210, occupancy reaching a high of 57.7%, and ADRs peaking at $593.
- Conversely, the slowest single month of the year, typically falling within the low season, marks the market's lowest point. In this month, revenue might dip to $4,388, occupancy could drop to 31.6%, and ADRs may adjust down to $518.
- Understanding both the seasonal averages and these monthly peaks and troughs in revenue, occupancy, and ADR is crucial for maximizing your Airbnb profit potential in Ponte Vedra Beach.
Seasonal Strategies for Maximizing Profit
- Peak Season: Maximize revenue through premium pricing and potentially longer minimum stays. Ensure high availability.
- Low Season: Offer competitive pricing, special promotions (e.g., extended stay discounts), and flexible cancellation policies. Target off-season travelers like remote workers or budget-conscious guests.
- Shoulder Seasons: Implement dynamic pricing that balances peak and low rates. Target weekend travelers or specific events. Offer slightly more flexible terms than peak season.
- Regularly analyze your own performance against these Ponte Vedra Beach seasonality benchmarks and adjust your pricing and availability strategy accordingly.
Best Areas for Airbnb Investment in Ponte Vedra Beach (2026)
Exploring the top neighborhoods for short-term rentals in Ponte Vedra Beach? This section highlights key areas, outlining why they are attractive for hosts and guests, along with notable local attractions. Consider these locations based on your target guest profile and investment strategy.
| Neighborhood / Area | Why Host Here? (Target Guests & Appeal) | Key Attractions & Landmarks |
|---|---|---|
| Ponte Vedra Beach | A serene coastal town known for its pristine beaches and upscale lifestyle. It attracts vacationers looking for relaxation and golf enthusiasts, making it a prime location for Airbnb hosting. | Ponte Vedra Beach, TPC Sawgrass, Guana Tolomato Matanzas National Estuarine Research Reserve, Ponte Vedra Inn and Club, Mickler's Landing Beach |
| Sawgrass | Home to the famous TPC Sawgrass golf course, this area is popular among golf lovers and visitors attending tournaments. It's an excellent choice for investors targeting sports enthusiasts. | TPC Sawgrass, The Sawgrass Village, Sawgrass Marriott Golf Resort & Spa |
| Nocatee | A rapidly growing planned community nearby, offering a family-friendly atmosphere with parks and recreational options. Ideal for family-oriented travelers and those seeking short-term rentals. | Nocatee Preserve, Kayak Rentals at Nocatee, Nocatee Splash Waterpark |
| The Beaches of Vilano | A charming coastal area just north of Ponte Vedra, offering a more laid-back beach experience with local shops and restaurants. Attracts those looking for a quieter beach getaway. | Vilano Beach, Vilano Beach Fishing Pier, local dining spots |
| Crescent Beach | Known for its picturesque shoreline and natural beauty, Crescent Beach is perfect for visitors looking to enjoy outdoor activities and the scenic coast. | Crescent Beach, Anastasia State Park, local seafood restaurants |
| South Ponte Vedra Beach | Offers a tranquil beach experience with beautiful views and access to nature, making it appealing for couples and nature lovers seeking a romantic retreat. | South Ponte Vedra Beach, Guana Tolomato Matanzas NERR, local beach access points |
| Surfside Beach | A hidden gem offering a more private beach atmosphere, ideal for travelers wanting seclusion while still being close to Ponte Vedra's amenities. | Surfside Beach, public beach access points, cozy local shops |
| Palm Valley | Just inland, Palm Valley is known for its scenic landscapes and proximity to golf courses and parks, appealing to both golf enthusiasts and nature lovers looking for a variety of activities. | Palm Valley Golf Club, Mickler's Landing Beach, local parks and trails |
Understanding Airbnb License Requirements & STR Laws in Ponte Vedra Beach (2026)
While Ponte Vedra Beach, Florida, United States currently shows low STR regulations, specific Airbnb license requirements might still exist or change. Always verify the latest short term rental regulations and Airbnb license requirements directly with local government authorities for Ponte Vedra Beach to ensure full compliance before hosting.
(Source: AirROI data, 2026, finding no licensed listings among those analyzed)
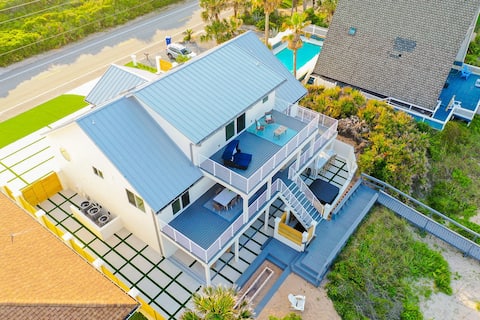
Top Performing Airbnb Properties in Ponte Vedra Beach (2026)
Benchmark your potential! Explore examples of top-performing Airbnb properties in Ponte Vedra Beachbased on Trailing Twelve Month (TTM) revenue. Analyze their characteristics, revenue, occupancy rate, and ADR to understand what drives success in this market.
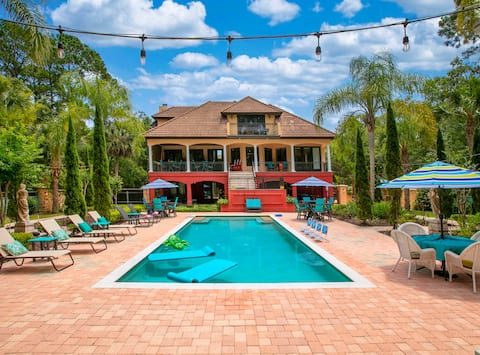
Secluded Estate - House, Cottage, Pool & Ocean!
Entire Place • 5 bedrooms
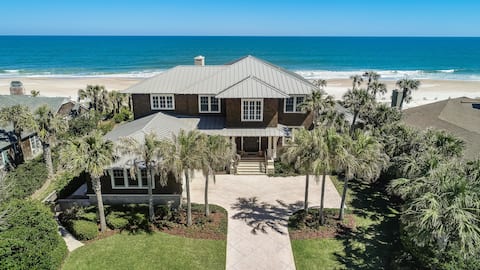
Gorgeous Ponte Vedra Oceanfront!
Entire Place • 5 bedrooms
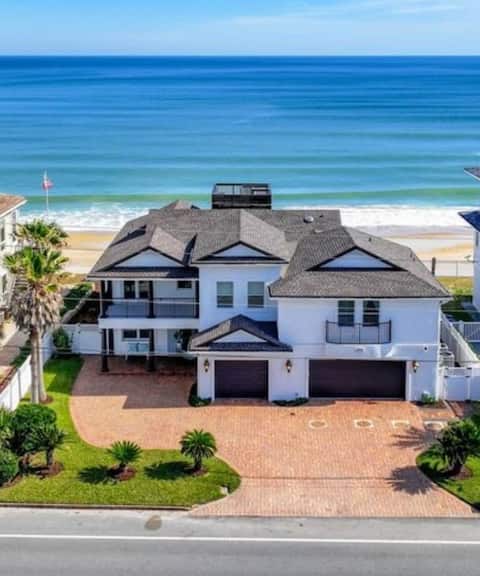
The Windsurfer Oasis Oceanfront-Ponte Vedra Beach
Entire Place • 6 bedrooms
Beachfront Paradise - Beach House
Entire Place • 7 bedrooms
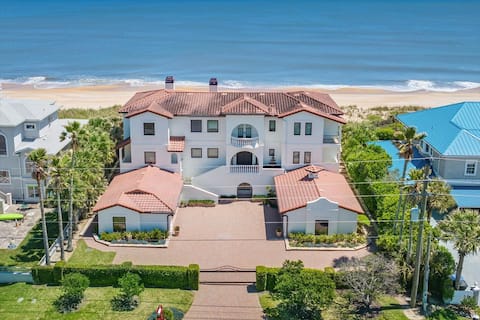
"Seaside Serenity"- Pool Table, Hot Tub, Luxury
Entire Place • 6 bedrooms

Sea Spray - 3001
Entire Place • 4 bedrooms
Note: Performance varies based on location, size, amenities, seasonality, and management quality. Data reflects the past 12 months.
Top Performing Airbnb Hosts in Ponte Vedra Beach (2026)
Learn from the best! This table showcases top-performing Airbnb hosts in Ponte Vedra Beach based on the number of properties managed and estimated total revenue over the past year. Analyze their scale and performance metrics.
| Host Name | Properties | Grossing Revenue | Stay Reviews | Avg Rating |
|---|---|---|---|---|
| Wren Beach By Portoro | 40 | $2,416,485 | 198 | 4.69/5.0 |
| Distinctive Beach Rentals | 11 | $594,245 | 95 | 4.70/5.0 |
| Rachel Elaine | 5 | $485,139 | 140 | 4.67/5.0 |
| Destination Paradise | 2 | $452,539 | 52 | 4.89/5.0 |
| Andrew | 3 | $435,780 | 35 | 4.99/5.0 |
| Dale | 1 | $435,172 | 164 | 4.98/5.0 |
| Marita | 7 | $426,909 | 75 | 4.95/5.0 |
| Kel | 3 | $386,702 | 52 | 4.92/5.0 |
| Bagby Investment Properties LL | 2 | $385,847 | 102 | 4.86/5.0 |
| Suncastle Properties Of Ponte | 18 | $357,721 | 171 | 4.54/5.0 |
Analyzing the strategies of top hosts, such as their property selection, pricing, and guest communication, can offer valuable lessons for optimizing your own Airbnb operations in Ponte Vedra Beach.
Dive Deeper: Advanced Ponte Vedra Beach STR Market Data (2026)
Ready to unlock more insights? AirROI provides access to advanced metrics and comprehensive Airbnb data for Ponte Vedra Beach. Explore detailed analytics beyond this report to refine your investment strategy, optimize pricing, and maximize your vacation rental profits.
Explore Advanced MetricsPonte Vedra Beach Short-Term Rental Market Composition (2026): Property & Room Types
Room Type Distribution
Property Type Distribution
Market Composition Insights for Ponte Vedra Beach
- The Ponte Vedra Beach Airbnb market composition is heavily skewed towards Entire Home/Apt listings, which make up 97.3% of the 224 active rentals. This indicates strong guest preference for privacy and space.
- Looking at the property type distribution in Ponte Vedra Beach, House properties are the most common (72.3%), reflecting the local real estate landscape.
- Houses represent a significant 72.3% portion, catering likely to families or larger groups.
- Smaller segments like hotel/boutique, others (combined 3.1%) offer potential for unique stay experiences.
Ponte Vedra Beach Airbnb Room Capacity Analysis (2026): Bedroom Distribution
Distribution of Listings by Number of Bedrooms
Room Capacity Insights for Ponte Vedra Beach
- The dominant room capacity in Ponte Vedra Beach is 3 bedrooms listings, making up 27.2% of the market. This suggests a strong demand for properties suitable for families or small groups.
- Together, 3 bedrooms and 4 bedrooms properties represent 49.1% of the active Airbnb listings in Ponte Vedra Beach, indicating a high concentration in these sizes.
- A significant 65.6% of listings offer 3+ bedrooms, catering to larger groups and families seeking more space in Ponte Vedra Beach.
Ponte Vedra Beach Vacation Rental Guest Capacity Trends (2026)
Distribution of Listings by Guest Capacity
Guest Capacity Insights for Ponte Vedra Beach
- The most common guest capacity trend in Ponte Vedra Beach vacation rentals is listings accommodating 8+ guests (52.2%). This suggests the primary traveler segment is likely larger groups.
- Properties designed for 8+ guests and 4 guests dominate the Ponte Vedra Beach STR market, accounting for 69.2% of listings.
- 72.8% of properties accommodate 6+ guests, serving the market segment for larger families or group travel in Ponte Vedra Beach.
- On average, properties in Ponte Vedra Beach are equipped to host 6.4 guests.
Ponte Vedra Beach Airbnb Booking Patterns (2026): Available vs. Booked Days
Available Days Distribution
Booked Days Distribution
Booking Pattern Insights for Ponte Vedra Beach
- The most common availability pattern in Ponte Vedra Beach falls within the 271-366 days range, representing 44.6% of listings. This suggests many properties have significant open periods on their calendars.
- Approximately 73.6% of listings show high availability (181+ days open annually), indicating potential for increased bookings or specific owner usage patterns.
- For booked days, the 31-90 days range is most frequent in Ponte Vedra Beach (30.4%), reflecting common guest stay durations or potential owner blocking patterns.
- A notable 28.6% of properties secure long booking periods (181+ days booked per year), highlighting successful long-term rental strategies or significant owner usage.
Ponte Vedra Beach Airbnb Minimum Stay Requirements Analysis
Distribution of Listings by Minimum Night Requirement
1 Night
12 listings
5.4% of total
2 Nights
18 listings
8% of total
3 Nights
19 listings
8.5% of total
4-6 Nights
60 listings
26.8% of total
7-29 Nights
11 listings
4.9% of total
30+ Nights
104 listings
46.4% of total
Key Insights
- The most prevalent minimum stay requirement in Ponte Vedra Beach is 30+ Nights, adopted by 46.4% of listings. This highlights the market's preference for longer commitments.
- Very short stays (1-2 nights) are less common (13.4%), suggesting hosts prefer slightly longer bookings to optimize turnover.
- A significant segment (46.4%) caters to monthly stays (30+ nights) in Ponte Vedra Beach, pointing to opportunities in the extended-stay market.
Recommendations
- Align with the market by considering a 30+ Nights minimum stay, as 46.4% of Ponte Vedra Beach hosts use this setting.
- If feasible, allowing 1-night stays, especially midweek or during low season, could capture last-minute bookings, as only 5.4% currently do.
- Explore offering discounts for stays of 30+ nights to attract the 46.4% of the market seeking extended stays.
- Adjust minimum nights based on seasonality – potentially shorter during low season and longer during peak demand periods in Ponte Vedra Beach.
Ponte Vedra Beach Airbnb Cancellation Policy Trends Analysis (2026)
Super Strict 30 Days
4 listings
1.8% of total
Limited
3 listings
1.4% of total
Super Strict 60 Days
3 listings
1.4% of total
Flexible
12 listings
5.4% of total
Moderate
35 listings
15.8% of total
Firm
133 listings
59.9% of total
Strict
32 listings
14.4% of total
Cancellation Policy Insights for Ponte Vedra Beach
- The prevailing Airbnb cancellation policy trend in Ponte Vedra Beach is Firm, used by 59.9% of listings.
- A majority (74.3%) of hosts in Ponte Vedra Beach utilize Firm or Strict policies, indicating a market where hosts prioritize booking security.
Recommendations for Hosts
- Consider adopting a Firm policy to align with the 59.9% market standard in Ponte Vedra Beach.
- Using a Strict policy might deter some guests, as only 14.4% of listings use it. Evaluate if potential revenue protection outweighs possible lower booking rates.
- Regularly review your cancellation policy against competitors and market demand shifts in Ponte Vedra Beach.
Ponte Vedra Beach STR Booking Lead Time Analysis (2026)
Average Booking Lead Time by Month
Booking Lead Time Insights for Ponte Vedra Beach
- The overall average booking lead time for vacation rentals in Ponte Vedra Beach is 71 days.
- Guests book furthest in advance for stays during November (average 84 days), likely coinciding with peak travel demand or local events.
- The shortest booking windows occur for stays in September (average 54 days), indicating more last-minute travel plans during this time.
- Seasonally, Fall (74 days avg.) sees the longest lead times, while Winter (67 days avg.) has the shortest, reflecting typical travel planning cycles.
Recommendations for Hosts
- Use the overall average lead time (71 days) as a baseline for your pricing and availability strategy in Ponte Vedra Beach.
- For November stays, consider implementing length-of-stay discounts or slightly higher rates for bookings made less than 84 days out to capitalize on advance planning.
- Target marketing efforts for the Fall season well in advance (at least 74 days) to capture early planners.
- Monitor your own booking lead times against these Ponte Vedra Beach averages to identify opportunities for dynamic pricing adjustments.
Popular & Essential Airbnb Amenities in Ponte Vedra Beach (2026)
Amenity Prevalence
Amenity Insights for Ponte Vedra Beach
- Essential amenities in Ponte Vedra Beach that guests expect include: Wifi, Air conditioning, TV, Smoke alarm, Heating, Kitchen, Free parking on premises, Washer, Coffee maker, Dishes and silverware. Lacking these (any) could significantly impact bookings.
Recommendations for Hosts
- Ensure your listing includes all essential amenities for Ponte Vedra Beach: Wifi, Air conditioning, TV, Smoke alarm, Heating, Kitchen, Free parking on premises, Washer, Coffee maker, Dishes and silverware.
- Prioritize adding missing essentials: TV, Smoke alarm, Heating, Kitchen, Free parking on premises, Washer, Coffee maker, Dishes and silverware.
- Highlight unique or less common amenities you offer (e.g., hot tub, dedicated workspace, EV charger) in your listing description and photos.
- Regularly check competitor amenities in Ponte Vedra Beach to stay competitive.
Ponte Vedra Beach Airbnb Guest Demographics & Profile Analysis (2026)
Guest Profile Summary for Ponte Vedra Beach
- The typical guest profile for Airbnb in Ponte Vedra Beach consists of primarily domestic travelers (96%), often arriving from nearby Jacksonville, typically belonging to the Post-2000s (Gen Z/Alpha) group (50%), primarily speaking English or Spanish.
- Domestic travelers account for 96.2% of guests.
- Key international markets include United States (96.2%) and United Kingdom (1%).
- Top languages spoken are English (76.8%) followed by Spanish (13.5%).
- A significant demographic segment is the Post-2000s (Gen Z/Alpha) group, representing 50% of guests.
Recommendations for Hosts
- Target domestic marketing efforts towards travelers from Jacksonville and Atlanta.
- Tailor amenities and listing descriptions to appeal to the dominant Post-2000s (Gen Z/Alpha) demographic (e.g., highlight fast WiFi, smart home features, local guides).
- Highlight unique local experiences or amenities relevant to the primary guest profile.
- Consider seasonal promotions aligned with peak travel times for key origin markets.
Nearby Short-Term Rental Market Comparison
How does the Ponte Vedra Beach Airbnb market stack up against its neighbors? Compare key performance metrics like average monthly revenue, ADR, and occupancy rates in surrounding areas to understand the broader regional STR landscape.
| Market | Active Properties | Monthly Revenue | Daily Rate | Avg. Occupancy |
|---|---|---|---|---|
| St. Johns County | 12 | $6,964 | $592.43 | 47% |
| Vilano Beach | 173 | $5,571 | $442.95 | 45% |
| St. Simons | 91 | $4,162 | $379.84 | 42% |
| Jacksonville Beach | 763 | $4,123 | $328.32 | 49% |
| Saint Augustine | 1,749 | $3,586 | $287.24 | 46% |
| Montgomery | 11 | $3,557 | $246.45 | 54% |
| Saint Simons | 902 | $3,532 | $375.60 | 38% |
| Isle of Hope | 32 | $3,502 | $271.42 | 46% |
| Hammock Beach | 197 | $3,498 | $441.99 | 39% |
| St. Augustine Beach | 23 | $3,492 | $314.00 | 39% |