Port St. Lucie Airbnb Market Analysis 2025: Short Term Rental Data & Vacation Rental Statistics in Florida, United States
Is Airbnb profitable in Port St. Lucie in 2025? Explore comprehensive Airbnb analytics for Port St. Lucie, Florida, United States to uncover income potential. This 2025 STR market report for Port St. Lucie, based on AirROI data from April 2024 to March 2025, reveals key trends in the niche market of 158 active listings.
Whether you're considering an Airbnb investment in Port St. Lucie, optimizing your existing vacation rental, or exploring rental arbitrage opportunities, understanding the Port St. Lucie Airbnb data is crucial. Leveraging the low regulation environment is key to maximizing your short term rental income potential. Let's dive into the specifics.
Key Port St. Lucie Airbnb Performance Metrics Overview
Monthly Airbnb Revenue Variations & Income Potential in Port St. Lucie (2025)
Understanding the monthly revenue variations for Airbnb listings in Port St. Lucie is key to maximizing your short term rental income potential. Seasonality significantly impacts earnings. Our analysis, based on data from the past 12 months, shows that the peak revenue month for STRs in Port St. Lucie is typically January, while September often presents the lowest earnings, highlighting opportunities for strategic pricing adjustments during shoulder and low seasons. Explore the typical Airbnb income in Port St. Lucie across different performance tiers:
- Best-in-class properties (Top 10%) achieve $3,990+ monthly, often utilizing dynamic pricing and superior guest experiences.
- Strong performing properties (Top 25%) earn $2,893 or more, indicating effective management and desirable locations/amenities.
- Typical properties (Median) generate around $2,109 per month, representing the average market performance.
- Entry-level properties (Bottom 25%) see earnings around $1,214, often with potential for optimization.
Average Monthly Airbnb Earnings Trend in Port St. Lucie
Port St. Lucie Airbnb Occupancy Rate Trends (2025)
Maximize your bookings by understanding the Port St. Lucie STR occupancy trends. Seasonal demand shifts significantly influence how often properties are booked. Typically, Februarysees the highest demand (peak season occupancy), while April experiences the lowest (low season). Effective strategies, like adjusting minimum stays or offering promotions, can boost occupancy during slower periods. Here's how different property tiers perform in Port St. Lucie:
- Best-in-class properties (Top 10%) achieve 89%+ occupancy, indicating high desirability and potentially optimized availability.
- Strong performing properties (Top 25%) maintain 76% or higher occupancy, suggesting good market fit and guest satisfaction.
- Typical properties (Median) have an occupancy rate around 53%.
- Entry-level properties (Bottom 25%) average 29% occupancy, potentially facing higher vacancy.
Average Monthly Occupancy Rate Trend in Port St. Lucie
Average Daily Rate (ADR) Airbnb Trends in Port St. Lucie (2025)
Effective short term rental pricing strategy in Port St. Lucie involves understanding monthly ADR fluctuations. The Average Daily Rate (ADR) for Airbnb in Port St. Lucie typically peaks in February and dips lowest during August. Leveraging Airbnb dynamic pricing tools or strategies based on this seasonality can significantly boost revenue. Here's a look at the typical nightly rates achieved:
- Best-in-class properties (Top 10%) command rates of $237+ per night, often due to premium features or locations.
- Strong performing properties (Top 25%) achieve nightly rates of $166 or more.
- Typical properties (Median) charge around $120 per night.
- Entry-level properties (Bottom 25%) earn around $90 per night.
Average Daily Rate (ADR) Trend by Month in Port St. Lucie
Get Live Port St. Lucie Market Intelligence 👇

Explore Real-time Analytics
Airbnb Seasonality Analysis & Trends in Port St. Lucie (2025)
Peak Season (January, February, March)
- Revenue averages $3,280 per month
- Occupancy rates average 63.8%
- Daily rates average $184
Shoulder Season
- Revenue averages $2,400 per month
- Occupancy maintains around 50.2%
- Daily rates hold near $142
Low Season (August, September, October)
- Revenue drops to average $1,674 per month
- Occupancy decreases to average 45.9%
- Daily rates adjust to average $131
Seasonality Insights for Port St. Lucie
- The Airbnb seasonality in Port St. Lucie shows highly seasonal trends requiring careful strategy. While the sections above show seasonal averages, it's also insightful to look at the extremes:
- During the high season, the absolute peak month showcases Port St. Lucie's highest earning potential, with monthly revenues capable of climbing to $3,426, occupancy reaching a high of 67.9%, and ADRs peaking at $189.
- Conversely, the slowest single month of the year, typically falling within the low season, marks the market's lowest point. In this month, revenue might dip to $1,605, occupancy could drop to 42.0%, and ADRs may adjust down to $130.
- Understanding both the seasonal averages and these monthly peaks and troughs in revenue, occupancy, and ADR is crucial for maximizing your Airbnb profit potential in Port St. Lucie.
Seasonal Strategies for Maximizing Profit
- Peak Season: Maximize revenue through premium pricing and potentially longer minimum stays. Ensure high availability.
- Low Season: Offer competitive pricing, special promotions (e.g., extended stay discounts), and flexible cancellation policies. Target off-season travelers like remote workers or budget-conscious guests.
- Shoulder Seasons: Implement dynamic pricing that balances peak and low rates. Target weekend travelers or specific events. Offer slightly more flexible terms than peak season.
- Regularly analyze your own performance against these Port St. Lucie seasonality benchmarks and adjust your pricing and availability strategy accordingly.
Best Areas for Airbnb Investment in Port St. Lucie (2025)
Exploring the top neighborhoods for short-term rentals in Port St. Lucie? This section highlights key areas, outlining why they are attractive for hosts and guests, along with notable local attractions. Consider these locations based on your target guest profile and investment strategy.
| Neighborhood / Area | Why Host Here? (Target Guests & Appeal) | Key Attractions & Landmarks |
|---|---|---|
| Tradition | A master-planned community with a vibrant town center and numerous amenities, making it a favorite for families and tourists looking for a community feel combined with entertainment and shopping. | Tradition Square, The Square at Tradition, Treasure Coast Sports Complex, Tradition Medical Center, St. Lucie West Centennial High School |
| St. Lucie West | Known for its family-friendly atmosphere and proximity to shopping and dining. The area offers easy access to major highways, making it convenient for travelers. | St. Lucie West Golf Club, PGA Village, Little League fields, Various shopping centers, Dining options along St. Lucie West Blvd |
| Downtown Port St. Lucie | Revitalized area with a growing art scene and modern establishments. Attracts tourists looking for cultural experiences and local events. | Port St. Lucie City Center, Riverwalk Boardwalk, Parks and recreation areas, Local restaurants and bars, The Lyric Theatre |
| Southbend Lakes | A quiet, residential neighborhood near the water, appealing to those looking for peaceful stays close to nature and outdoor activities. | Southbend Park, Kayaking and fishing spots, Soundings Trail, Nature trails, Multi-purpose fields |
| Lake Charles | A scenic community with access to lakes and parks. Great for families and nature lovers looking for more spacious accommodations. | Lake Charles Park, Nature trails, Nearby golf courses, Lake access for activities, Community events and gatherings |
| Crosstown Parkway | A fast-developing area ideal for visitors looking for convenience and proximity to main roads, dining, and shopping opportunities. | Crosstown Parkway access, Nearby shopping centers, Restaurants and cafes, Easy access to I-95, Local parks |
| North River Shores | A residential area known for its waterfront properties and scenic views, attractive to those seeking a relaxed and picturesque stay. | Waterfront parks, Marinas, Nature viewing areas, Community events, Proximity to the North Fork of the St. Lucie River |
| West Port | An emerging neighborhood with modern developments and amenities. Attracts both tourists and locals looking for newer accommodations and community events. | West Port Community Park, Shopping centers nearby, Dining options, Access to walking and biking trails, Community gatherings and events |
Understanding Airbnb License Requirements & STR Laws in Port St. Lucie (2025)
While Port St. Lucie, Florida, United States currently shows low STR regulations, specific Airbnb license requirements might still exist or change. Always verify the latest short term rental regulations and Airbnb license requirements directly with local government authorities for Port St. Lucie to ensure full compliance before hosting.
(Source: AirROI data, 2025, finding no licensed listings among those analyzed)
Top Performing Airbnb Properties in Port St. Lucie (2025)
Benchmark your potential! Explore examples of top-performing Airbnb properties in Port St. Luciebased on Trailing Twelve Month (TTM) revenue. Analyze their characteristics, revenue, occupancy rate, and ADR to understand what drives success in this market.
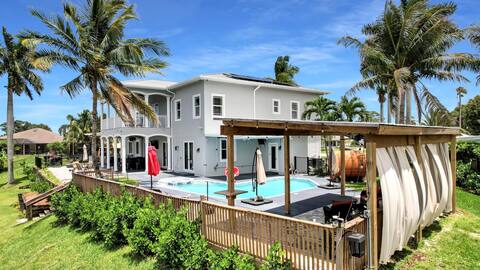
Waterfront Oasis | Luxury Amenities-& Kayaks
Entire Place • 7 bedrooms

Heated Pool/hot tub sleeps 16 Beaches 20 minutes
Entire Place • 6 bedrooms
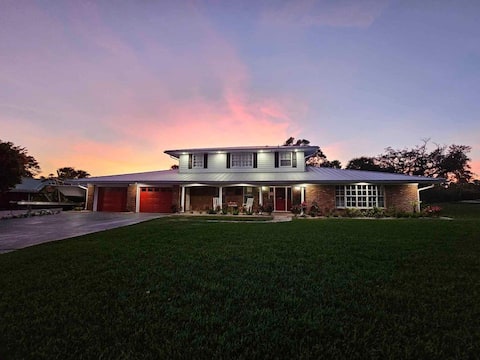
Beautiful Water Front Home
Entire Place • 6 bedrooms
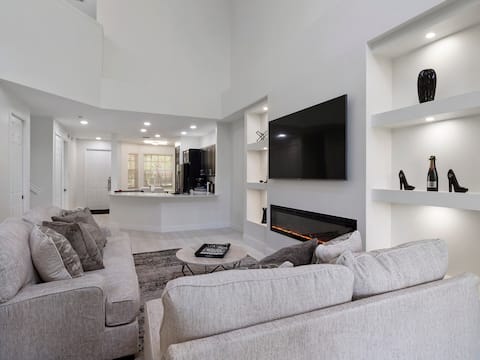
Modern, Light-filled Haven nestled in PGA
Entire Place • 4 bedrooms

Lush Waterfront Home On Bay St. Lucie
Entire Place • 3 bedrooms

PGA Village Best location Castle Pines Pet Allowed
Entire Place • 2 bedrooms
Note: Performance varies based on location, size, amenities, seasonality, and management quality. Data reflects the past 12 months.
Top Performing Airbnb Hosts in Port St. Lucie (2025)
Learn from the best! This table showcases top-performing Airbnb hosts in Port St. Lucie based on the number of properties managed and estimated total revenue over the past year. Analyze their scale and performance metrics.
| Host Name | Properties | Grossing Revenue | Stay Reviews | Avg Rating |
|---|---|---|---|---|
| Rosangeles | 19 | $424,971 | 1039 | 4.82/5.0 |
| Dathan | 18 | $417,663 | 516 | 4.92/5.0 |
| Robert | 1 | $192,640 | 39 | 4.95/5.0 |
| Daniel | 1 | $146,259 | 47 | 4.91/5.0 |
| Anton | 6 | $105,715 | 45 | 4.36/5.0 |
| Jonathan | 1 | $101,159 | 7 | 4.86/5.0 |
| Raquel | 7 | $98,542 | 136 | 3.87/5.0 |
| Pamela | 5 | $95,634 | 89 | 4.71/5.0 |
| Lady | 6 | $94,696 | 602 | 4.82/5.0 |
| Amy | 19 | $80,431 | 25 | 1.26/5.0 |
Analyzing the strategies of top hosts, such as their property selection, pricing, and guest communication, can offer valuable lessons for optimizing your own Airbnb operations in Port St. Lucie.
Dive Deeper: Advanced Port St. Lucie STR Market Data (2025)
Ready to unlock more insights? AirROI provides access to advanced metrics and comprehensive Airbnb data for Port St. Lucie. Explore detailed analytics beyond this report to refine your investment strategy, optimize pricing, and maximize your vacation rental profits.
Explore Advanced MetricsPort St. Lucie Short-Term Rental Market Composition (2025): Property & Room Types
Room Type Distribution
Property Type Distribution
Market Composition Insights for Port St. Lucie
- The Port St. Lucie Airbnb market composition is heavily skewed towards Entire Home/Apt listings, which make up 98.7% of the 158 active rentals. This indicates strong guest preference for privacy and space.
- Looking at the property type distribution in Port St. Lucie, Apartment/Condo properties are the most common (75.9%), reflecting the local real estate landscape.
- Houses represent a significant 22.2% portion, catering likely to families or larger groups.
- Smaller segments like hotel/boutique, outdoor/unique (combined 1.9%) offer potential for unique stay experiences.
Port St. Lucie Airbnb Room Capacity Analysis (2025): Bedroom Distribution
Distribution of Listings by Number of Bedrooms
Room Capacity Insights for Port St. Lucie
- The dominant room capacity in Port St. Lucie is 1 bedroom listings, making up 70.9% of the market. This suggests a strong demand for properties suitable for couples or solo travelers.
- Together, 1 bedroom and 3 bedrooms properties represent 79.1% of the active Airbnb listings in Port St. Lucie, indicating a high concentration in these sizes.
- With over half the market (70.9%) consisting of studios or 1-bedroom units, Port St. Lucie is particularly well-suited for individuals or couples.
Port St. Lucie Vacation Rental Guest Capacity Trends (2025)
Distribution of Listings by Guest Capacity
Guest Capacity Insights for Port St. Lucie
- The most common guest capacity trend in Port St. Lucie vacation rentals is listings accommodating 4 guests (58.9%). This suggests the primary traveler segment is likely small families or groups.
- Properties designed for 4 guests and 2 guests dominate the Port St. Lucie STR market, accounting for 73.5% of listings.
- 21.5% of properties accommodate 6+ guests, serving the market segment for larger families or group travel in Port St. Lucie.
- On average, properties in Port St. Lucie are equipped to host 4.4 guests.
Port St. Lucie Airbnb Booking Patterns (2025): Available vs. Booked Days
Available Days Distribution
Booked Days Distribution
Booking Pattern Insights for Port St. Lucie
- The most common availability pattern in Port St. Lucie falls within the 271-366 days range, representing 36.1% of listings. This suggests many properties have significant open periods on their calendars.
- Approximately 60.8% of listings show high availability (181+ days open annually), indicating potential for increased bookings or specific owner usage patterns.
- For booked days, the 181-270 days range is most frequent in Port St. Lucie (25.3%), reflecting common guest stay durations or potential owner blocking patterns.
- A notable 39.9% of properties secure long booking periods (181+ days booked per year), highlighting successful long-term rental strategies or significant owner usage.
Port St. Lucie Airbnb Minimum Stay Requirements Analysis
Distribution of Listings by Minimum Night Requirement
1 Night
52 listings
34.7% of total
2 Nights
46 listings
30.7% of total
3 Nights
9 listings
6% of total
4-6 Nights
8 listings
5.3% of total
7-29 Nights
8 listings
5.3% of total
30+ Nights
27 listings
18% of total
Key Insights
- The most prevalent minimum stay requirement in Port St. Lucie is 1 Night, adopted by 34.7% of listings. This highlights the market's preference for shorter, flexible bookings.
- A strong majority (65.4%) of the Port St. Lucie Airbnb data shows acceptance of very short stays (1-2 nights), indicating a dynamic, high-turnover market.
- A significant segment (18%) caters to monthly stays (30+ nights) in Port St. Lucie, pointing to opportunities in the extended-stay market.
Recommendations
- Align with the market by considering a 1 Night minimum stay, as 34.7% of Port St. Lucie hosts use this setting.
- Explore offering discounts for stays of 30+ nights to attract the 18% of the market seeking extended stays.
- Adjust minimum nights based on seasonality – potentially shorter during low season and longer during peak demand periods in Port St. Lucie.
Port St. Lucie Airbnb Cancellation Policy Trends Analysis (2025)
Flexible
29 listings
23.8% of total
Moderate
20 listings
16.4% of total
Firm
20 listings
16.4% of total
Strict
53 listings
43.4% of total
Cancellation Policy Insights for Port St. Lucie
- The prevailing Airbnb cancellation policy trend in Port St. Lucie is Strict, used by 43.4% of listings.
- A majority (59.8%) of hosts in Port St. Lucie utilize Firm or Strict policies, indicating a market where hosts prioritize booking security.
Recommendations for Hosts
- Consider adopting a Strict policy to align with the 43.4% market standard in Port St. Lucie.
- With 43.4% using Strict terms, this is a viable option in Port St. Lucie, particularly for high-value properties or during peak demand periods.
- Regularly review your cancellation policy against competitors and market demand shifts in Port St. Lucie.
Port St. Lucie STR Booking Lead Time Analysis (2025)
Average Booking Lead Time by Month
Booking Lead Time Insights for Port St. Lucie
- The overall average booking lead time for vacation rentals in Port St. Lucie is 64 days.
- Guests book furthest in advance for stays during March (average 111 days), likely coinciding with peak travel demand or local events.
- The shortest booking windows occur for stays in August (average 22 days), indicating more last-minute travel plans during this time.
- Seasonally, Winter (78 days avg.) sees the longest lead times, while Summer (36 days avg.) has the shortest, reflecting typical travel planning cycles.
Recommendations for Hosts
- Use the overall average lead time (64 days) as a baseline for your pricing and availability strategy in Port St. Lucie.
- For March stays, consider implementing length-of-stay discounts or slightly higher rates for bookings made less than 111 days out to capitalize on advance planning.
- Target marketing efforts for the Winter season well in advance (at least 78 days) to capture early planners.
- Monitor your own booking lead times against these Port St. Lucie averages to identify opportunities for dynamic pricing adjustments.
Popular & Essential Airbnb Amenities in Port St. Lucie (2025)
Amenity Prevalence
Amenity Insights for Port St. Lucie
- Essential amenities in Port St. Lucie that guests expect include: Wifi, TV, Air conditioning, Washer, Smoke alarm. Lacking these (any) could significantly impact bookings.
- Popular amenities like Heating, Dryer, Free parking on premises are common but not universal. Offering these can provide a competitive edge.
Recommendations for Hosts
- Ensure your listing includes all essential amenities for Port St. Lucie: Wifi, TV, Air conditioning, Washer, Smoke alarm.
- Prioritize adding missing essentials: Washer, Smoke alarm.
- Consider adding popular differentiators like Heating or Dryer to increase appeal.
- Highlight unique or less common amenities you offer (e.g., hot tub, dedicated workspace, EV charger) in your listing description and photos.
- Regularly check competitor amenities in Port St. Lucie to stay competitive.
Port St. Lucie Airbnb Guest Demographics & Profile Analysis (2025)
Guest Profile Summary for Port St. Lucie
- The typical guest profile for Airbnb in Port St. Lucie consists of primarily domestic travelers (94%), often arriving from nearby Riviera Beach, typically belonging to the Post-2000s (Gen Z/Alpha) group (50%), primarily speaking English or Spanish.
- Domestic travelers account for 93.8% of guests.
- Key international markets include United States (93.8%) and Canada (2.3%).
- Top languages spoken are English (70.6%) followed by Spanish (18.9%).
- A significant demographic segment is the Post-2000s (Gen Z/Alpha) group, representing 50% of guests.
Recommendations for Hosts
- Target domestic marketing efforts towards travelers from Riviera Beach and Port St. Lucie.
- Tailor amenities and listing descriptions to appeal to the dominant Post-2000s (Gen Z/Alpha) demographic (e.g., highlight fast WiFi, smart home features, local guides).
- Highlight unique local experiences or amenities relevant to the primary guest profile.
- Consider seasonal promotions aligned with peak travel times for key origin markets.
Nearby Short-Term Rental Market Comparison
How does the Port St. Lucie Airbnb market stack up against its neighbors? Compare key performance metrics like average monthly revenue, ADR, and occupancy rates in surrounding areas to understand the broader regional STR landscape.
| Market | Active Properties | Monthly Revenue | Daily Rate | Avg. Occupancy |
|---|---|---|---|---|
| Sailfish Point | 21 | $21,390 | $1469.53 | 61% |
| Reunion | 11 | $7,012 | $541.35 | 44% |
| Lake Clarke Shores | 28 | $6,493 | $448.22 | 50% |
| Lighthouse Point | 79 | $5,115 | $410.38 | 47% |
| Melbourne Beach | 221 | $4,864 | $415.14 | 42% |
| Plantation | 119 | $4,416 | $370.16 | 44% |
| Ocean Ridge | 13 | $4,148 | $545.96 | 41% |
| North Palm Beach | 62 | $4,095 | $313.64 | 49% |
| Juno Beach | 39 | $3,747 | $336.82 | 38% |
| Indialantic | 61 | $3,711 | $336.82 | 43% |