River Ranch Airbnb Market Analysis 2026: Short Term Rental Data & Vacation Rental Statistics in Florida, United States
Is Airbnb profitable in River Ranch in 2026? Explore comprehensive Airbnb analytics for River Ranch, Florida, United States to uncover income potential. This 2026 STR market report for River Ranch, based on AirROI data from February 2025 to January 2026, reveals key trends in the niche market of 33 active listings.
Whether you're considering an Airbnb investment in River Ranch, optimizing your existing vacation rental, or exploring rental arbitrage opportunities, understanding the River Ranch Airbnb data is crucial. Leveraging the low regulation environment is key to maximizing your short term rental income potential. Let's dive into the specifics.
Key River Ranch Airbnb Performance Metrics Overview
Monthly Airbnb Revenue Variations & Income Potential in River Ranch (2026)
Understanding the monthly revenue variations for Airbnb listings in River Ranch is key to maximizing your short term rental income potential. Seasonality significantly impacts earnings. Our analysis, based on data from the past 12 months, shows that the peak revenue month for STRs in River Ranch is typically March, while September often presents the lowest earnings, highlighting opportunities for strategic pricing adjustments during shoulder and low seasons. Explore the typical Airbnb income in River Ranch across different performance tiers:
- Best-in-class properties (Top 10%) achieve $3,108+ monthly, often utilizing dynamic pricing and superior guest experiences.
- Strong performing properties (Top 25%) earn $2,132 or more, indicating effective management and desirable locations/amenities.
- Typical properties (Median) generate around $1,287 per month, representing the average market performance.
- Entry-level properties (Bottom 25%) see earnings around $765, often with potential for optimization.
Average Monthly Airbnb Earnings Trend in River Ranch
River Ranch Airbnb Occupancy Rate Trends (2026)
Maximize your bookings by understanding the River Ranch STR occupancy trends. Seasonal demand shifts significantly influence how often properties are booked. Typically, Marchsees the highest demand (peak season occupancy), while September experiences the lowest (low season). Effective strategies, like adjusting minimum stays or offering promotions, can boost occupancy during slower periods. Here's how different property tiers perform in River Ranch:
- Best-in-class properties (Top 10%) achieve 45%+ occupancy, indicating high desirability and potentially optimized availability.
- Strong performing properties (Top 25%) maintain 31% or higher occupancy, suggesting good market fit and guest satisfaction.
- Typical properties (Median) have an occupancy rate around 19%.
- Entry-level properties (Bottom 25%) average 11% occupancy, potentially facing higher vacancy.
Average Monthly Occupancy Rate Trend in River Ranch
Average Daily Rate (ADR) Airbnb Trends in River Ranch (2026)
Effective short term rental pricing strategy in River Ranch involves understanding monthly ADR fluctuations. The Average Daily Rate (ADR) for Airbnb in River Ranch typically peaks in January and dips lowest during April. Leveraging Airbnb dynamic pricing tools or strategies based on this seasonality can significantly boost revenue. Here's a look at the typical nightly rates achieved:
- Best-in-class properties (Top 10%) command rates of $319+ per night, often due to premium features or locations.
- Strong performing properties (Top 25%) achieve nightly rates of $264 or more.
- Typical properties (Median) charge around $229 per night.
- Entry-level properties (Bottom 25%) earn around $192 per night.
Average Daily Rate (ADR) Trend by Month in River Ranch
Get Live River Ranch Market Intelligence 👇

Explore Real-time Analytics
Airbnb Seasonality Analysis & Trends in River Ranch (2026)
Peak Season (March, February, January)
- Revenue averages $2,517 per month
- Occupancy rates average 35.6%
- Daily rates average $236
Shoulder Season
- Revenue averages $1,550 per month
- Occupancy maintains around 22.8%
- Daily rates hold near $235
Low Season (May, August, September)
- Revenue drops to average $792 per month
- Occupancy decreases to average 13.4%
- Daily rates adjust to average $233
Seasonality Insights for River Ranch
- The Airbnb seasonality in River Ranch shows highly seasonal trends requiring careful strategy. While the sections above show seasonal averages, it's also insightful to look at the extremes:
- During the high season, the absolute peak month showcases River Ranch's highest earning potential, with monthly revenues capable of climbing to $2,756, occupancy reaching a high of 38.4%, and ADRs peaking at $242.
- Conversely, the slowest single month of the year, typically falling within the low season, marks the market's lowest point. In this month, revenue might dip to $645, occupancy could drop to 11.8%, and ADRs may adjust down to $222.
- Understanding both the seasonal averages and these monthly peaks and troughs in revenue, occupancy, and ADR is crucial for maximizing your Airbnb profit potential in River Ranch.
Seasonal Strategies for Maximizing Profit
- Peak Season: Maximize revenue through premium pricing and potentially longer minimum stays. Ensure high availability.
- Low Season: Offer competitive pricing, special promotions (e.g., extended stay discounts), and flexible cancellation policies. Target off-season travelers like remote workers or budget-conscious guests.
- Shoulder Seasons: Implement dynamic pricing that balances peak and low rates. Target weekend travelers or specific events. Offer slightly more flexible terms than peak season.
- Regularly analyze your own performance against these River Ranch seasonality benchmarks and adjust your pricing and availability strategy accordingly.
Best Areas for Airbnb Investment in River Ranch (2026)
Exploring the top neighborhoods for short-term rentals in River Ranch? This section highlights key areas, outlining why they are attractive for hosts and guests, along with notable local attractions. Consider these locations based on your target guest profile and investment strategy.
| Neighborhood / Area | Why Host Here? (Target Guests & Appeal) | Key Attractions & Landmarks |
|---|---|---|
| River Ranch Resort | A family-friendly resort area offering various outdoor activities such as fishing, horseback riding, and airboat tours. Ideal for vacationers looking for a blend of relaxation and adventure. | River Ranch Rodeo, Gator Spot, Horseback Riding Trails, Fishing Lakes, Airboat Tours, Nature Trails |
| Lake Kissimmee | A peaceful lakeside area great for fishing, boating, and wildlife watching. Attracts visitors looking for a quiet getaway in nature. | Lake Kissimmee State Park, Wildlife Viewing, Fishing, Camping, Boating, Picnic Areas |
| Polk County | A broad area surrounding River Ranch with various recreational opportunities. Attractive for guests looking to explore Central Florida's natural beauty and parks. | Tanger Outlets, Polk Museum of Art, Legoland Florida, Cypress Gardens, Bok Tower Gardens, Chain of Lakes |
| Sebring | Known for its historic downtown and Sebring International Raceway. Popular for motorsports enthusiasts and those looking for a charming small-town atmosphere. | Sebring International Raceway, Downtown Sebring, Highlands Hammock State Park, Lake Jackson, Sebring Village Square |
| Orlando | Just a short drive away, famous for its theme parks and attractions. Ideal for tourists visiting Disney World, Universal Studios, and more. | Walt Disney World, Universal Studios, SeaWorld Orlando, International Drive, Orlando Science Center |
| Lakeland | This growing city features numerous parks and a vibrant downtown. Suitable for those looking for a mix of urban and outdoor experiences. | Lake Mirror, Hollis Garden, Polk Theatre, Common Ground Park, Detroit Tigers Spring Training |
| Fort Meade | A small town known for its history and community events. Offers a unique perspective away from the hustle and bustle of larger tourist areas. | Fort Meade Historical Museum, Downtown Historic District, Old Fort Meade, Parks and Recreation Areas |
| Haines City | A diverse community residential area with access to lakes and recreational opportunities. Good for visitors seeking a more local experience. | Lake Eva Park, Southern Dunes Golf Club, Haines City Lake, Shopping and Dining Options |
Understanding Airbnb License Requirements & STR Laws in River Ranch (2026)
While River Ranch, Florida, United States currently shows low STR regulations, specific Airbnb license requirements might still exist or change. Always verify the latest short term rental regulations and Airbnb license requirements directly with local government authorities for River Ranch to ensure full compliance before hosting.
(Source: AirROI data, 2026, finding no licensed listings among those analyzed)
Top Performing Airbnb Properties in River Ranch (2026)
Benchmark your potential! Explore examples of top-performing Airbnb properties in River Ranchbased on Trailing Twelve Month (TTM) revenue. Analyze their characteristics, revenue, occupancy rate, and ADR to understand what drives success in this market.
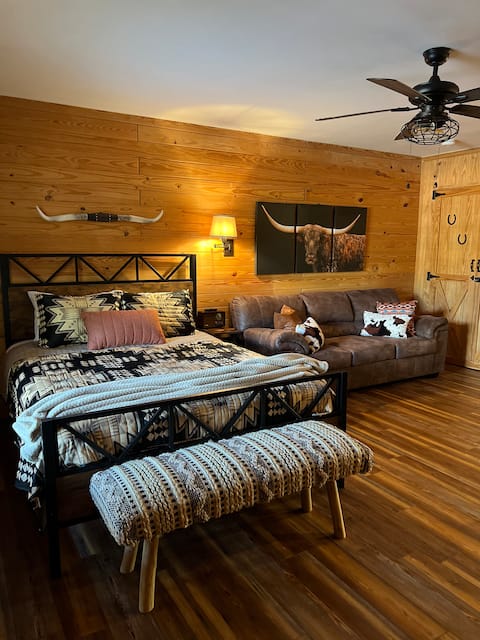
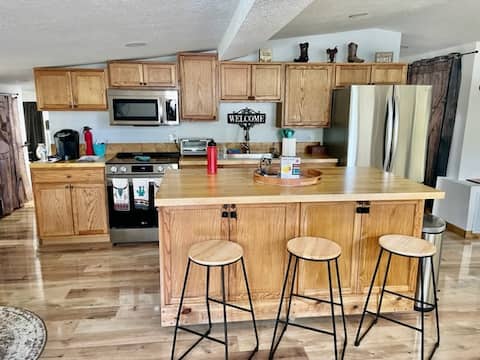
Family Lodge Suite: full kitchen at River Ranch
Entire Place • 2 bedrooms
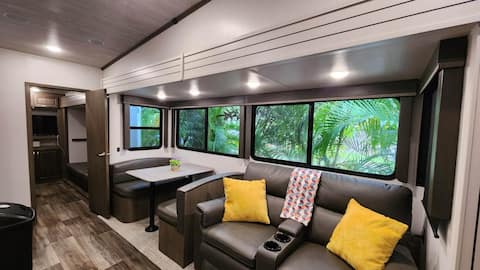
2bed/2ba RV Rental at River Ranch on Lot 251
Entire Place • 2 bedrooms
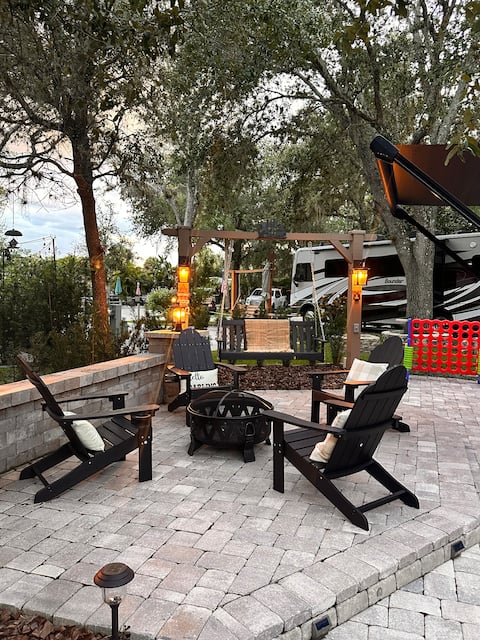
Camper/RV in Lake Wales
Entire Place • 2 bedrooms
2BR/2BA Minnie Pearl Haven: Pool*Rodeo*BBQ*Cozy
Entire Place • 2 bedrooms
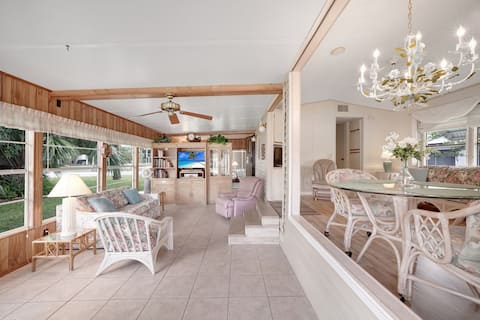
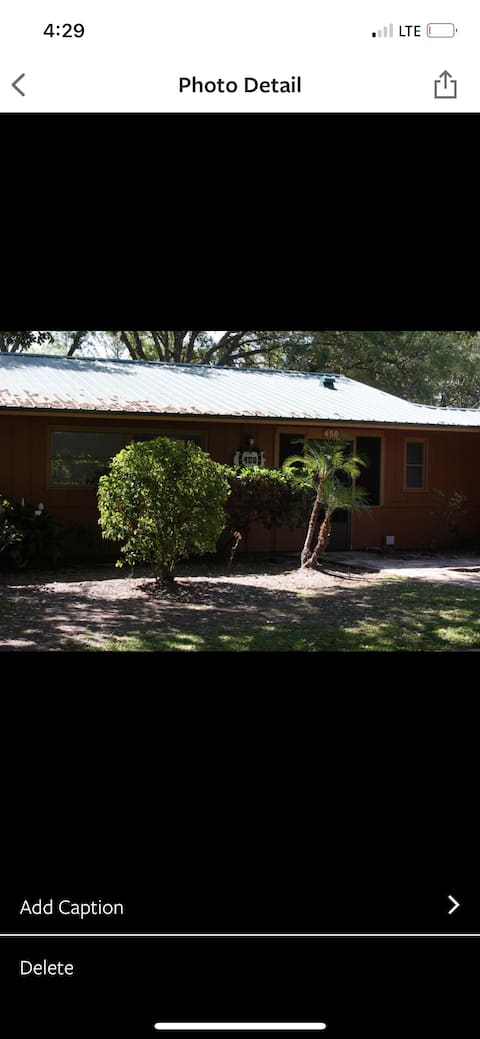
Recently renovated mobile home
Entire Place • 2 bedrooms
Cottage in the Oaks River ranch
Entire Place • 2 bedrooms
Note: Performance varies based on location, size, amenities, seasonality, and management quality. Data reflects the past 12 months.
Top Performing Airbnb Hosts in River Ranch (2026)
Learn from the best! This table showcases top-performing Airbnb hosts in River Ranch based on the number of properties managed and estimated total revenue over the past year. Analyze their scale and performance metrics.
| Host Name | Properties | Grossing Revenue | Stay Reviews | Avg Rating |
|---|---|---|---|---|
| Michelle | 17 | $231,607 | 182 | 4.67/5.0 |
| Wendy | 5 | $66,808 | 40 | 4.63/5.0 |
| Micaela | 1 | $35,487 | 28 | 4.93/5.0 |
| Yanelis | 1 | $33,351 | 23 | 5.00/5.0 |
| Judith | 2 | $31,414 | 88 | 4.96/5.0 |
| Scott | 1 | $29,775 | 8 | 5.00/5.0 |
| Kenneth Allen | 1 | $26,591 | 42 | 4.88/5.0 |
| Janet | 2 | $24,032 | 29 | 4.95/5.0 |
| Michelle | 1 | $23,301 | 68 | 4.71/5.0 |
| Rafaela | 1 | $17,160 | 26 | 5.00/5.0 |
Analyzing the strategies of top hosts, such as their property selection, pricing, and guest communication, can offer valuable lessons for optimizing your own Airbnb operations in River Ranch.
Dive Deeper: Advanced River Ranch STR Market Data (2026)
Ready to unlock more insights? AirROI provides access to advanced metrics and comprehensive Airbnb data for River Ranch. Explore detailed analytics beyond this report to refine your investment strategy, optimize pricing, and maximize your vacation rental profits.
Explore Advanced MetricsRiver Ranch Short-Term Rental Market Composition (2026): Property & Room Types
Room Type Distribution
Property Type Distribution
Market Composition Insights for River Ranch
- The River Ranch Airbnb market composition is heavily skewed towards Entire Home/Apt listings, which make up 100% of the 33 active rentals. This indicates strong guest preference for privacy and space.
- Looking at the property type distribution in River Ranch, Apartment/Condo properties are the most common (60.6%), reflecting the local real estate landscape.
- Houses represent a significant 30.3% portion, catering likely to families or larger groups.
River Ranch Airbnb Room Capacity Analysis (2026): Bedroom Distribution
Distribution of Listings by Number of Bedrooms
Room Capacity Insights for River Ranch
- The dominant room capacity in River Ranch is 1 bedroom listings, making up 54.5% of the market. This suggests a strong demand for properties suitable for couples or solo travelers.
- Together, 1 bedroom and 2 bedrooms properties represent 93.9% of the active Airbnb listings in River Ranch, indicating a high concentration in these sizes.
- With over half the market (54.5%) consisting of studios or 1-bedroom units, River Ranch is particularly well-suited for individuals or couples.
River Ranch Vacation Rental Guest Capacity Trends (2026)
Distribution of Listings by Guest Capacity
Guest Capacity Insights for River Ranch
- The most common guest capacity trend in River Ranch vacation rentals is listings accommodating 4 guests (54.5%). This suggests the primary traveler segment is likely small families or groups.
- Properties designed for 4 guests and 6 guests dominate the River Ranch STR market, accounting for 87.8% of listings.
- 36.3% of properties accommodate 6+ guests, serving the market segment for larger families or group travel in River Ranch.
- On average, properties in River Ranch are equipped to host 4.8 guests.
River Ranch Airbnb Booking Patterns (2026): Available vs. Booked Days
Available Days Distribution
Booked Days Distribution
Booking Pattern Insights for River Ranch
- The most common availability pattern in River Ranch falls within the 271-366 days range, representing 81.8% of listings. This suggests many properties have significant open periods on their calendars.
- Approximately 93.9% of listings show high availability (181+ days open annually), indicating potential for increased bookings or specific owner usage patterns.
- For booked days, the 31-90 days range is most frequent in River Ranch (66.7%), reflecting common guest stay durations or potential owner blocking patterns.
- A notable 6.1% of properties secure long booking periods (181+ days booked per year), highlighting successful long-term rental strategies or significant owner usage.
River Ranch Airbnb Minimum Stay Requirements Analysis
Distribution of Listings by Minimum Night Requirement
1 Night
6 listings
18.2% of total
2 Nights
22 listings
66.7% of total
30+ Nights
5 listings
15.2% of total
Key Insights
- The most prevalent minimum stay requirement in River Ranch is 2 Nights, adopted by 66.7% of listings. This highlights the market's preference for shorter, flexible bookings.
- A strong majority (84.9%) of the River Ranch Airbnb data shows acceptance of very short stays (1-2 nights), indicating a dynamic, high-turnover market.
- A significant segment (15.2%) caters to monthly stays (30+ nights) in River Ranch, pointing to opportunities in the extended-stay market.
Recommendations
- Align with the market by considering a 2 Nights minimum stay, as 66.7% of River Ranch hosts use this setting.
- If feasible, allowing 1-night stays, especially midweek or during low season, could capture last-minute bookings, as only 18.2% currently do.
- A 2-night minimum appears standard (66.7%). Consider this for weekends or peak periods.
- Explore offering discounts for stays of 30+ nights to attract the 15.2% of the market seeking extended stays.
- Adjust minimum nights based on seasonality – potentially shorter during low season and longer during peak demand periods in River Ranch.
River Ranch Airbnb Cancellation Policy Trends Analysis (2026)
Super Strict 60 Days
1 listings
3% of total
Moderate
7 listings
21.2% of total
Firm
25 listings
75.8% of total
Cancellation Policy Insights for River Ranch
- The prevailing Airbnb cancellation policy trend in River Ranch is Firm, used by 75.8% of listings.
- A majority (75.8%) of hosts in River Ranch utilize Firm or Strict policies, indicating a market where hosts prioritize booking security.
Recommendations for Hosts
- Consider adopting a Firm policy to align with the 75.8% market standard in River Ranch.
- Regularly review your cancellation policy against competitors and market demand shifts in River Ranch.
River Ranch STR Booking Lead Time Analysis (2026)
Average Booking Lead Time by Month
Booking Lead Time Insights for River Ranch
- The overall average booking lead time for vacation rentals in River Ranch is 51 days.
- Guests book furthest in advance for stays during January (average 109 days), likely coinciding with peak travel demand or local events.
- The shortest booking windows occur for stays in June (average 24 days), indicating more last-minute travel plans during this time.
- Seasonally, Winter (71 days avg.) sees the longest lead times, while Summer (29 days avg.) has the shortest, reflecting typical travel planning cycles.
Recommendations for Hosts
- Use the overall average lead time (51 days) as a baseline for your pricing and availability strategy in River Ranch.
- For January stays, consider implementing length-of-stay discounts or slightly higher rates for bookings made less than 109 days out to capitalize on advance planning.
- Target marketing efforts for the Winter season well in advance (at least 71 days) to capture early planners.
- Monitor your own booking lead times against these River Ranch averages to identify opportunities for dynamic pricing adjustments.
Popular & Essential Airbnb Amenities in River Ranch (2026)
Amenity Prevalence
Amenity Insights for River Ranch
- Essential amenities in River Ranch that guests expect include: Air conditioning. Lacking these (this) could significantly impact bookings.
- Popular amenities like TV, Fire extinguisher, Kitchen are common but not universal. Offering these can provide a competitive edge.
- A pool is a highly desired but not standard amenity, making it a key feature for attracting guests seeking leisure in River Ranch.
Recommendations for Hosts
- Ensure your listing includes all essential amenities for River Ranch: Air conditioning.
- Prioritize adding missing essentials: Air conditioning.
- Consider adding popular differentiators like TV or Fire extinguisher to increase appeal.
- Highlight unique or less common amenities you offer (e.g., hot tub, dedicated workspace, EV charger) in your listing description and photos.
- Regularly check competitor amenities in River Ranch to stay competitive.
River Ranch Airbnb Guest Demographics & Profile Analysis (2026)
Guest Profile Summary for River Ranch
- The typical guest profile for Airbnb in River Ranch consists of primarily domestic travelers (97%), often arriving from nearby Miami, typically belonging to the Post-2000s (Gen Z/Alpha) group (50%), primarily speaking English or Spanish.
- Domestic travelers account for 97.1% of guests.
- Key international markets include United States (97.1%) and Canada (1%).
- Top languages spoken are English (56.6%) followed by Spanish (35.5%).
- A significant demographic segment is the Post-2000s (Gen Z/Alpha) group, representing 50% of guests.
Recommendations for Hosts
- Target domestic marketing efforts towards travelers from Miami and Tampa.
- Tailor amenities and listing descriptions to appeal to the dominant Post-2000s (Gen Z/Alpha) demographic (e.g., highlight fast WiFi, smart home features, local guides).
- Highlight unique local experiences or amenities relevant to the primary guest profile.
- Consider seasonal promotions aligned with peak travel times for key origin markets.
Nearby Short-Term Rental Market Comparison
How does the River Ranch Airbnb market stack up against its neighbors? Compare key performance metrics like average monthly revenue, ADR, and occupancy rates in surrounding areas to understand the broader regional STR landscape.
| Market | Active Properties | Monthly Revenue | Daily Rate | Avg. Occupancy |
|---|---|---|---|---|
| Sailfish Point | 19 | $16,709 | $1587.63 | 48% |
| Anna Maria island | 587 | $7,996 | $823.96 | 41% |
| Lake Clarke Shores | 26 | $6,710 | $516.52 | 46% |
| Anna Maria | 56 | $6,434 | $692.96 | 52% |
| Reunion | 12 | $6,321 | $580.45 | 44% |
| Lighthouse Point | 75 | $6,205 | $472.94 | 51% |
| Boca Grande | 31 | $6,128 | $787.07 | 37% |
| Indian Rocks Beach | 842 | $5,560 | $419.63 | 49% |
| Captiva | 291 | $5,443 | $667.40 | 36% |
| Melbourne Beach | 275 | $5,384 | $488.83 | 43% |