Silver Springs Airbnb Market Analysis 2026: Short Term Rental Data & Vacation Rental Statistics in Florida, United States
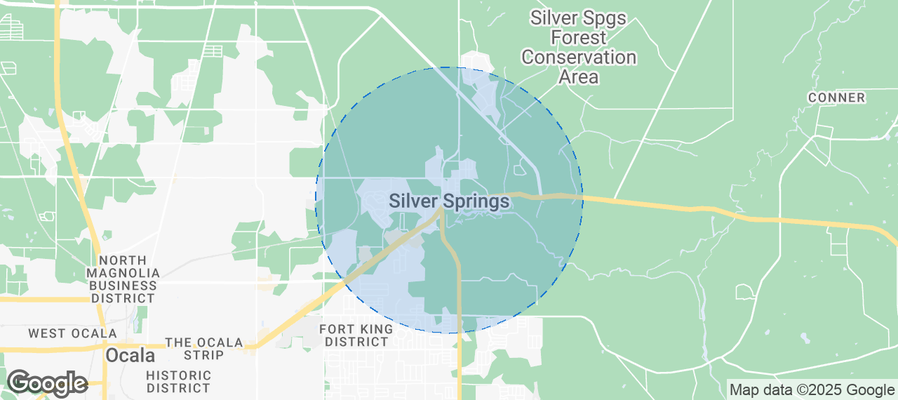
Is Airbnb profitable in Silver Springs in 2026? Explore comprehensive Airbnb analytics for Silver Springs, Florida, United States to uncover income potential. This 2026 STR market report for Silver Springs, based on AirROI data from February 2025 to January 2026, reveals key trends in the niche market of 20 active listings.
Whether you're considering an Airbnb investment in Silver Springs, optimizing your existing vacation rental, or exploring rental arbitrage opportunities, understanding the Silver Springs Airbnb data is crucial. Leveraging the low regulation environment is key to maximizing your short term rental income potential. Let's dive into the specifics.
Key Silver Springs Airbnb Performance Metrics Overview
Monthly Airbnb Revenue Variations & Income Potential in Silver Springs (2026)
Understanding the monthly revenue variations for Airbnb listings in Silver Springs is key to maximizing your short term rental income potential. Seasonality significantly impacts earnings. Our analysis, based on data from the past 12 months, shows that the peak revenue month for STRs in Silver Springs is typically November, while October often presents the lowest earnings, highlighting opportunities for strategic pricing adjustments during shoulder and low seasons. Explore the typical Airbnb income in Silver Springs across different performance tiers:
- Best-in-class properties (Top 10%) achieve $5,458+ monthly, often utilizing dynamic pricing and superior guest experiences.
- Strong performing properties (Top 25%) earn $3,585 or more, indicating effective management and desirable locations/amenities.
- Typical properties (Median) generate around $1,856 per month, representing the average market performance.
- Entry-level properties (Bottom 25%) see earnings around $1,080, often with potential for optimization.
Average Monthly Airbnb Earnings Trend in Silver Springs
Silver Springs Airbnb Occupancy Rate Trends (2026)
Maximize your bookings by understanding the Silver Springs STR occupancy trends. Seasonal demand shifts significantly influence how often properties are booked. Typically, Februarysees the highest demand (peak season occupancy), while September experiences the lowest (low season). Effective strategies, like adjusting minimum stays or offering promotions, can boost occupancy during slower periods. Here's how different property tiers perform in Silver Springs:
- Best-in-class properties (Top 10%) achieve 70%+ occupancy, indicating high desirability and potentially optimized availability.
- Strong performing properties (Top 25%) maintain 59% or higher occupancy, suggesting good market fit and guest satisfaction.
- Typical properties (Median) have an occupancy rate around 41%.
- Entry-level properties (Bottom 25%) average 21% occupancy, potentially facing higher vacancy.
Average Monthly Occupancy Rate Trend in Silver Springs
Average Daily Rate (ADR) Airbnb Trends in Silver Springs (2026)
Effective short term rental pricing strategy in Silver Springs involves understanding monthly ADR fluctuations. The Average Daily Rate (ADR) for Airbnb in Silver Springs typically peaks in September and dips lowest during April. Leveraging Airbnb dynamic pricing tools or strategies based on this seasonality can significantly boost revenue. Here's a look at the typical nightly rates achieved:
- Best-in-class properties (Top 10%) command rates of $285+ per night, often due to premium features or locations.
- Strong performing properties (Top 25%) achieve nightly rates of $199 or more.
- Typical properties (Median) charge around $137 per night.
- Entry-level properties (Bottom 25%) earn around $125 per night.
Average Daily Rate (ADR) Trend by Month in Silver Springs
Get Live Silver Springs Market Intelligence 👇
Explore Real-time Analytics
Airbnb Seasonality Analysis & Trends in Silver Springs (2026)
Peak Season (November, April, March)
- Revenue averages $4,358 per month
- Occupancy rates average 48.3%
- Daily rates average $249
Shoulder Season
- Revenue averages $2,731 per month
- Occupancy maintains around 43.4%
- Daily rates hold near $252
Low Season (May, September, October)
- Revenue drops to average $2,000 per month
- Occupancy decreases to average 34.4%
- Daily rates adjust to average $277
Seasonality Insights for Silver Springs
- The Airbnb seasonality in Silver Springs shows highly seasonal trends requiring careful strategy. While the sections above show seasonal averages, it's also insightful to look at the extremes:
- During the high season, the absolute peak month showcases Silver Springs's highest earning potential, with monthly revenues capable of climbing to $5,837, occupancy reaching a high of 69.3%, and ADRs peaking at $313.
- Conversely, the slowest single month of the year, typically falling within the low season, marks the market's lowest point. In this month, revenue might dip to $1,914, occupancy could drop to 28.3%, and ADRs may adjust down to $233.
- Understanding both the seasonal averages and these monthly peaks and troughs in revenue, occupancy, and ADR is crucial for maximizing your Airbnb profit potential in Silver Springs.
Seasonal Strategies for Maximizing Profit
- Peak Season: Maximize revenue through premium pricing and potentially longer minimum stays. Ensure high availability.
- Low Season: Offer competitive pricing, special promotions (e.g., extended stay discounts), and flexible cancellation policies. Target off-season travelers like remote workers or budget-conscious guests.
- Shoulder Seasons: Implement dynamic pricing that balances peak and low rates. Target weekend travelers or specific events. Offer slightly more flexible terms than peak season.
- Regularly analyze your own performance against these Silver Springs seasonality benchmarks and adjust your pricing and availability strategy accordingly.
Best Areas for Airbnb Investment in Silver Springs (2026)
Exploring the top neighborhoods for short-term rentals in Silver Springs? This section highlights key areas, outlining why they are attractive for hosts and guests, along with notable local attractions. Consider these locations based on your target guest profile and investment strategy.
| Neighborhood / Area | Why Host Here? (Target Guests & Appeal) | Key Attractions & Landmarks |
|---|---|---|
| Silver Springs State Park | A beautiful natural area known for its crystal-clear springs and diverse wildlife. Popular with eco-tourists and families looking for outdoor activities and nature experiences. | Silver Springs River, Glass Bottom Boat Tours, Wildlife Park, Kayaking and Canoeing, Scenic Trails |
| Downtown Ocala | The heart of the city with a charming downtown area featuring a mix of history, dining, and entertainment. An attractive location for those who want to explore the local culture and events. | Historic Marion Theatre, Tuscawilla Park, Ocala Downtown Market, Shopping and Dining Options, Art Galleries |
| Lake Weir | A serene lake area popular for water sports and relaxation. Ideal for vacationers looking for a peaceful retreat close to water activities. | Lake Weir, Waterfront Parks, Boating and Fishing, Swimming and Picnicking, Scenic Views |
| Silver River State Park | An expansive state park that offers a mix of history and nature, including hiking trails and historic sites. Great for those who appreciate outdoor adventures and history. | Silver River, Historic Mill, Bike Trails, Camping Areas, Wildlife Viewing |
| The Villages | A large retirement community known for its leisure activities and golf courses. Attracts older adults looking for a social atmosphere with plenty of amenities. | Golf Courses, Town Squares, The Villages Daily Sun, Recreation Centers, Live Entertainment |
| Fort King Historic Landmark | A historic site that offers insight into early Florida history. Attracts history buffs and educational visitors interested in the area’s past. | Fort King, Historic Exhibits, Walking Trails, Picnic Areas, Community Events |
| Marion Oaks | A residential community that offers a mix of suburban tranquility and access to local amenities. Ideal for families and long-term rentals. | Local Parks, Community Centers, Shopping Proximity, Family-Friendly Environment, Quiet Neighborhoods |
| Ocala National Forest | A vast national forest perfect for outdoor enthusiasts. Offers camping, hiking, and nature exploration, attracting those who love the great outdoors. | Hiking Trails, Lake Dorr, Wildlife Watching, Camping Sites, Natural Springs |
Understanding Airbnb License Requirements & STR Laws in Silver Springs (2026)
While Silver Springs, Florida, United States currently shows low STR regulations, specific Airbnb license requirements might still exist or change. Always verify the latest short term rental regulations and Airbnb license requirements directly with local government authorities for Silver Springs to ensure full compliance before hosting.
(Source: AirROI data, 2026, finding no licensed listings among those analyzed)
Top Performing Airbnb Properties in Silver Springs (2026)
Benchmark your potential! Explore examples of top-performing Airbnb properties in Silver Springsbased on Trailing Twelve Month (TTM) revenue. Analyze their characteristics, revenue, occupancy rate, and ADR to understand what drives success in this market.
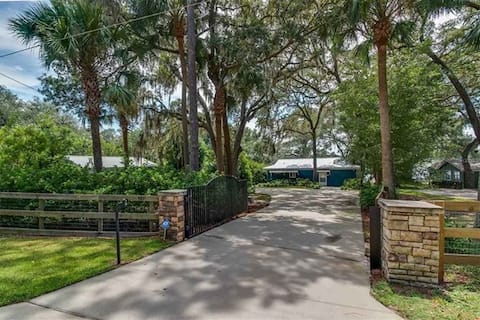
Silver Springs, 67 Acres/3 Houses/18 Beds/Weddings
Entire Place • 7 bedrooms
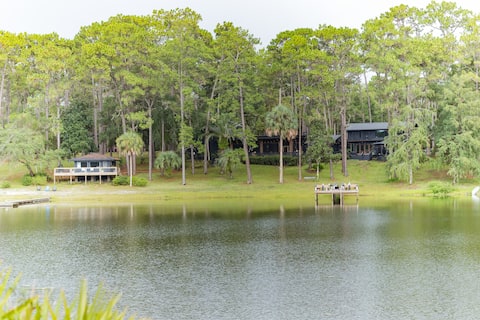
Lakefront Home in Silver Springs, FL
Entire Place • 3 bedrooms
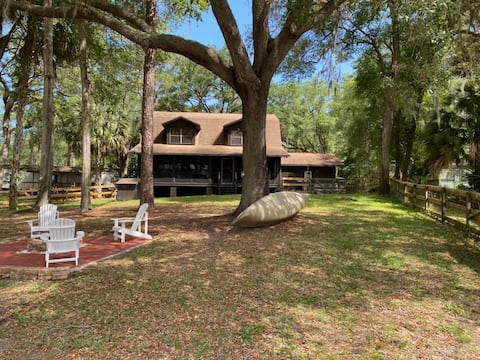
Lakefront Cabin in Ocala Forest, Silver Springs
Entire Place • 3 bedrooms
Lakeside Getaway with kayaks!
Entire Place • 2 bedrooms
The Silver Springs Lakefront Cottage - with Canoe
Entire Place • 3 bedrooms

3 Mi to Silver Springs State Park: Cozy Getaway!
Entire Place • 2 bedrooms
Note: Performance varies based on location, size, amenities, seasonality, and management quality. Data reflects the past 12 months.
Top Performing Airbnb Hosts in Silver Springs (2026)
Learn from the best! This table showcases top-performing Airbnb hosts in Silver Springs based on the number of properties managed and estimated total revenue over the past year. Analyze their scale and performance metrics.
| Host Name | Properties | Grossing Revenue | Stay Reviews | Avg Rating |
|---|---|---|---|---|
| Barbara | 1 | $86,828 | 15 | 5.00/5.0 |
| Jaime | 1 | $77,035 | 63 | 4.98/5.0 |
| Nicole | 2 | $57,644 | 156 | 4.97/5.0 |
| Teddy | 1 | $47,192 | 85 | 4.94/5.0 |
| Evolve | 2 | $44,994 | 107 | 4.78/5.0 |
| Darlene | 1 | $34,357 | 34 | 4.94/5.0 |
| Ingrid | 2 | $27,219 | 124 | 4.76/5.0 |
| Melissa | 1 | $23,620 | 192 | 4.95/5.0 |
| Tiania | 1 | $21,375 | 10 | 4.90/5.0 |
| Tina | 1 | $12,542 | 22 | 5.00/5.0 |
Analyzing the strategies of top hosts, such as their property selection, pricing, and guest communication, can offer valuable lessons for optimizing your own Airbnb operations in Silver Springs.
Dive Deeper: Advanced Silver Springs STR Market Data (2026)
Ready to unlock more insights? AirROI provides access to advanced metrics and comprehensive Airbnb data for Silver Springs. Explore detailed analytics beyond this report to refine your investment strategy, optimize pricing, and maximize your vacation rental profits.
Explore Advanced MetricsSilver Springs Short-Term Rental Market Composition (2026): Property & Room Types
Room Type Distribution
Property Type Distribution
Market Composition Insights for Silver Springs
- The Silver Springs Airbnb market composition is heavily skewed towards Entire Home/Apt listings, which make up 100% of the 20 active rentals. This indicates strong guest preference for privacy and space.
- Looking at the property type distribution in Silver Springs, House properties are the most common (60%), reflecting the local real estate landscape.
- Houses represent a significant 60% portion, catering likely to families or larger groups.
Silver Springs Airbnb Room Capacity Analysis (2026): Bedroom Distribution
Distribution of Listings by Number of Bedrooms
Room Capacity Insights for Silver Springs
- The dominant room capacity in Silver Springs is 2 bedrooms listings, making up 65% of the market. This suggests a strong demand for properties suitable for couples or solo travelers.
- Together, 2 bedrooms and 3 bedrooms properties represent 85.0% of the active Airbnb listings in Silver Springs, indicating a high concentration in these sizes.
- A significant 35.0% of listings offer 3+ bedrooms, catering to larger groups and families seeking more space in Silver Springs.
Silver Springs Vacation Rental Guest Capacity Trends (2026)
Distribution of Listings by Guest Capacity
Guest Capacity Insights for Silver Springs
- The most common guest capacity trend in Silver Springs vacation rentals is listings accommodating 4 guests (35%). This suggests the primary traveler segment is likely small families or groups.
- Properties designed for 4 guests and 6 guests dominate the Silver Springs STR market, accounting for 65.0% of listings.
- 60.0% of properties accommodate 6+ guests, serving the market segment for larger families or group travel in Silver Springs.
- On average, properties in Silver Springs are equipped to host 5.8 guests.
Silver Springs Airbnb Booking Patterns (2026): Available vs. Booked Days
Available Days Distribution
Booked Days Distribution
Booking Pattern Insights for Silver Springs
- The most common availability pattern in Silver Springs falls within the 271-366 days range, representing 45% of listings. This suggests many properties have significant open periods on their calendars.
- Approximately 85.0% of listings show high availability (181+ days open annually), indicating potential for increased bookings or specific owner usage patterns.
- For booked days, the 91-180 days range is most frequent in Silver Springs (40%), reflecting common guest stay durations or potential owner blocking patterns.
- A notable 15.0% of properties secure long booking periods (181+ days booked per year), highlighting successful long-term rental strategies or significant owner usage.
Silver Springs Airbnb Minimum Stay Requirements Analysis
Distribution of Listings by Minimum Night Requirement
1 Night
4 listings
20% of total
2 Nights
8 listings
40% of total
3 Nights
4 listings
20% of total
30+ Nights
4 listings
20% of total
Key Insights
- The most prevalent minimum stay requirement in Silver Springs is 2 Nights, adopted by 40% of listings. This highlights the market's preference for shorter, flexible bookings.
- A significant segment (20%) caters to monthly stays (30+ nights) in Silver Springs, pointing to opportunities in the extended-stay market.
Recommendations
- Align with the market by considering a 2 Nights minimum stay, as 40% of Silver Springs hosts use this setting.
- If feasible, allowing 1-night stays, especially midweek or during low season, could capture last-minute bookings, as only 20% currently do.
- Explore offering discounts for stays of 30+ nights to attract the 20% of the market seeking extended stays.
- Adjust minimum nights based on seasonality – potentially shorter during low season and longer during peak demand periods in Silver Springs.
Silver Springs Airbnb Cancellation Policy Trends Analysis (2026)
Limited
1 listings
5% of total
Flexible
4 listings
20% of total
Moderate
3 listings
15% of total
Firm
7 listings
35% of total
Strict
5 listings
25% of total
Cancellation Policy Insights for Silver Springs
- The prevailing Airbnb cancellation policy trend in Silver Springs is Firm, used by 35% of listings.
- A majority (60.0%) of hosts in Silver Springs utilize Firm or Strict policies, indicating a market where hosts prioritize booking security.
Recommendations for Hosts
- Consider adopting a Firm policy to align with the 35% market standard in Silver Springs.
- Regularly review your cancellation policy against competitors and market demand shifts in Silver Springs.
Silver Springs STR Booking Lead Time Analysis (2026)
Average Booking Lead Time by Month
Booking Lead Time Insights for Silver Springs
- The overall average booking lead time for vacation rentals in Silver Springs is 40 days.
- Guests book furthest in advance for stays during November (average 90 days), likely coinciding with peak travel demand or local events.
- The shortest booking windows occur for stays in January (average 20 days), indicating more last-minute travel plans during this time.
- Seasonally, Fall (55 days avg.) sees the longest lead times, while Winter (35 days avg.) has the shortest, reflecting typical travel planning cycles.
Recommendations for Hosts
- Use the overall average lead time (40 days) as a baseline for your pricing and availability strategy in Silver Springs.
- For November stays, consider implementing length-of-stay discounts or slightly higher rates for bookings made less than 90 days out to capitalize on advance planning.
- Target marketing efforts for the Fall season well in advance (at least 55 days) to capture early planners.
- Monitor your own booking lead times against these Silver Springs averages to identify opportunities for dynamic pricing adjustments.
Popular & Essential Airbnb Amenities in Silver Springs (2026)
Amenity Prevalence
Amenity Insights for Silver Springs
- Essential amenities in Silver Springs that guests expect include: Air conditioning, Free parking on premises, Bed linens, TV, Smoke alarm, Coffee maker, Microwave, Dishes and silverware, Refrigerator, Wifi. Lacking these (any) could significantly impact bookings.
Recommendations for Hosts
- Ensure your listing includes all essential amenities for Silver Springs: Air conditioning, Free parking on premises, Bed linens, TV, Smoke alarm, Coffee maker, Microwave, Dishes and silverware, Refrigerator, Wifi.
- Prioritize adding missing essentials: Smoke alarm, Coffee maker, Microwave, Dishes and silverware, Refrigerator, Wifi.
- Highlight unique or less common amenities you offer (e.g., hot tub, dedicated workspace, EV charger) in your listing description and photos.
- Regularly check competitor amenities in Silver Springs to stay competitive.
Silver Springs Airbnb Guest Demographics & Profile Analysis (2026)
Guest Profile Summary for Silver Springs
- The typical guest profile for Airbnb in Silver Springs consists of primarily domestic travelers (95%), often arriving from nearby Fort Lauderdale, typically belonging to the Post-2000s (Gen Z/Alpha) group (50%), primarily speaking English or Spanish.
- Domestic travelers account for 95.4% of guests.
- Key international markets include United States (95.4%) and Ethiopia (0.8%).
- Top languages spoken are English (65.2%) followed by Spanish (15.2%).
- A significant demographic segment is the Post-2000s (Gen Z/Alpha) group, representing 50% of guests.
Recommendations for Hosts
- Target domestic marketing efforts towards travelers from Fort Lauderdale and Jacksonville.
- Tailor amenities and listing descriptions to appeal to the dominant Post-2000s (Gen Z/Alpha) demographic (e.g., highlight fast WiFi, smart home features, local guides).
- Highlight unique local experiences or amenities relevant to the primary guest profile.
- Consider seasonal promotions aligned with peak travel times for key origin markets.
Nearby Short-Term Rental Market Comparison
How does the Silver Springs Airbnb market stack up against its neighbors? Compare key performance metrics like average monthly revenue, ADR, and occupancy rates in surrounding areas to understand the broader regional STR landscape.
| Market | Active Properties | Monthly Revenue | Daily Rate | Avg. Occupancy |
|---|---|---|---|---|
| St. Johns County | 12 | $6,964 | $592.43 | 47% |
| Reunion | 12 | $6,321 | $580.45 | 44% |
| Ponte Vedra Beach | 224 | $5,720 | $574.75 | 43% |
| Vilano Beach | 173 | $5,571 | $442.95 | 45% |
| Melbourne Beach | 275 | $5,384 | $488.83 | 43% |
| Thonotosassa | 17 | $4,309 | $347.75 | 50% |
| Jacksonville Beach | 763 | $4,123 | $328.32 | 49% |
| Campbell | 22 | $4,011 | $343.05 | 51% |
| Indian Harbour Beach | 131 | $3,895 | $289.71 | 50% |
| Cocoa Beach | 983 | $3,883 | $307.17 | 48% |