South Miami Airbnb Market Analysis 2026: Short Term Rental Data & Vacation Rental Statistics in Florida, United States
Is Airbnb profitable in South Miami in 2026? Explore comprehensive Airbnb analytics for South Miami, Florida, United States to uncover income potential. This 2026 STR market report for South Miami, based on AirROI data from February 2025 to January 2026, reveals key trends in the niche market of 87 active listings.
Whether you're considering an Airbnb investment in South Miami, optimizing your existing vacation rental, or exploring rental arbitrage opportunities, understanding the South Miami Airbnb data is crucial. Understanding the local regulations is key to maximizing your short term rental income potential. Let's dive into the specifics.
Key South Miami Airbnb Performance Metrics Overview
Monthly Airbnb Revenue Variations & Income Potential in South Miami (2026)
Understanding the monthly revenue variations for Airbnb listings in South Miami is key to maximizing your short term rental income potential. Seasonality significantly impacts earnings. Our analysis, based on data from the past 12 months, shows that the peak revenue month for STRs in South Miami is typically January, while September often presents the lowest earnings, highlighting opportunities for strategic pricing adjustments during shoulder and low seasons. Explore the typical Airbnb income in South Miami across different performance tiers:
- Best-in-class properties (Top 10%) achieve $7,118+ monthly, often utilizing dynamic pricing and superior guest experiences.
- Strong performing properties (Top 25%) earn $3,855 or more, indicating effective management and desirable locations/amenities.
- Typical properties (Median) generate around $2,153 per month, representing the average market performance.
- Entry-level properties (Bottom 25%) see earnings around $1,208, often with potential for optimization.
Average Monthly Airbnb Earnings Trend in South Miami
South Miami Airbnb Occupancy Rate Trends (2026)
Maximize your bookings by understanding the South Miami STR occupancy trends. Seasonal demand shifts significantly influence how often properties are booked. Typically, Februarysees the highest demand (peak season occupancy), while June experiences the lowest (low season). Effective strategies, like adjusting minimum stays or offering promotions, can boost occupancy during slower periods. Here's how different property tiers perform in South Miami:
- Best-in-class properties (Top 10%) achieve 84%+ occupancy, indicating high desirability and potentially optimized availability.
- Strong performing properties (Top 25%) maintain 67% or higher occupancy, suggesting good market fit and guest satisfaction.
- Typical properties (Median) have an occupancy rate around 44%.
- Entry-level properties (Bottom 25%) average 24% occupancy, potentially facing higher vacancy.
Average Monthly Occupancy Rate Trend in South Miami
Average Daily Rate (ADR) Airbnb Trends in South Miami (2026)
Effective short term rental pricing strategy in South Miami involves understanding monthly ADR fluctuations. The Average Daily Rate (ADR) for Airbnb in South Miami typically peaks in December and dips lowest during August. Leveraging Airbnb dynamic pricing tools or strategies based on this seasonality can significantly boost revenue. Here's a look at the typical nightly rates achieved:
- Best-in-class properties (Top 10%) command rates of $669+ per night, often due to premium features or locations.
- Strong performing properties (Top 25%) achieve nightly rates of $236 or more.
- Typical properties (Median) charge around $151 per night.
- Entry-level properties (Bottom 25%) earn around $111 per night.
Average Daily Rate (ADR) Trend by Month in South Miami
Get Live South Miami Market Intelligence 👇

Explore Real-time Analytics
Airbnb Seasonality Analysis & Trends in South Miami (2026)
Peak Season (January, February, March)
- Revenue averages $4,776 per month
- Occupancy rates average 52.7%
- Daily rates average $328
Shoulder Season
- Revenue averages $3,856 per month
- Occupancy maintains around 46.5%
- Daily rates hold near $315
Low Season (August, September, October)
- Revenue drops to average $2,537 per month
- Occupancy decreases to average 41.0%
- Daily rates adjust to average $299
Seasonality Insights for South Miami
- The Airbnb seasonality in South Miami shows moderate seasonality with distinct peak and low periods. While the sections above show seasonal averages, it's also insightful to look at the extremes:
- During the high season, the absolute peak month showcases South Miami's highest earning potential, with monthly revenues capable of climbing to $4,914, occupancy reaching a high of 56.4%, and ADRs peaking at $341.
- Conversely, the slowest single month of the year, typically falling within the low season, marks the market's lowest point. In this month, revenue might dip to $2,376, occupancy could drop to 36.8%, and ADRs may adjust down to $295.
- Understanding both the seasonal averages and these monthly peaks and troughs in revenue, occupancy, and ADR is crucial for maximizing your Airbnb profit potential in South Miami.
Seasonal Strategies for Maximizing Profit
- Peak Season: Maximize revenue through premium pricing and potentially longer minimum stays. Ensure high availability.
- Low Season: Offer competitive pricing, special promotions (e.g., extended stay discounts), and flexible cancellation policies. Target off-season travelers like remote workers or budget-conscious guests.
- Shoulder Seasons: Implement dynamic pricing that balances peak and low rates. Target weekend travelers or specific events. Offer slightly more flexible terms than peak season.
- Regularly analyze your own performance against these South Miami seasonality benchmarks and adjust your pricing and availability strategy accordingly.
Best Areas for Airbnb Investment in South Miami (2026)
Exploring the top neighborhoods for short-term rentals in South Miami? This section highlights key areas, outlining why they are attractive for hosts and guests, along with notable local attractions. Consider these locations based on your target guest profile and investment strategy.
| Neighborhood / Area | Why Host Here? (Target Guests & Appeal) | Key Attractions & Landmarks |
|---|---|---|
| Coral Gables | Known for its beautiful tree-lined streets, Mediterranean-style architecture, and upscale dining and shopping options. A sought-after location for both tourists and business travelers due to its proximity to Miami's urban core and Miami International Airport. | Venetian Pool, Miracle Mile, Fairchild Tropical Botanic Garden, Biltmore Hotel, Coral Gables Museum |
| Coconut Grove | A charming neighborhood with a bohemian vibe, lush greenery, and a strong arts scene. Popular for those seeking a relaxing, laid-back atmosphere near the water with plenty of parks and outdoor activities. | CocoWalk, Vizcaya Museum and Gardens, Bayshore Drive, Coconut Grove Arts Festival, Barnacle Historic State Park |
| South Beach | Iconic Miami Beach neighborhood known for its Art Deco architecture and vibrant nightlife. Prime location for tourists seeking the quintessential Miami experience with direct beach access and endless entertainment options. | Art Deco Historic District, Ocean Drive, Lummus Park Beach, Lincoln Road Mall, Española Way, Miami Beach Boardwalk |
| Downtown Miami | The bustling heart of Miami with a mix of corporate, cultural, and nightlife offerings. Easy access to major attractions and a hub for business travelers. | Bayside Marketplace, American Airlines Arena, Frost Museum of Science, Pérez Art Museum Miami, Bayfront Park |
| Key Biscayne | A tranquil island community known for beautiful beaches and outdoor activities. Attracts families and sun-seekers wanting a quieter beach experience away from the hustle and bustle of Miami Beach. | Crandon Park, Bill Baggs Cape Florida State Park, Key Biscayne Beach, Miami Seaquarium, Lighthouse Park |
| Little Havana | Vibrant Cuban neighborhood rich in culture, music, and food. Attracts visitors looking for an authentic cultural experience with lively street life and events. | Calle Ocho, Domino Park, Ball & Chain, Cuban Memorial Boulevard, The Tower Theater |
| Midtown Miami | A rapidly developing area combining residential and commercial spaces, with a youthful atmosphere and modern vibe. Popular among younger travelers and professionals. | The Shops at Midtown Miami, Miami Design District, WYNWOOD Walls, Midtown Boulevard, Locust Projects |
| Doral | An increasingly popular area with a mix of residential and commercial developments, known for its business parks, golf courses, and family-friendly atmosphere. Convenient for travelers visiting the area for business. | Doral Central Park, Miami International Mall, Doral Golf Resort & Spa, CityPlace Doral, Doral Meadow Park |
Understanding Airbnb License Requirements & STR Laws in South Miami (2026)
With 21% of listings showing registration in 2026, understanding potential Airbnb license requirements is crucial in South Miami. Always verify the latest short term rental regulations and Airbnb license requirements directly with local government authorities for South Miami to ensure full compliance before hosting.
(Source: AirROI data, 2026, based on 21% licensed listings)
Top Performing Airbnb Properties in South Miami (2026)
Benchmark your potential! Explore examples of top-performing Airbnb properties in South Miamibased on Trailing Twelve Month (TTM) revenue. Analyze their characteristics, revenue, occupancy rate, and ADR to understand what drives success in this market.

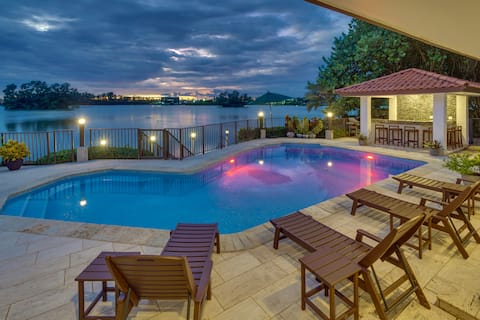
Modern Lakefront Villa w/ Pool, Jacuzzi and Gym
Entire Place • 5 bedrooms
Villa Amani
Entire Place • 8 bedrooms
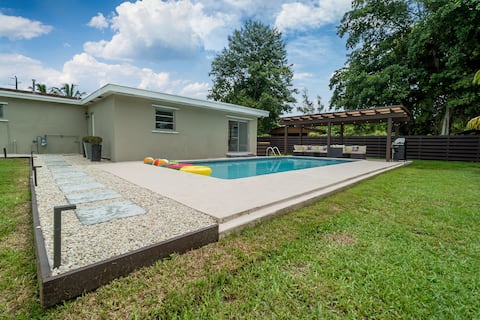
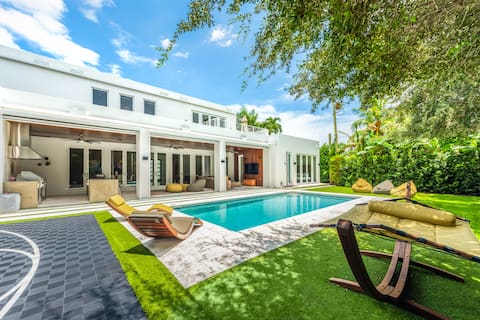
Modern Miami Retreat w/ Pool & Backyard Oasis
Entire Place • 5 bedrooms
Miami Lux Lake Front Retreat
Entire Place • 4 bedrooms
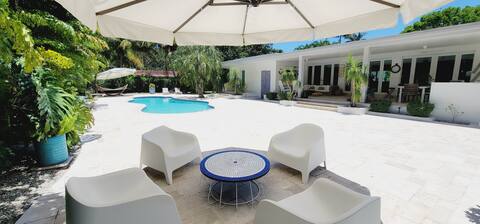
Maison Champagne, Miami Luxury Hideaway
Entire Place • 4 bedrooms
*POOL* |Sleeps 8|Near Coral Gables | Dadeland Mall
Entire Place • 4 bedrooms
Note: Performance varies based on location, size, amenities, seasonality, and management quality. Data reflects the past 12 months.
Top Performing Airbnb Hosts in South Miami (2026)
Learn from the best! This table showcases top-performing Airbnb hosts in South Miami based on the number of properties managed and estimated total revenue over the past year. Analyze their scale and performance metrics.
| Host Name | Properties | Grossing Revenue | Stay Reviews | Avg Rating |
|---|---|---|---|---|
| Andre | 1 | $314,796 | 24 | 5.00/5.0 |
| Lia | 1 | $246,534 | 9 | 5.00/5.0 |
| Luis | 1 | $184,828 | 65 | 4.80/5.0 |
| Nicholette | 4 | $172,036 | 510 | 4.81/5.0 |
| Omg Homes | 1 | $136,509 | 125 | 4.96/5.0 |
| Norvis | 1 | $112,831 | 70 | 4.97/5.0 |
| Dharma | 3 | $98,568 | 730 | 4.81/5.0 |
| Elsa | 1 | $89,791 | 125 | 4.89/5.0 |
| Ed | 4 | $80,463 | 236 | 4.89/5.0 |
| Angela | 2 | $72,780 | 105 | 5.00/5.0 |
Analyzing the strategies of top hosts, such as their property selection, pricing, and guest communication, can offer valuable lessons for optimizing your own Airbnb operations in South Miami.
Dive Deeper: Advanced South Miami STR Market Data (2026)
Ready to unlock more insights? AirROI provides access to advanced metrics and comprehensive Airbnb data for South Miami. Explore detailed analytics beyond this report to refine your investment strategy, optimize pricing, and maximize your vacation rental profits.
Explore Advanced MetricsSouth Miami Short-Term Rental Market Composition (2026): Property & Room Types
Room Type Distribution
Property Type Distribution
Market Composition Insights for South Miami
- The South Miami Airbnb market composition is heavily skewed towards Entire Home/Apt listings, which make up 67.8% of the 87 active rentals. This indicates strong guest preference for privacy and space.
- However, a notable 32.2% share for Private Rooms suggests opportunities for budget-conscious travelers or hosts renting out spare rooms.
- Looking at the property type distribution in South Miami, House properties are the most common (51.7%), reflecting the local real estate landscape.
- Houses represent a significant 51.7% portion, catering likely to families or larger groups.
- The presence of 23% Hotel/Boutique listings indicates integration with traditional hospitality.
South Miami Airbnb Room Capacity Analysis (2026): Bedroom Distribution
Distribution of Listings by Number of Bedrooms
Room Capacity Insights for South Miami
- The dominant room capacity in South Miami is 1 bedroom listings, making up 46% of the market. This suggests a strong demand for properties suitable for couples or solo travelers.
- Together, 1 bedroom and 2 bedrooms properties represent 56.3% of the active Airbnb listings in South Miami, indicating a high concentration in these sizes.
South Miami Vacation Rental Guest Capacity Trends (2026)
Distribution of Listings by Guest Capacity
Guest Capacity Insights for South Miami
- The most common guest capacity trend in South Miami vacation rentals is listings accommodating 2 guests (32.2%). This suggests the primary traveler segment is likely couples or solo travelers.
- Properties designed for 2 guests and 4 guests dominate the South Miami STR market, accounting for 49.4% of listings.
- 19.4% of properties accommodate 6+ guests, serving the market segment for larger families or group travel in South Miami.
- On average, properties in South Miami are equipped to host 3.2 guests.
South Miami Airbnb Booking Patterns (2026): Available vs. Booked Days
Available Days Distribution
Booked Days Distribution
Booking Pattern Insights for South Miami
- The most common availability pattern in South Miami falls within the 271-366 days range, representing 48.3% of listings. This suggests many properties have significant open periods on their calendars.
- Approximately 74.7% of listings show high availability (181+ days open annually), indicating potential for increased bookings or specific owner usage patterns.
- For booked days, the 31-90 days range is most frequent in South Miami (25.3%), reflecting common guest stay durations or potential owner blocking patterns.
- A notable 27.5% of properties secure long booking periods (181+ days booked per year), highlighting successful long-term rental strategies or significant owner usage.
South Miami Airbnb Minimum Stay Requirements Analysis
Distribution of Listings by Minimum Night Requirement
1 Night
12 listings
13.8% of total
2 Nights
30 listings
34.5% of total
3 Nights
5 listings
5.7% of total
4-6 Nights
8 listings
9.2% of total
7-29 Nights
10 listings
11.5% of total
30+ Nights
22 listings
25.3% of total
Key Insights
- The most prevalent minimum stay requirement in South Miami is 2 Nights, adopted by 34.5% of listings. This highlights the market's preference for shorter, flexible bookings.
- A significant segment (25.3%) caters to monthly stays (30+ nights) in South Miami, pointing to opportunities in the extended-stay market.
Recommendations
- Align with the market by considering a 2 Nights minimum stay, as 34.5% of South Miami hosts use this setting.
- If feasible, allowing 1-night stays, especially midweek or during low season, could capture last-minute bookings, as only 13.8% currently do.
- A 2-night minimum appears standard (34.5%). Consider this for weekends or peak periods.
- Explore offering discounts for stays of 30+ nights to attract the 25.3% of the market seeking extended stays.
- Adjust minimum nights based on seasonality – potentially shorter during low season and longer during peak demand periods in South Miami.
South Miami Airbnb Cancellation Policy Trends Analysis (2026)
Limited
3 listings
3.4% of total
Super Strict 30 Days
1 listings
1.1% of total
Flexible
11 listings
12.6% of total
Moderate
19 listings
21.8% of total
Firm
42 listings
48.3% of total
Strict
11 listings
12.6% of total
Cancellation Policy Insights for South Miami
- The prevailing Airbnb cancellation policy trend in South Miami is Firm, used by 48.3% of listings.
- A majority (60.9%) of hosts in South Miami utilize Firm or Strict policies, indicating a market where hosts prioritize booking security.
Recommendations for Hosts
- Consider adopting a Firm policy to align with the 48.3% market standard in South Miami.
- Using a Strict policy might deter some guests, as only 12.6% of listings use it. Evaluate if potential revenue protection outweighs possible lower booking rates.
- Regularly review your cancellation policy against competitors and market demand shifts in South Miami.
South Miami STR Booking Lead Time Analysis (2026)
Average Booking Lead Time by Month
Booking Lead Time Insights for South Miami
- The overall average booking lead time for vacation rentals in South Miami is 38 days.
- Guests book furthest in advance for stays during November (average 54 days), likely coinciding with peak travel demand or local events.
- The shortest booking windows occur for stays in June (average 22 days), indicating more last-minute travel plans during this time.
- Seasonally, Winter (43 days avg.) sees the longest lead times, while Summer (29 days avg.) has the shortest, reflecting typical travel planning cycles.
Recommendations for Hosts
- Use the overall average lead time (38 days) as a baseline for your pricing and availability strategy in South Miami.
- For November stays, consider implementing length-of-stay discounts or slightly higher rates for bookings made less than 54 days out to capitalize on advance planning.
- Target marketing efforts for the Winter season well in advance (at least 43 days) to capture early planners.
- Monitor your own booking lead times against these South Miami averages to identify opportunities for dynamic pricing adjustments.
Popular & Essential Airbnb Amenities in South Miami (2026)
Amenity Prevalence
Amenity Insights for South Miami
- Essential amenities in South Miami that guests expect include: Wifi, Air conditioning. Lacking these (any) could significantly impact bookings.
- Popular amenities like Smoke alarm, Hangers, Hot water are common but not universal. Offering these can provide a competitive edge.
Recommendations for Hosts
- Ensure your listing includes all essential amenities for South Miami: Wifi, Air conditioning.
- Consider adding popular differentiators like Smoke alarm or Hangers to increase appeal.
- Highlight unique or less common amenities you offer (e.g., hot tub, dedicated workspace, EV charger) in your listing description and photos.
- Regularly check competitor amenities in South Miami to stay competitive.
South Miami Airbnb Guest Demographics & Profile Analysis (2026)
Guest Profile Summary for South Miami
- The typical guest profile for Airbnb in South Miami consists of primarily domestic travelers (85%), often arriving from nearby Miami, typically belonging to the Post-2000s (Gen Z/Alpha) group (50%), primarily speaking English or Spanish.
- Domestic travelers account for 85.1% of guests.
- Key international markets include United States (85.1%) and United Kingdom (1.6%).
- Top languages spoken are English (55.1%) followed by Spanish (24.4%).
- A significant demographic segment is the Post-2000s (Gen Z/Alpha) group, representing 50% of guests.
Recommendations for Hosts
- Target domestic marketing efforts towards travelers from Miami and New York.
- Tailor amenities and listing descriptions to appeal to the dominant Post-2000s (Gen Z/Alpha) demographic (e.g., highlight fast WiFi, smart home features, local guides).
- Highlight unique local experiences or amenities relevant to the primary guest profile.
- Consider seasonal promotions aligned with peak travel times for key origin markets.
Nearby Short-Term Rental Market Comparison
How does the South Miami Airbnb market stack up against its neighbors? Compare key performance metrics like average monthly revenue, ADR, and occupancy rates in surrounding areas to understand the broader regional STR landscape.
| Market | Active Properties | Monthly Revenue | Daily Rate | Avg. Occupancy |
|---|---|---|---|---|
| Stock Island | 107 | $9,731 | $733.54 | 47% |
| Bal Harbour Village | 37 | $8,846 | $850.63 | 34% |
| Key West | 1,137 | $7,525 | $630.09 | 47% |
| Lake Clarke Shores | 26 | $6,710 | $516.52 | 46% |
| Lighthouse Point | 75 | $6,205 | $472.94 | 51% |
| Pinecrest | 11 | $6,117 | $861.24 | 43% |
| North Bay Village | 120 | $6,032 | $561.12 | 44% |
| Duck Key | 60 | $5,308 | $504.94 | 43% |
| Little Torch Key | 20 | $5,131 | $701.83 | 29% |
| Tequesta | 43 | $4,920 | $376.96 | 50% |