Vernon Airbnb Market Analysis 2026: Short Term Rental Data & Vacation Rental Statistics in Florida, United States
Is Airbnb profitable in Vernon in 2026? Explore comprehensive Airbnb analytics for Vernon, Florida, United States to uncover income potential. This 2026 STR market report for Vernon, based on AirROI data from July 2024 to June 2025, reveals key trends in the niche market of 18 active listings.
Whether you're considering an Airbnb investment in Vernon, optimizing your existing vacation rental, or exploring rental arbitrage opportunities, understanding the Vernon Airbnb data is crucial. Leveraging the low regulation environment is key to maximizing your short term rental income potential. Let's dive into the specifics.
Key Vernon Airbnb Performance Metrics Overview
Monthly Airbnb Revenue Variations & Income Potential in Vernon (2026)
Understanding the monthly revenue variations for Airbnb listings in Vernon is key to maximizing your short term rental income potential. Seasonality significantly impacts earnings. Our analysis, based on data from the past 12 months, shows that the peak revenue month for STRs in Vernon is typically July, while September often presents the lowest earnings, highlighting opportunities for strategic pricing adjustments during shoulder and low seasons. Explore the typical Airbnb income in Vernon across different performance tiers:
- Best-in-class properties (Top 10%) achieve $2,516+ monthly, often utilizing dynamic pricing and superior guest experiences.
- Strong performing properties (Top 25%) earn $1,796 or more, indicating effective management and desirable locations/amenities.
- Typical properties (Median) generate around $670 per month, representing the average market performance.
- Entry-level properties (Bottom 25%) see earnings around $267, often with potential for optimization.
Average Monthly Airbnb Earnings Trend in Vernon
Vernon Airbnb Occupancy Rate Trends (2026)
Maximize your bookings by understanding the Vernon STR occupancy trends. Seasonal demand shifts significantly influence how often properties are booked. Typically, Februarysees the highest demand (peak season occupancy), while September experiences the lowest (low season). Effective strategies, like adjusting minimum stays or offering promotions, can boost occupancy during slower periods. Here's how different property tiers perform in Vernon:
- Best-in-class properties (Top 10%) achieve 55%+ occupancy, indicating high desirability and potentially optimized availability.
- Strong performing properties (Top 25%) maintain 36% or higher occupancy, suggesting good market fit and guest satisfaction.
- Typical properties (Median) have an occupancy rate around 18%.
- Entry-level properties (Bottom 25%) average 10% occupancy, potentially facing higher vacancy.
Average Monthly Occupancy Rate Trend in Vernon
Average Daily Rate (ADR) Airbnb Trends in Vernon (2026)
Effective short term rental pricing strategy in Vernon involves understanding monthly ADR fluctuations. The Average Daily Rate (ADR) for Airbnb in Vernon typically peaks in June and dips lowest during January. Leveraging Airbnb dynamic pricing tools or strategies based on this seasonality can significantly boost revenue. Here's a look at the typical nightly rates achieved:
- Best-in-class properties (Top 10%) command rates of $182+ per night, often due to premium features or locations.
- Strong performing properties (Top 25%) achieve nightly rates of $159 or more.
- Typical properties (Median) charge around $129 per night.
- Entry-level properties (Bottom 25%) earn around $26 per night.
Average Daily Rate (ADR) Trend by Month in Vernon
Get Live Vernon Market Intelligence 👇
Explore Real-time Analytics
Airbnb Seasonality Analysis & Trends in Vernon (2025)
Peak Season (July, February, November)
- Revenue averages $1,509 per month
- Occupancy rates average 30.4%
- Daily rates average $105
Shoulder Season
- Revenue averages $1,165 per month
- Occupancy maintains around 27.2%
- Daily rates hold near $108
Low Season (January, May, September)
- Revenue drops to average $585 per month
- Occupancy decreases to average 14.4%
- Daily rates adjust to average $105
Seasonality Insights for Vernon
- The Airbnb seasonality in Vernon shows highly seasonal trends requiring careful strategy. While the sections above show seasonal averages, it's also insightful to look at the extremes:
- During the high season, the absolute peak month showcases Vernon's highest earning potential, with monthly revenues capable of climbing to $1,615, occupancy reaching a high of 35.7%, and ADRs peaking at $125.
- Conversely, the slowest single month of the year, typically falling within the low season, marks the market's lowest point. In this month, revenue might dip to $439, occupancy could drop to 11.9%, and ADRs may adjust down to $94.
- Understanding both the seasonal averages and these monthly peaks and troughs in revenue, occupancy, and ADR is crucial for maximizing your Airbnb profit potential in Vernon.
Seasonal Strategies for Maximizing Profit
- Peak Season: Maximize revenue through premium pricing and potentially longer minimum stays. Ensure high availability.
- Low Season: Offer competitive pricing, special promotions (e.g., extended stay discounts), and flexible cancellation policies. Target off-season travelers like remote workers or budget-conscious guests.
- Shoulder Seasons: Implement dynamic pricing that balances peak and low rates. Target weekend travelers or specific events. Offer slightly more flexible terms than peak season.
- Regularly analyze your own performance against these Vernon seasonality benchmarks and adjust your pricing and availability strategy accordingly.
Best Areas for Airbnb Investment in Vernon (2026)
Exploring the top neighborhoods for short-term rentals in Vernon? This section highlights key areas, outlining why they are attractive for hosts and guests, along with notable local attractions. Consider these locations based on your target guest profile and investment strategy.
| Neighborhood / Area | Why Host Here? (Target Guests & Appeal) | Key Attractions & Landmarks |
|---|---|---|
| Lakefront | Scenic views and access to the lake make this area popular among families and vacationers. Ideal for fishing, boating, and relaxation away from city life. | Vernon Lake, Vernon Sports Complex, Local parks, Fishing spots, Nature trails |
| Historic Downtown Vernon | Rich in history and culture, this area offers charming shops and local eateries. It's perfect for tourists wanting to explore the local heritage. | Vernon Museum, Local antique shops, Downtown park, Community events, Historic buildings |
| Vernon Hills | A quiet residential area that offers a suburban feel, appealing to families and those seeking a peaceful getaway close to nature. | Nature preserves, Local farms, Picnic areas, Walking trails |
| Riverbend | Located along the river, this area is great for outdoor activities and attracts nature lovers and adventure seekers. | River access, Kayaking, Hiking trails, Wildlife viewing, Fishing spots |
| West Vernon | A more rural area that provides a relaxing environment, ideal for guests looking to escape the hustle and bustle of urban life. | Farmers markets, Countryside, Local fairs, Outdoor events |
| Cypress Cove | Known for its quiet atmosphere and lake access, this location is sought after for weekend getaways and relaxation. | Cypress Cove Lake, Fishing, Picnic areas, Nature walks |
| Vernon Estates | A new development attracting young professionals and families, showcasing modern residential living with community amenities. | Community parks, Playgrounds, Sports facilities, Shopping nearby |
| East Vernon | This area offers a mix of residential and commercial spaces, appealing to business travelers and tourists looking for convenience. | Local shops, Restaurants, Cafes, Easy access to main roads |
Understanding Airbnb License Requirements & STR Laws in Vernon (2026)
While Vernon, Florida, United States currently shows low STR regulations, specific Airbnb license requirements might still exist or change. Always verify the latest short term rental regulations and Airbnb license requirements directly with local government authorities for Vernon to ensure full compliance before hosting.
(Source: AirROI data, 2026, finding no licensed listings among those analyzed)
Top Performing Airbnb Properties in Vernon (2026)
Benchmark your potential! Explore examples of top-performing Airbnb properties in Vernonbased on Trailing Twelve Month (TTM) revenue. Analyze their characteristics, revenue, occupancy rate, and ADR to understand what drives success in this market.

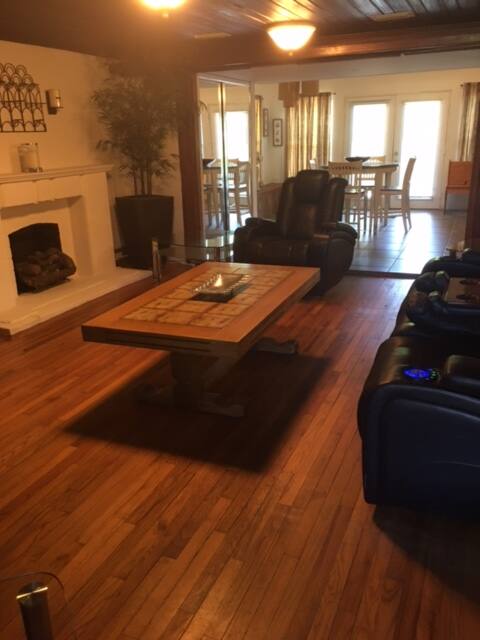
Entire home with lakefront access
Entire Place • 3 bedrooms
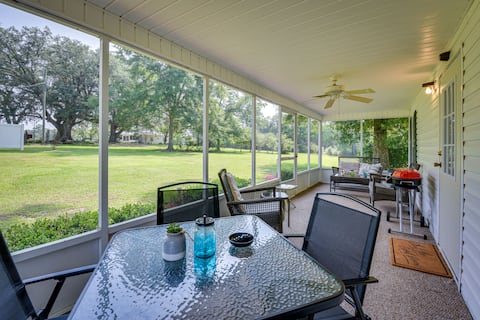
Sunny Florida Escape w/ Screened-In Patio & Grill!
Entire Place • 3 bedrooms
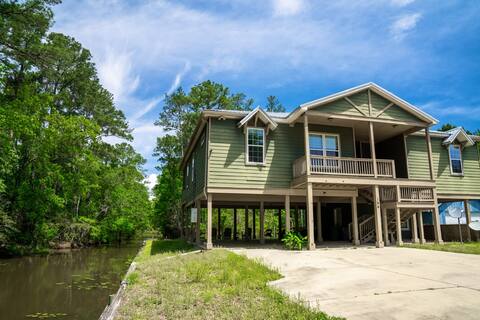
On The Canal | Pets | Riverfront
Entire Place • 3 bedrooms

River front cabin
Entire Place • 1 bedroom

River front 2 bedroom cabin
Entire Place • 2 bedrooms
2 BR 1 1/2 Bath Home 35 Mins to Panama City Beach
Entire Place • 2 bedrooms
Note: Performance varies based on location, size, amenities, seasonality, and management quality. Data reflects the past 12 months.
Top Performing Airbnb Hosts in Vernon (2026)
Learn from the best! This table showcases top-performing Airbnb hosts in Vernon based on the number of properties managed and estimated total revenue over the past year. Analyze their scale and performance metrics.
| Host Name | Properties | Grossing Revenue | Stay Reviews | Avg Rating |
|---|---|---|---|---|
| Matthew | 1 | $31,410 | 156 | 4.92/5.0 |
| Evolve | 1 | $22,434 | 29 | 4.97/5.0 |
| Ric N Liz | 3 | $20,303 | 14 | 4.85/5.0 |
| Host #339646061 | 8 | $19,509 | 45 | 4.96/5.0 |
| Jessica | 1 | $12,019 | 17 | 5.00/5.0 |
| Debra | 1 | $7,110 | 18 | 4.78/5.0 |
| Hank | 2 | $5,082 | 65 | 4.97/5.0 |
| Les&Sue | 1 | $4,183 | 9 | 4.89/5.0 |
Analyzing the strategies of top hosts, such as their property selection, pricing, and guest communication, can offer valuable lessons for optimizing your own Airbnb operations in Vernon.
Dive Deeper: Advanced Vernon STR Market Data (2026)
Ready to unlock more insights? AirROI provides access to advanced metrics and comprehensive Airbnb data for Vernon. Explore detailed analytics beyond this report to refine your investment strategy, optimize pricing, and maximize your vacation rental profits.
Explore Advanced MetricsVernon Short-Term Rental Market Composition (2026): Property & Room Types
Room Type Distribution
Property Type Distribution
Market Composition Insights for Vernon
- The Vernon Airbnb market composition is heavily skewed towards Entire Home/Apt listings, which make up 83.3% of the 18 active rentals. This indicates strong guest preference for privacy and space.
- Looking at the property type distribution in Vernon, Outdoor/Unique properties are the most common (55.6%), reflecting the local real estate landscape.
- Houses represent a significant 27.8% portion, catering likely to families or larger groups.
Vernon Airbnb Room Capacity Analysis (2026): Bedroom Distribution
Distribution of Listings by Number of Bedrooms
Room Capacity Insights for Vernon
- The dominant room capacity in Vernon is 1 bedroom listings, making up 66.7% of the market. This suggests a strong demand for properties suitable for couples or solo travelers.
- Together, 1 bedroom and 2 bedrooms properties represent 83.4% of the active Airbnb listings in Vernon, indicating a high concentration in these sizes.
- With over half the market (66.7%) consisting of studios or 1-bedroom units, Vernon is particularly well-suited for individuals or couples.
Vernon Vacation Rental Guest Capacity Trends (2026)
Distribution of Listings by Guest Capacity
Guest Capacity Insights for Vernon
- The most common guest capacity trend in Vernon vacation rentals is listings accommodating 8+ guests (33.3%). This suggests the primary traveler segment is likely larger groups.
- Properties designed for 8+ guests and 6 guests dominate the Vernon STR market, accounting for 55.5% of listings.
- 61.1% of properties accommodate 6+ guests, serving the market segment for larger families or group travel in Vernon.
- On average, properties in Vernon are equipped to host 5.8 guests.
Vernon Airbnb Booking Patterns (2026): Available vs. Booked Days
Available Days Distribution
Booked Days Distribution
Booking Pattern Insights for Vernon
- The most common availability pattern in Vernon falls within the 271-366 days range, representing 88.9% of listings. This suggests many properties have significant open periods on their calendars.
- Approximately 94.5% of listings show high availability (181+ days open annually), indicating potential for increased bookings or specific owner usage patterns.
- For booked days, the 31-90 days range is most frequent in Vernon (44.4%), reflecting common guest stay durations or potential owner blocking patterns.
- A notable 5.6% of properties secure long booking periods (181+ days booked per year), highlighting successful long-term rental strategies or significant owner usage.
Vernon Airbnb Minimum Stay Requirements Analysis
Distribution of Listings by Minimum Night Requirement
1 Night
4 listings
40% of total
2 Nights
4 listings
40% of total
3 Nights
1 listings
10% of total
30+ Nights
1 listings
10% of total
Key Insights
- The most prevalent minimum stay requirement in Vernon is 1 Night, adopted by 40% of listings. This highlights the market's preference for shorter, flexible bookings.
- A strong majority (80.0%) of the Vernon Airbnb data shows acceptance of very short stays (1-2 nights), indicating a dynamic, high-turnover market.
Recommendations
- Align with the market by considering a 1 Night minimum stay, as 40% of Vernon hosts use this setting.
- Explore offering discounts for stays of 30+ nights to attract the 10% of the market seeking extended stays.
- Adjust minimum nights based on seasonality – potentially shorter during low season and longer during peak demand periods in Vernon.
Vernon Airbnb Cancellation Policy Trends Analysis (2026)
Flexible
1 listings
12.5% of total
Moderate
1 listings
12.5% of total
Firm
2 listings
25% of total
Strict
4 listings
50% of total
Cancellation Policy Insights for Vernon
- The prevailing Airbnb cancellation policy trend in Vernon is Strict, used by 50% of listings.
- A majority (75.0%) of hosts in Vernon utilize Firm or Strict policies, indicating a market where hosts prioritize booking security.
Recommendations for Hosts
- Consider adopting a Strict policy to align with the 50% market standard in Vernon.
- With 50% using Strict terms, this is a viable option in Vernon, particularly for high-value properties or during peak demand periods.
- Regularly review your cancellation policy against competitors and market demand shifts in Vernon.
Vernon STR Booking Lead Time Analysis (2026)
Average Booking Lead Time by Month
Booking Lead Time Insights for Vernon
- The overall average booking lead time for vacation rentals in Vernon is 18 days.
- Guests book furthest in advance for stays during June (average 58 days), likely coinciding with peak travel demand or local events.
- The shortest booking windows occur for stays in September (average 3 days), indicating more last-minute travel plans during this time.
- Seasonally, Spring (33 days avg.) sees the longest lead times, while Winter (12 days avg.) has the shortest, reflecting typical travel planning cycles.
Recommendations for Hosts
- Use the overall average lead time (18 days) as a baseline for your pricing and availability strategy in Vernon.
- For June stays, consider implementing length-of-stay discounts or slightly higher rates for bookings made less than 58 days out to capitalize on advance planning.
- During September, focus on last-minute booking availability and promotions, as guests book with very short notice (3 days avg.).
- Target marketing efforts for the Spring season well in advance (at least 33 days) to capture early planners.
- Monitor your own booking lead times against these Vernon averages to identify opportunities for dynamic pricing adjustments.
Popular & Essential Airbnb Amenities in Vernon (2026)
Amenity data is currently unavailable for Vernon.
Vernon Airbnb Guest Demographics & Profile Analysis (2026)
Guest Profile Summary for Vernon
- The typical guest profile for Airbnb in Vernon consists of primarily domestic travelers (99%), often arriving from nearby Pensacola, typically belonging to the Post-2000s (Gen Z/Alpha) group (50%), primarily speaking English or Spanish.
- Domestic travelers account for 98.7% of guests.
- Key international markets include United States (98.7%) and Puerto Rico (1.3%).
- Top languages spoken are English (87.2%) followed by Spanish (5.1%).
- A significant demographic segment is the Post-2000s (Gen Z/Alpha) group, representing 50% of guests.
Recommendations for Hosts
- Target domestic marketing efforts towards travelers from Pensacola and New Orleans.
- Tailor amenities and listing descriptions to appeal to the dominant Post-2000s (Gen Z/Alpha) demographic (e.g., highlight fast WiFi, smart home features, local guides).
- Highlight unique local experiences or amenities relevant to the primary guest profile.
- Consider seasonal promotions aligned with peak travel times for key origin markets.
Nearby Short-Term Rental Market Comparison
How does the Vernon Airbnb market stack up against its neighbors? Compare key performance metrics like average monthly revenue, ADR, and occupancy rates in surrounding areas to understand the broader regional STR landscape.
| Market | Active Properties | Monthly Revenue | Daily Rate | Avg. Occupancy |
|---|---|---|---|---|
| Seacrest Beach | 352 | $5,520 | $540.61 | 41% |
| Alys Beach | 423 | $5,455 | $593.33 | 40% |
| Seaside | 593 | $5,442 | $689.79 | 36% |
| Inlet Beach | 75 | $4,827 | $494.23 | 40% |
| Rosemary Beach | 496 | $4,811 | $564.30 | 38% |
| Saint George Island | 145 | $4,281 | $464.06 | 40% |
| Watersound | 98 | $4,082 | $424.90 | 38% |
| Saint Teresa | 10 | $4,074 | $323.79 | 42% |
| Santa Rosa Beach | 2,808 | $4,042 | $464.88 | 38% |
| Alligator Point | 52 | $3,861 | $285.02 | 47% |