Darien Airbnb Market Analysis 2026: Short Term Rental Data & Vacation Rental Statistics in Georgia, United States
Is Airbnb profitable in Darien in 2026? Explore comprehensive Airbnb analytics for Darien, Georgia, United States to uncover income potential. This 2026 STR market report for Darien, based on AirROI data from February 2025 to January 2026, reveals key trends in the niche market of 55 active listings.
Whether you're considering an Airbnb investment in Darien, optimizing your existing vacation rental, or exploring rental arbitrage opportunities, understanding the Darien Airbnb data is crucial. Leveraging the low regulation environment is key to maximizing your short term rental income potential. Let's dive into the specifics.
Key Darien Airbnb Performance Metrics Overview
Monthly Airbnb Revenue Variations & Income Potential in Darien (2026)
Understanding the monthly revenue variations for Airbnb listings in Darien is key to maximizing your short term rental income potential. Seasonality significantly impacts earnings. Our analysis, based on data from the past 12 months, shows that the peak revenue month for STRs in Darien is typically June, while September often presents the lowest earnings, highlighting opportunities for strategic pricing adjustments during shoulder and low seasons. Explore the typical Airbnb income in Darien across different performance tiers:
- Best-in-class properties (Top 10%) achieve $6,277+ monthly, often utilizing dynamic pricing and superior guest experiences.
- Strong performing properties (Top 25%) earn $3,864 or more, indicating effective management and desirable locations/amenities.
- Typical properties (Median) generate around $2,109 per month, representing the average market performance.
- Entry-level properties (Bottom 25%) see earnings around $1,140, often with potential for optimization.
Average Monthly Airbnb Earnings Trend in Darien
Darien Airbnb Occupancy Rate Trends (2026)
Maximize your bookings by understanding the Darien STR occupancy trends. Seasonal demand shifts significantly influence how often properties are booked. Typically, Octobersees the highest demand (peak season occupancy), while September experiences the lowest (low season). Effective strategies, like adjusting minimum stays or offering promotions, can boost occupancy during slower periods. Here's how different property tiers perform in Darien:
- Best-in-class properties (Top 10%) achieve 73%+ occupancy, indicating high desirability and potentially optimized availability.
- Strong performing properties (Top 25%) maintain 55% or higher occupancy, suggesting good market fit and guest satisfaction.
- Typical properties (Median) have an occupancy rate around 35%.
- Entry-level properties (Bottom 25%) average 19% occupancy, potentially facing higher vacancy.
Average Monthly Occupancy Rate Trend in Darien
Average Daily Rate (ADR) Airbnb Trends in Darien (2026)
Effective short term rental pricing strategy in Darien involves understanding monthly ADR fluctuations. The Average Daily Rate (ADR) for Airbnb in Darien typically peaks in September and dips lowest during February. Leveraging Airbnb dynamic pricing tools or strategies based on this seasonality can significantly boost revenue. Here's a look at the typical nightly rates achieved:
- Best-in-class properties (Top 10%) command rates of $366+ per night, often due to premium features or locations.
- Strong performing properties (Top 25%) achieve nightly rates of $247 or more.
- Typical properties (Median) charge around $181 per night.
- Entry-level properties (Bottom 25%) earn around $153 per night.
Average Daily Rate (ADR) Trend by Month in Darien
Get Live Darien Market Intelligence 👇

Explore Real-time Analytics
Airbnb Seasonality Analysis & Trends in Darien (2026)
Peak Season (June, July, May)
- Revenue averages $3,873 per month
- Occupancy rates average 40.3%
- Daily rates average $267
Shoulder Season
- Revenue averages $3,113 per month
- Occupancy maintains around 39.9%
- Daily rates hold near $263
Low Season (February, September, November)
- Revenue drops to average $2,313 per month
- Occupancy decreases to average 33.6%
- Daily rates adjust to average $266
Seasonality Insights for Darien
- The Airbnb seasonality in Darien shows moderate seasonality with distinct peak and low periods. While the sections above show seasonal averages, it's also insightful to look at the extremes:
- During the high season, the absolute peak month showcases Darien's highest earning potential, with monthly revenues capable of climbing to $4,072, occupancy reaching a high of 45.8%, and ADRs peaking at $276.
- Conversely, the slowest single month of the year, typically falling within the low season, marks the market's lowest point. In this month, revenue might dip to $1,945, occupancy could drop to 26.2%, and ADRs may adjust down to $253.
- Understanding both the seasonal averages and these monthly peaks and troughs in revenue, occupancy, and ADR is crucial for maximizing your Airbnb profit potential in Darien.
Seasonal Strategies for Maximizing Profit
- Peak Season: Maximize revenue through premium pricing and potentially longer minimum stays. Ensure high availability.
- Low Season: Offer competitive pricing, special promotions (e.g., extended stay discounts), and flexible cancellation policies. Target off-season travelers like remote workers or budget-conscious guests.
- Shoulder Seasons: Implement dynamic pricing that balances peak and low rates. Target weekend travelers or specific events. Offer slightly more flexible terms than peak season.
- Regularly analyze your own performance against these Darien seasonality benchmarks and adjust your pricing and availability strategy accordingly.
Best Areas for Airbnb Investment in Darien (2026)
Exploring the top neighborhoods for short-term rentals in Darien? This section highlights key areas, outlining why they are attractive for hosts and guests, along with notable local attractions. Consider these locations based on your target guest profile and investment strategy.
| Neighborhood / Area | Why Host Here? (Target Guests & Appeal) | Key Attractions & Landmarks |
|---|---|---|
| Historic District | Darien's Historic District features charming antebellum homes and a rich cultural heritage that attracts history enthusiasts and tourists. | Darien River, Fort King George, The Darien Historic District, Local seafood restaurants, Darien-McIntosh County Chamber of Commerce |
| Sapelo Island | This remote island offers pristine beaches and natural beauty, making it a unique getaway for nature lovers and those seeking solitude. | Sapelo Island National Estuarine Research Reserve, Ridge Island, Hog Hammock Historic District, Reynolds Mansion, Blackbeard Island |
| Altamaha River | A picturesque location for outdoor enthusiasts, the Altamaha River provides opportunities for fishing, kayaking, and bird watching, ideal for eco-tourism. | Altamaha River State Park, Boat rentals, Fishing spots, Nature trails, Wildlife viewing areas |
| St. Simons Island | Nearby St. Simons Island is a popular tourist destination with beautiful beaches, golf courses, and historic sites, appealing to vacationers. | St. Simons Lighthouse Museum, East Beach, Fort Frederica National Monument, Saint Simons Island Pier, Golf courses |
| Coastal Georgia Historical Society | This area showcases the rich cultural heritage of the region and attracts visitors interested in history and education. | Glynn County Historical Society, Local galleries, Historical walking tours, Art exhibitions, Cultural events |
| Darien Waterfront | The waterfront offers beautiful views and opportunities for boating and fishing, drawing visitors looking for a relaxing coastal experience. | Darien River waterfront, Fishing docks, Boat ramps, Picnic areas, Local seafood markets |
| McIntosh County | This rural area is known for its scenic beauty and agricultural richness, appealing to visitors interested in rural tourism and nature. | McIntosh County Historic Sites, Fruit and vegetable farms, Agritourism experiences, Nature trails, Local farmers markets |
| Local Festivals | Darien hosts several festivals throughout the year, which draw visitors and create opportunities for short-term rentals during peak times. | Darien Shrimp Festival, Blessing of the Fleet, Arts and crafts fairs, Food festivals, Live music events |
Understanding Airbnb License Requirements & STR Laws in Darien (2026)
While Darien, Georgia, United States currently shows low STR regulations, specific Airbnb license requirements might still exist or change. Always verify the latest short term rental regulations and Airbnb license requirements directly with local government authorities for Darien to ensure full compliance before hosting.
(Source: AirROI data, 2026, finding no licensed listings among those analyzed)
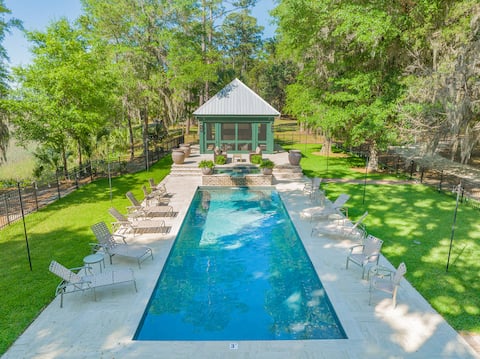
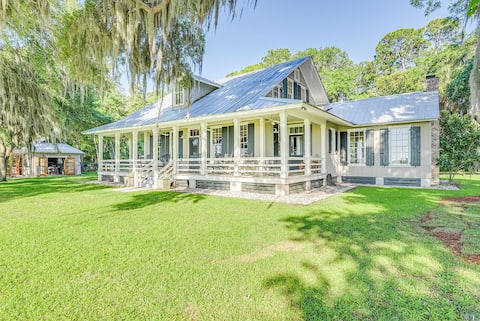
Top Performing Airbnb Properties in Darien (2026)
Benchmark your potential! Explore examples of top-performing Airbnb properties in Darienbased on Trailing Twelve Month (TTM) revenue. Analyze their characteristics, revenue, occupancy rate, and ADR to understand what drives success in this market.
Emmas Driftwood Farm- coastal retreats & reunions
Entire Place • 13 bedrooms
Historical cottage w/ dock, oyster house, & sauna!
Entire Place • 4 bedrooms

Private Hot Tub w/ Views, Deep-Water Dock,Sleeps 6
Entire Place • 3 bedrooms

Stylish Luxury Marsh Retreat on Deep Water Creek
Entire Place • 3 bedrooms

Marshview, w/Deepwater, Dock & Screened in porch
Entire Place • 3 bedrooms

6 Bedrooms on 2.5 acres. Panoramic Marsh Views!
Entire Place • 6 bedrooms
Note: Performance varies based on location, size, amenities, seasonality, and management quality. Data reflects the past 12 months.
Top Performing Airbnb Hosts in Darien (2026)
Learn from the best! This table showcases top-performing Airbnb hosts in Darien based on the number of properties managed and estimated total revenue over the past year. Analyze their scale and performance metrics.
| Host Name | Properties | Grossing Revenue | Stay Reviews | Avg Rating |
|---|---|---|---|---|
| Mountain & Marsh | 6 | $463,203 | 79 | 4.96/5.0 |
| Evolve | 2 | $118,202 | 129 | 4.93/5.0 |
| Covenant Property Management | 1 | $73,904 | 35 | 4.97/5.0 |
| Whitney | 1 | $69,498 | 162 | 4.94/5.0 |
| Richard | 2 | $67,009 | 75 | 4.95/5.0 |
| Cindy | 1 | $64,733 | 31 | 5.00/5.0 |
| Stephanus George | 1 | $61,765 | 56 | 4.98/5.0 |
| Zach & Carrie | 4 | $54,729 | 18 | 4.95/5.0 |
| JoAnn | 6 | $50,724 | 91 | 4.93/5.0 |
| Larisa | 1 | $48,249 | 59 | 4.92/5.0 |
Analyzing the strategies of top hosts, such as their property selection, pricing, and guest communication, can offer valuable lessons for optimizing your own Airbnb operations in Darien.
Dive Deeper: Advanced Darien STR Market Data (2026)
Ready to unlock more insights? AirROI provides access to advanced metrics and comprehensive Airbnb data for Darien. Explore detailed analytics beyond this report to refine your investment strategy, optimize pricing, and maximize your vacation rental profits.
Explore Advanced MetricsDarien Short-Term Rental Market Composition (2026): Property & Room Types
Room Type Distribution
Property Type Distribution
Market Composition Insights for Darien
- The Darien Airbnb market composition is heavily skewed towards Entire Home/Apt listings, which make up 80% of the 55 active rentals. This indicates strong guest preference for privacy and space.
- Looking at the property type distribution in Darien, House properties are the most common (56.4%), reflecting the local real estate landscape.
- Houses represent a significant 56.4% portion, catering likely to families or larger groups.
- The presence of 23.6% Hotel/Boutique listings indicates integration with traditional hospitality.
Darien Airbnb Room Capacity Analysis (2026): Bedroom Distribution
Distribution of Listings by Number of Bedrooms
Room Capacity Insights for Darien
- The dominant room capacity in Darien is 2 bedrooms listings, making up 29.1% of the market. This suggests a strong demand for properties suitable for couples or solo travelers.
- Together, 2 bedrooms and 1 bedroom properties represent 50.9% of the active Airbnb listings in Darien, indicating a high concentration in these sizes.
- A significant 36.3% of listings offer 3+ bedrooms, catering to larger groups and families seeking more space in Darien.
Darien Vacation Rental Guest Capacity Trends (2026)
Distribution of Listings by Guest Capacity
Guest Capacity Insights for Darien
- The most common guest capacity trend in Darien vacation rentals is listings accommodating 8+ guests (27.3%). This suggests the primary traveler segment is likely larger groups.
- Properties designed for 8+ guests and 6 guests dominate the Darien STR market, accounting for 50.9% of listings.
- 50.9% of properties accommodate 6+ guests, serving the market segment for larger families or group travel in Darien.
- On average, properties in Darien are equipped to host 4.8 guests.
Darien Airbnb Booking Patterns (2026): Available vs. Booked Days
Available Days Distribution
Booked Days Distribution
Booking Pattern Insights for Darien
- The most common availability pattern in Darien falls within the 271-366 days range, representing 45.5% of listings. This suggests many properties have significant open periods on their calendars.
- Approximately 80.0% of listings show high availability (181+ days open annually), indicating potential for increased bookings or specific owner usage patterns.
- For booked days, the 91-180 days range is most frequent in Darien (34.5%), reflecting common guest stay durations or potential owner blocking patterns.
- A notable 20.0% of properties secure long booking periods (181+ days booked per year), highlighting successful long-term rental strategies or significant owner usage.
Darien Airbnb Minimum Stay Requirements Analysis
Distribution of Listings by Minimum Night Requirement
1 Night
22 listings
40% of total
2 Nights
16 listings
29.1% of total
3 Nights
6 listings
10.9% of total
7-29 Nights
2 listings
3.6% of total
30+ Nights
9 listings
16.4% of total
Key Insights
- The most prevalent minimum stay requirement in Darien is 1 Night, adopted by 40% of listings. This highlights the market's preference for shorter, flexible bookings.
- A strong majority (69.1%) of the Darien Airbnb data shows acceptance of very short stays (1-2 nights), indicating a dynamic, high-turnover market.
- A significant segment (16.4%) caters to monthly stays (30+ nights) in Darien, pointing to opportunities in the extended-stay market.
Recommendations
- Align with the market by considering a 1 Night minimum stay, as 40% of Darien hosts use this setting.
- Explore offering discounts for stays of 30+ nights to attract the 16.4% of the market seeking extended stays.
- Adjust minimum nights based on seasonality – potentially shorter during low season and longer during peak demand periods in Darien.
Darien Airbnb Cancellation Policy Trends Analysis (2026)
Super Strict 60 Days
1 listings
1.8% of total
Flexible
15 listings
27.3% of total
Moderate
13 listings
23.6% of total
Firm
22 listings
40% of total
Strict
4 listings
7.3% of total
Cancellation Policy Insights for Darien
- The prevailing Airbnb cancellation policy trend in Darien is Firm, used by 40% of listings.
- There's a relatively balanced mix between guest-friendly (50.9%) and stricter (47.3%) policies, offering choices for different guest needs.
- Strict cancellation policies are quite rare (7.3%), potentially making listings with this policy less competitive unless justified by high demand or property type.
Recommendations for Hosts
- Consider adopting a Firm policy to align with the 40% market standard in Darien.
- Using a Strict policy might deter some guests, as only 7.3% of listings use it. Evaluate if potential revenue protection outweighs possible lower booking rates.
- Regularly review your cancellation policy against competitors and market demand shifts in Darien.
Darien STR Booking Lead Time Analysis (2026)
Average Booking Lead Time by Month
Booking Lead Time Insights for Darien
- The overall average booking lead time for vacation rentals in Darien is 60 days.
- Guests book furthest in advance for stays during October (average 88 days), likely coinciding with peak travel demand or local events.
- The shortest booking windows occur for stays in January (average 34 days), indicating more last-minute travel plans during this time.
- Seasonally, Fall (73 days avg.) sees the longest lead times, while Summer (49 days avg.) has the shortest, reflecting typical travel planning cycles.
Recommendations for Hosts
- Use the overall average lead time (60 days) as a baseline for your pricing and availability strategy in Darien.
- For October stays, consider implementing length-of-stay discounts or slightly higher rates for bookings made less than 88 days out to capitalize on advance planning.
- Target marketing efforts for the Fall season well in advance (at least 73 days) to capture early planners.
- Monitor your own booking lead times against these Darien averages to identify opportunities for dynamic pricing adjustments.
Popular & Essential Airbnb Amenities in Darien (2026)
Amenity Prevalence
Amenity Insights for Darien
- Essential amenities in Darien that guests expect include: Air conditioning, Wifi, Free parking on premises, TV. Lacking these (any) could significantly impact bookings.
- Popular amenities like Smoke alarm, Heating, Hair dryer are common but not universal. Offering these can provide a competitive edge.
Recommendations for Hosts
- Ensure your listing includes all essential amenities for Darien: Air conditioning, Wifi, Free parking on premises, TV.
- Prioritize adding missing essentials: Wifi, Free parking on premises, TV.
- Consider adding popular differentiators like Smoke alarm or Heating to increase appeal.
- Highlight unique or less common amenities you offer (e.g., hot tub, dedicated workspace, EV charger) in your listing description and photos.
- Regularly check competitor amenities in Darien to stay competitive.
Darien Airbnb Guest Demographics & Profile Analysis (2026)
Guest Profile Summary for Darien
- The typical guest profile for Airbnb in Darien consists of primarily domestic travelers (99%), often arriving from nearby Atlanta, typically belonging to the Post-2000s (Gen Z/Alpha) group (50%), primarily speaking English or Spanish.
- Domestic travelers account for 98.8% of guests.
- Key international markets include United States (98.8%) and Canada (0.5%).
- Top languages spoken are English (84%) followed by Spanish (7.7%).
- A significant demographic segment is the Post-2000s (Gen Z/Alpha) group, representing 50% of guests.
Recommendations for Hosts
- Target domestic marketing efforts towards travelers from Atlanta and New York.
- Tailor amenities and listing descriptions to appeal to the dominant Post-2000s (Gen Z/Alpha) demographic (e.g., highlight fast WiFi, smart home features, local guides).
- Highlight unique local experiences or amenities relevant to the primary guest profile.
- Consider seasonal promotions aligned with peak travel times for key origin markets.
Nearby Short-Term Rental Market Comparison
How does the Darien Airbnb market stack up against its neighbors? Compare key performance metrics like average monthly revenue, ADR, and occupancy rates in surrounding areas to understand the broader regional STR landscape.
| Market | Active Properties | Monthly Revenue | Daily Rate | Avg. Occupancy |
|---|---|---|---|---|
| St. Johns County | 12 | $6,964 | $592.43 | 47% |
| Talahi Island | 41 | $6,064 | $358.56 | 51% |
| Ponte Vedra Beach | 224 | $5,720 | $574.75 | 43% |
| Okatie | 11 | $5,231 | $510.60 | 41% |
| Kiawah Island | 624 | $4,526 | $615.10 | 34% |
| Whitemarsh Island | 82 | $4,450 | $305.48 | 49% |
| Tybee Island | 1,356 | $4,376 | $423.03 | 42% |
| St. Simons | 91 | $4,162 | $379.84 | 42% |
| Jacksonville Beach | 763 | $4,123 | $328.32 | 49% |
| Wilmington Island | 113 | $3,954 | $322.99 | 46% |